THE basic measurements on microphones concern frequency response, directional characteristics and sensitivity. Other measurements deal with its electrical properties, but these are the ones in which acoustic performance is specifically involved.
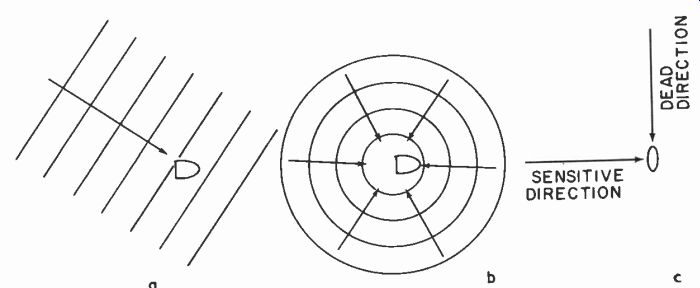
Fig. 1001. The electro-acoustic response of a microphone can refer (a) to
its sensitivity from a particular direction, (b) to its overall pickup from
all directions, or (c) to a specifically direction-sensitive characteristic.
Acoustic properties
The electro-acoustic frequency response of a microphone can mean either the response to a wave arriving from a specific direction or the total response of the microphone to sound energy arriving in all directions. This is closely related to the terms of reference used for sound waves, whether velocity or pressure (Fig. 1001). A microphone that is basically pressure-sensitive (by having only one side of its diaphragm communicating with the sound field) is not appreciably directional, and indicates the average sound pressure at its surface.
While the dimensions of such a microphone remain small relative to the wavelength of operating frequencies, there is little discrepancy between the two forms of frequency response. But if the microphone employs a deliberately directional characteristic, such as a bi-directional ribbon or a unidirectional cardioid type that is, or includes a velocity-sensitive element, direction can make considerable difference.
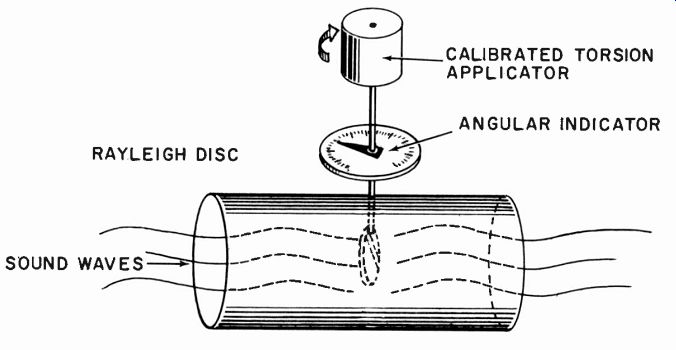
Fig. 1002. Method of using Rayleigh disc to calibrate the particle velocity
in a sound wave.
A microphone that is essentially pressure-operated and gives an output proportional to pressure fluctuations on one side of its diaphragm performs independently of the direction of arrival of the wave provided the frequencies used are such that the dimensions of the microphone, particularly its diaphragm, are always small compared to wavelength.
The classic way of calibrating a sound field uses a Rayleigh disc which gives a measurement of particle velocity (see Fig. 1002). The corresponding sound pressure can be calculated from the measured air constants, density and pressure (or elasticity) . The relevant formulas are:
p = Cpp and c2 = yPo P
where p = sound pressure in dynes per cm^2, c = propagation velocity of sound in cm/sec., p = density of air, grams/cm^3, p = particle velocity (measured on Rayleigh disc) cm/sec., 13. =- static air pressure, dynes/cm^2, y = specific heat ratio (1.4 for air). An average value for cp in air is 42.
By using substitution or symmetrical arrangements (Fig. 1003) , the performance of the microphone in an identical position can be obtained. This will detect the sensitivity characteristic and thus its frequency response from this particular direction.
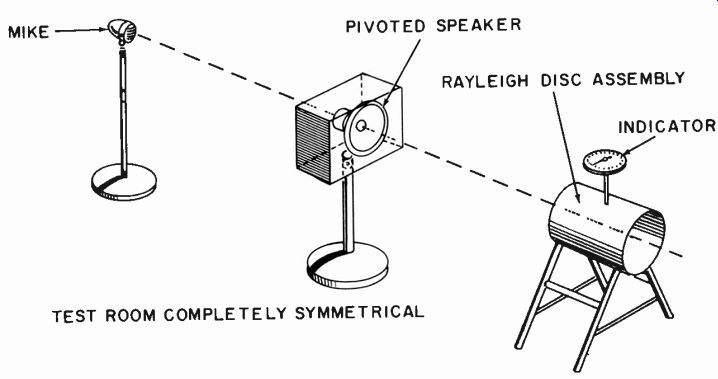
Fig. 1003. Use of Rayleigh disc in a symmetrical arrangement to calibrate
microphone response.
The response can be taken by orienting the microphone in different positions to find where deviation occurs (particularly at higher frequencies) due to the angle at which the wave approaches.
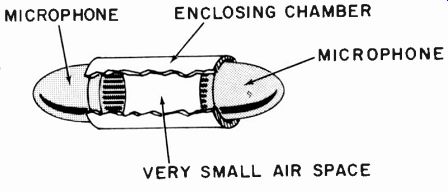
Fig. 1004. Enclosed reciprocity method.
It is important, in making a measurement at each frequency, to adjust the sound velocity, and thus the pressure, at the point where the microphone is placed, to the required value. Wave reflections occurring in the test apparatus (if the equipment is put in a tunnel for example, from the surfaces of the tunnel) can produce accentuation of certain frequencies. This must be compensated for in taking the frequency response and this is also why we need an absolute measure of sound velocity or pressure such as the Rayleigh disc.
An alternative approach to calibrating a pressure-operated microphone uses the reciprocity method. In this case the microphone has no access to free space. Two identical microphones are closely coupled, one being used as a speaker and the other as a micro phone that picks up the total sound "radiated" by the first (Fig. 1004). The contained air volume must be such that there is no time for the development of an appreciable portion of a wave at any test frequency. In other words, all the drive microphone does is to produce pressure variations in the enclosed chamber, which the other microphone then detects.
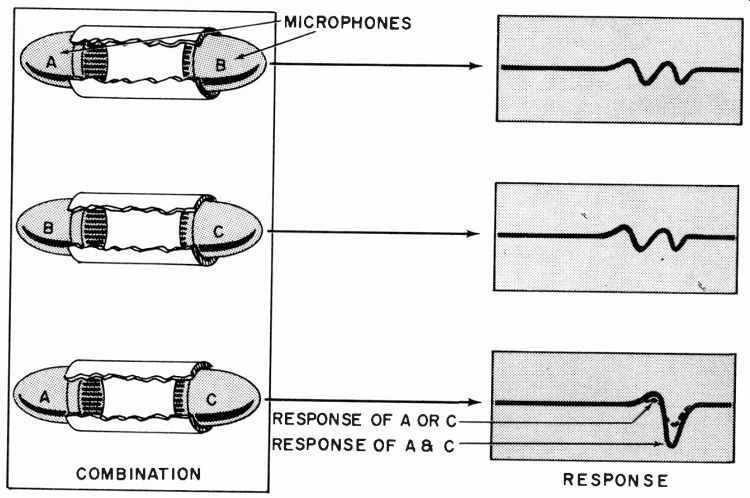
Fig. 1005. Deducing the response when two out of three microphones prove
to be identical.
Microphones may be regarded as having reciprocal characteristics. If they are identical, the frequency response of the unit driving the air as a transducer is identical with the pickup response of the other detecting the pressure variations produced. Thus the overall frequency response plotted in this way is due half to the drive unit and half to the pickup unit (on a db basis).
This is true provided the dimensions of the enclosed air are small compared to wavelengths of the test frequencies. Obviously this applies only to microphones where the diaphragm is correspondingly small. It is useful for very small capacitor type micro phones and some of the more modern miniature dynamic kinds.
Of course, the two microphones must be identical. To check identity use three microphones and all three possible combinations of two to check that the reciprocity result is the same between all pairs. If only two of three possible combinations produce identical responses, the identical pair is the third combination (Fig. 1005) .
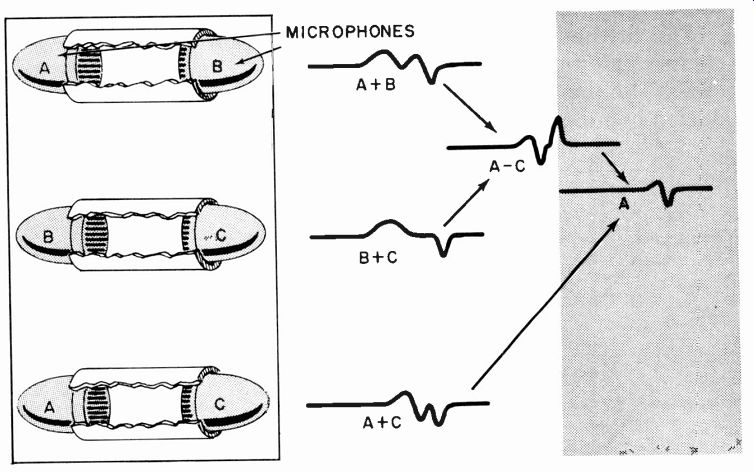
Fig. 1006. Deducing the response of one microphone, when none of the three
are identical.
Because microphones are such delicate instruments, it is almost impossible to produce two units, however carefully constructed, having identical performance. Slight internal stresses in the diaphragm structure, that do not make any noticeable difference in its dimensions, can result in variation in frequency characteristic.
If all three transducers have different characteristics, the results of any one can be computed by comparison of the three (Fig. 1006). But this becomes quite an "interpretation" problem and offers considerable opportunity for inaccuracy.
The reciprocity, either with identical or different units, can also be used in free instead of enclosed space. The requirements for validity are that distances be such that the units do-not interact on the sound field at any frequency. For this to be true at lower frequencies, the spacing is such that it is impossible to operate a microphone as a "speaker" sufficiently above ambient noise to make measurements. The only method is to use a speaker, a speaker that will double as a microphone, and the microphone to be calibrated (Fig. 1007), obtaining the resultant response of the desired unit from the three actual responses taken.
A method has been suggested for overcoming this identity or interpretation problem by employing the same microphone as a transmitting transducer and a receiving transducer or pickup by using the radar pulse technique. A very short burst of tone of a particular frequency is transmitted to a reflecting surface (Fig. 1008) which sends this pulse back. By the time it reaches the microphone it is connected to the input of the amplifier which measures the sound magnitude picked up.
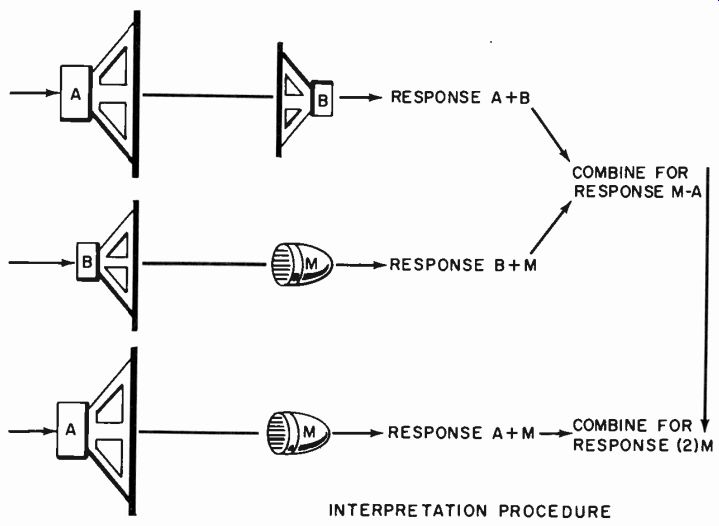
Fig. 1007. Reciprocal method (with access to air) using a speaker, a reversible
unit and a microphone to determine the microphone response.
This method depends on complete reflection of the sound-pulse energy and no loss due to diffraction. It is no longer one that checks the total energy input and output as when the test is con ducted in a totally enclosed chamber of such small dimensions that no sound escapes. A considerable distance must be provided for an appreciable number of cycles of the lower frequencies to be radiated and time to be given for the change of connections so that they can first be radiated and then picked up by the same micro phone.
To the author's knowledge this method has only been postulated but not actually used. It would seem that the obstacles in the way of ascertaining precise characteristics, reflecting surfaces, etc., would make the method at least as difficult as the straightforward reciprocity method using two identical microphones.
These techniques are applicable to pressure type microphones.
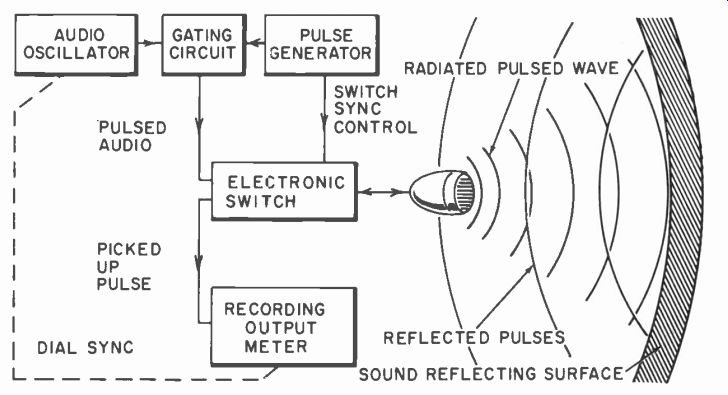
Fig. 1008. A projected method of using a microphone as a two-way trans mission
unit to get a reciprocity calibration.
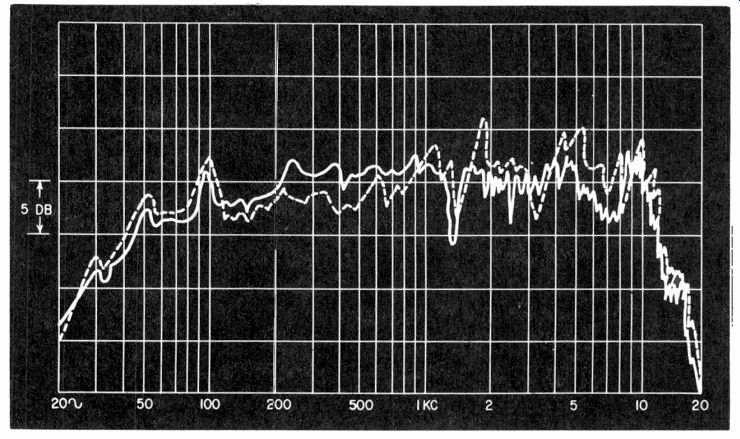
Fig. 1009. Comparing the response of a calibrated microphone (dashed line)
with one under test (solid line) gives the response of the latter.
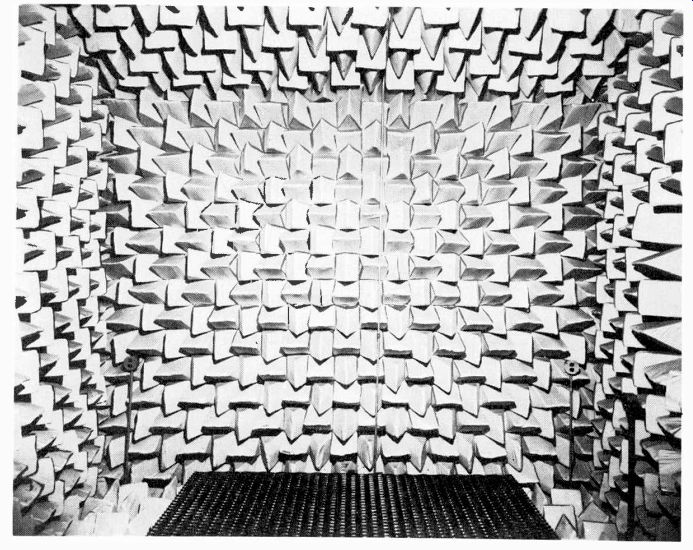
Fig. 1010. Anechoic chamber used for testing purposes. (Courtesy Electro
Voice, Inc.)
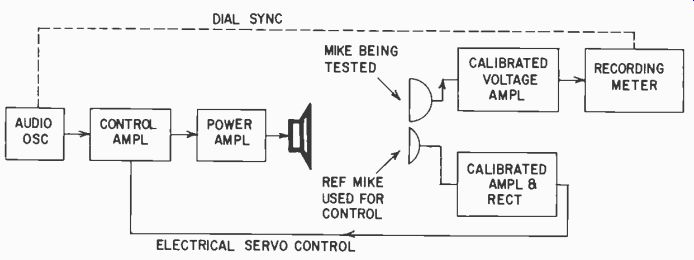
Fig. 1011. Complete setup for taking microphone response automatically,
using a control microphone to produce a uniform sound field.
Any types that utilize the velocity principle in whole or in part are not amenable to test methods based on pressure measurement.
A free-moving diaphragm, in which motion of air is permitted round its edges, may have a reciprocity arrangement, but it is not so simple as with devices that are influenced only by sound pressures.
The only satisfactory absolute technique for these is to use a comparator method with the Rayleigh disc (Fig. 1003) and make responses at different angles, or else take polar responses at different frequencies. Relative methods (sometimes called secondary methods and dealt with later in the section ) are more commonly used for this purpose.
All the methods so far described aim at producing absolute standards of microphone frequency response and sensitivity. In most instances, such absolute results are not necessary. If a reason ably good calibrated microphone can be produced by this method with a known and stable calibration, a much quicker method of taking the response of each of these varieties is to use the calibrated microphone as a standard. This can always be recalibrated by one of the foregoing methods from time to time just to check its performance.
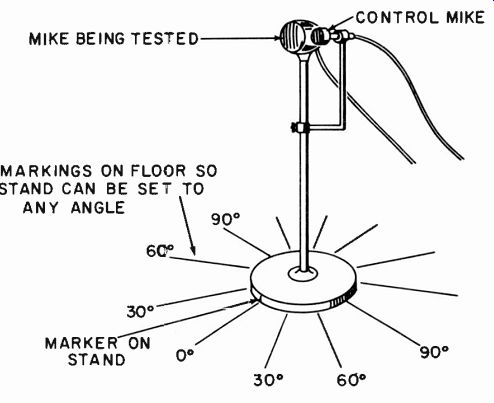
Fig. 1012. Arrangement of the mount for the two microphones in the setup
of Fig. 1011.
Then the method of making a test consists of comparing the performance of any other microphone with that of the "standard." Here we have two possibilities. One is to produce a sound field that fluctuates, however it may, due to the radiation pattern of the speaker used to produce it, and compare the pickup of this sound field at the same point by the standard microphone and by the one under test (Fig. 1009). By careful subtraction of the characteristics due to the speaker and to the calibrated microphone (which will be shown by the combination of the responses produced with the calibrated microphone and its own calibration, respectively), we can deduce the resultant response of the microphone under test.
This is a laborious process and reasonably valid only when the test is conducted in free space so there are no reflections. An alternative is to use an anechoic room (Fig. 1010), but the slight reflection from the acoustically "soft" surfaces of an anechoic room can invalidate the responses obtained unless some means is used to standardize pressure.
A controlled sound field is a big help in eliminating errors due to fluctuation in the radiation from the speaker and residual reflections in a good test room, leaving only corrections for the calibration of the standard microphone. To do this a number of calibrated amplifiers are needed (Fig.1011).
The oscillator is fed to the speaker through a control amplifier which varies the gain so that the output from the speaker can be adjusted to a desired sound pressure. The calibrated control microphone is connected to an amplifier whose output is rectified and used to govern the output from the speaker. In this way, as frequency is varied, the sound pressure at the control microphone is adjusted to what would be a constant value if the control micro phone were perfectly flat. Now, by placing the microphone under test in the same sound field, as close as possible to the control microphone, we can take a frequency response which will show directly the difference between the response of the control micro phone and the one under test.
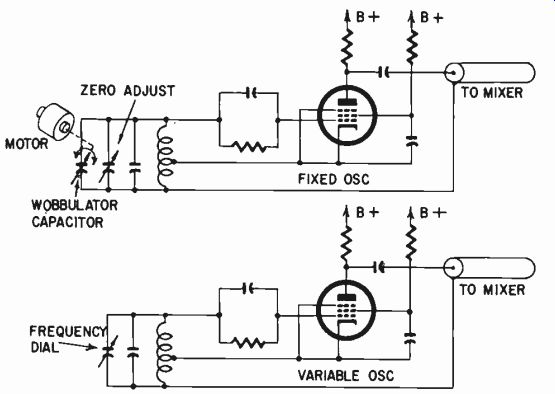
Fig. 1013. Electronic method of adding a warble tone to a heterodyne-type
audio oscillator.
If the control microphone is a good approximation to flat, then the response may be regarded as coming close to being an accurate frequency response of this particular microphone, taken in the direction in which it is oriented. A complete directionality pattern can be obtained by setting the microphone at different angles and using the control microphone in each case (Fig. 1012). If more accurate response is required, correction can be made for the calibration of the control microphone.
Even using this method, it is best to take the response either in the open air with no reflections occurring or in an anechoic room which will minimize reflections. In the average room, where wall reflections occur all around, the pressure gradients can be so strong in some standing waves, which may take up angles at all directions to the initial propagation from the speaker, that the pressure at the control microphone can be quite different from that at the microphone under test, and this difference will vary widely as frequency is changed. The resultant frequency response will look erratic. The same response in open air is much smoother; in an anechoic chamber the result comes somewhere in between.
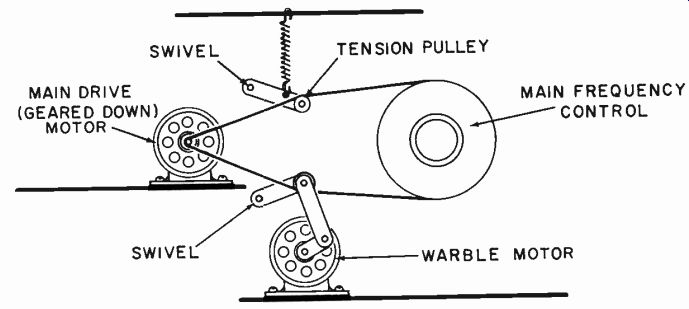
Fig. 1014. The mechanical method of providing a warble tone.
Sometimes it isn't practical to use an anechoic chamber or open air. An alternative is a warble tone. The frequency is continuously varied up and down by a small amount, and the frequency range is run up to plot the curve. In this way no standing-wave pattern has time to grow and produce troublesome pressure gradients.
Two kinds of warble can be added. If the oscillator is a heterodyne type, a simple method is to use a fluctuating capacitance in parallel with the control capacitance for the fixed oscillator.
This will make the fixed oscillator warble up and down by per haps ±10 cycles, while the variable oscillator goes up and down to change the overall frequency (Fig. 1013). The disadvantage is that ±10 cycles may not be sufficient to prevent standing waves in the region of 5 to 10 kc while at the low-frequency end a warble of ±10 cycles means that the 20-cycle tone is fluctuating periodically between 10 and 30 cycles. Thus the low-frequency becomes rather invalidated by the presence of the warble. What would be more nearly ideal is a warble of fixed percentage of the frequency at the moment.
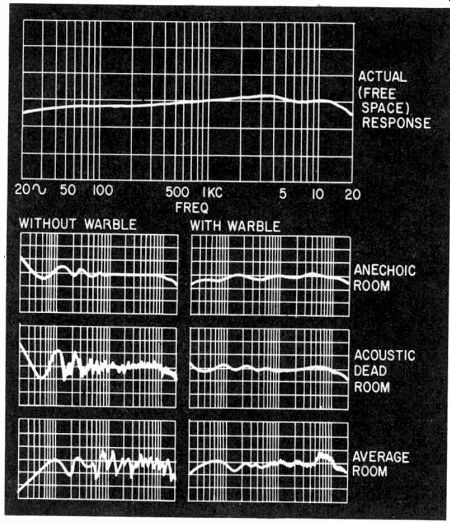
Fig. 1015. Comparison of the responses obtained in various test rooms, with
and without warble.
The only sensible way to approach this requires a mechanical drive that will vibrate the frequency control knob a fixed proportion of its momentary position. If the scale is logarithmic, a fixed angle will achieve this and make the problem simple. A belt drive could be used with a jockey pulley between the drive pulley and the control knob to impose a fluctuating movement in addition to the slow steady increase in frequency (Fig. 1014).
This means that a fluctuation in frequency will be a constant percentage of the frequency at the moment. If the fluctuation is 50 cycles when the frequency is 2 kc, it will be 0.5 cycle when the frequency is 20 cycles, and 500 when the frequency gets up to 20 kc. This is a fairly satisfactory arrangement for minimizing the effect of standing waves. The actual amount and desirable rate of warble will depend upon the reverberation time and similar characteristics of the room in which the measurement is made.
In an anechoic room, a very small amount of warble is sufficient to produce results that compare almost exactly with measurements taken without warble in the open air. A larger amount of warble will be necessary to achieve comparable results in a room with less effective absorption. Fig. 1015 shows some typical effects.
An important feature in making all of these measurements is the method of setting up the gear; it can invalidate the sound pres sure being measured. Hence the control microphone should be as small as possible and it should definitely be smaller than the one being tested.
If two microphones are placed side by side so their total volume is twice that of one microphone, then pressure-doubling effects due to the fact that the microphone presents an obstacle to the wave will start at half the frequency at which they would occur with one microphone standing by itself (Fig. 1016). This means that both the response of the control microphone and of the one under test are invalidated.
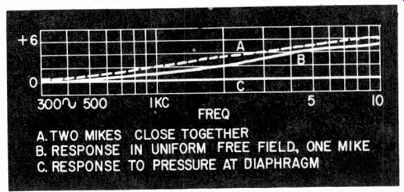
Fig. 1016. Proximity of micro phones to one another influences the pressure/velocity
relationship in a certain frequency range so as to modify the response obtained
slightly.
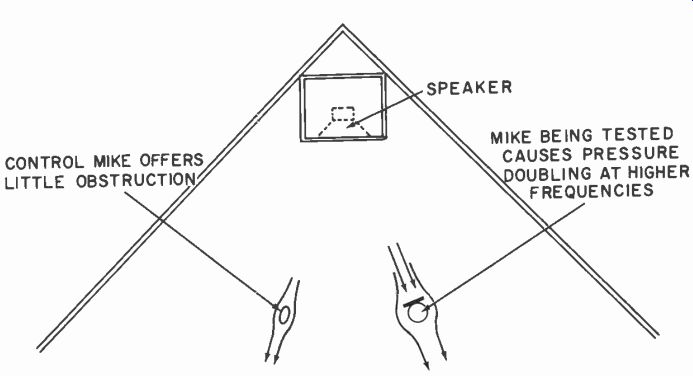
Fig. 1017. Symmetrical placement of microphones with respect to the speaker
and room geometry gives each freedom from displacement effect due to the
other.
Assume the control microphone is very small compared to the one under test. Placing the two close together does not give what may be regarded as an ideal result from all viewpoints. The control microphone will now determine that the pressure at the point where it is placed is maintained constant at all frequencies. But the microphone under test, acting in a free field, may tend to in crease the pressure at its surface due to its obstacle effect. The control microphone will make at least partial adjustment for this increase and maintain a constant pressure at the surface of the microphone.
This appears to be an argument for separating the microphones so there is no interaction in the wave where it strikes both micro phones simultaneously. By careful arrangement in symmetry it may be possible to insure that the free-field pressure passing both microphones is the same. The response now obtained will correctly show any pressure-doubling effect due to the obstacle effect of the microphone under test, because the control microphone, being much smaller, will avoid pressure-doubling at its own surface (Fig. 1017).
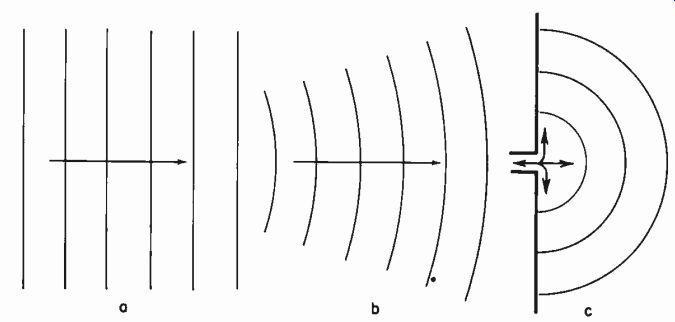
Fig. 1018. Difference in properties of sound waves due to wave configuration:
(a) uniform relationship in a plane wave; (b) similar relation ship in spherical
wave at large radius; (c) excessive air movement at source, or small radii,
of spherical wave.

Fig. 1019. Difference in response should be investigated due to the variation
in distance from sound source (a) and (b), and to the microphones awn interference
with the sound field (c) and (d).
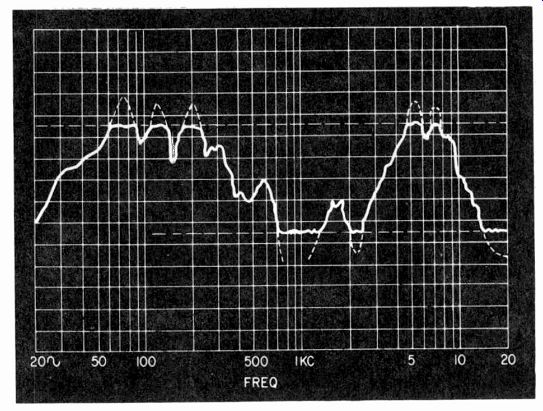
Fig. 1020. When a response levels off above and/or be low a certain level,
as shown here, results may be in validated by overload or ambient noise effects.
If both microphones are pressure types, problems due to wave configuration are simplified. Each responds only to the pressure fluctuations at its surface and the only way the microphone itself can affect pressure fluctuation is due to its obstacle effect.
A microphone is a purely pressure-operated device if only one side of the diaphragm has access to the sound wave. In many microphones, partly for release or partly to achieve some other effects, some access is provided from the rear of the diaphragm to the space where the sound is, as well as from the front. In some instances, the design is deliberately arranged to produce a cardioid or similar characteristic. The microphone is then no longer a pres sure device but works on the basis of a pressure gradient-the difference in pressure between the wave at the points where access is to the diaphragm.
Microphones of this type show marked differences in response according to the distance of the microphone from the source of sound. Sound waves near their source are spherical (that is, rap idly expanding) while sound waves at a distance approximate plane waves. This means the pressure and velocity characteristics of the wave progress forward without changing their relationship appreciably, at least over the distance represented by the dimensions of the' microphone.
Near a sound source the relationship between pressure and velocity is quite different from that when the wave becomes almost a plane wave. The air near the sound source actually works as a communicating medium with air farther out. Consequently it moves over a greater distance for corresponding pressure fluctuation than does air in a plane wave (Fig. 1018). All of this can be evaluated from basic sound theory, using the wave propagation formula, at least for the simple case when no obstacles are present.
The whole thing is somewhat more complicated by the presence of a microphone to measure these waves. So, in making measurements of this type we have to consider whether the method of test invalidates the results. By taking measurements at different distances and comparing the results both at different distances and at different angles, it is possible to measure just what is the performance of the microphone in various separate respects: what effect distance to the sound source from the microphone will have on its performance, what its response is to the sound field, and the way its presence "obstructs" or modifies the free-field configuration (Fig. 1019).
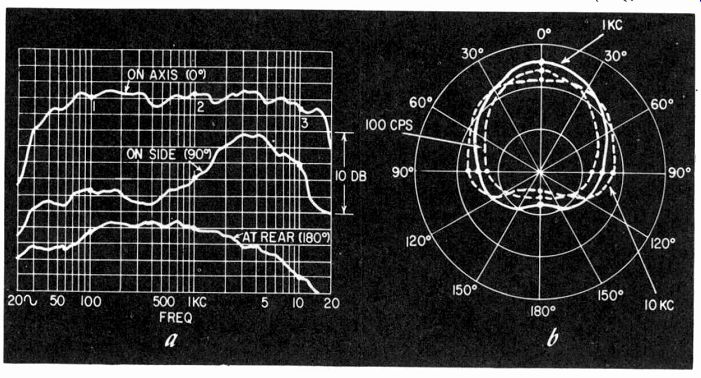
Fig. 1021. The directivity of microphones may be presented as a response
curve taken at different angles (a), or a polar diagram taken at different
frequencies (b).
Any of these microphones, partially velocity-sensitive, do exhibit differences in frequency response according to their distance from the sound source because, at the low-frequency end particularly, there is a velocity rise (compared to the pressure response) when the measurement is made closer to the source of sound (Fig. 1018).
In all these measurements, it is important to check that the indicated results are valid throughout the frequency range and that ambient noise does not swamp low-level points, or distortion limit peaks (Fig. 1020).
Directional properties of the microphone can be taken in one of two ways. The setup is quite similar for each. It is a matter of taking the readings in accordance with the method of presenting the information intended. It can be presented as a frequency response taken at different angles, on axis, and at 30°, 60° and 90°, for example; or else the directional polar pattern can be taken at a variety of frequencies. These two methods are shown in Fig. 1021.
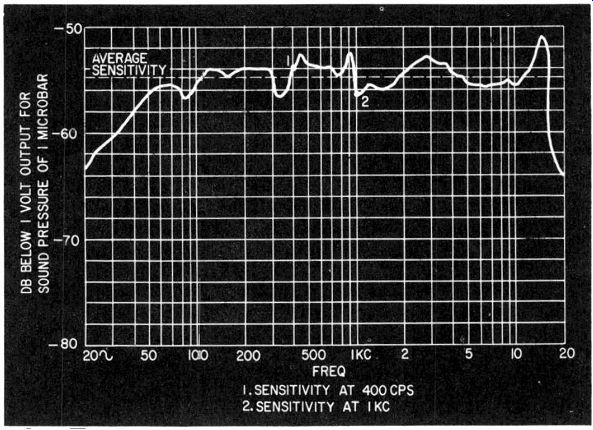
Fig. 1022. Possible ambiguity about a sensitivity figure taken at a specific
frequency; an average figure is more informative.
The method of plotting is in accordance with the way the information is presented. If the polar method is used, then the frequency is kept constant and the microphone rotated, measuring the output at different angles. If the frequency response at different angles is used, the microphone is set to precisely measured angles and frequency response is taken in each position.
For measuring microphone sensitivity, it is necessary to calibrate the sound field. The standard microphone, which has been calibrated against a known sound field, must be used with a carefully measured quantitative gain. This means that the output of the microphone in microvolts or millivolts must be precisely measured by the amplifier that is used on its output, to set up the gain so that a known sound pressure will produce a specific voltage reading at the output. In this way the sensitivity of the unknown micro phone can be determined against the reference standard.
Sensitivity is not a constant figure in making these measurements. It will vary according to the frequency response of both instruments. Consequently, a sensitivity measurement should be made at some frequency, such as 400 or 1,000 cycles. The figure obtained will vary in significance slightly, according to whether this happens to be at a maximum or minimum point in the frequency characteristic of each microphone.
Whether it is a sound cell crystal, a ribbon or a flat diaphragm capacitor type, a reference microphone will have practically no peaks or valleys in this region and thus will not bias the sensitivity reading. But the microphone under test may well have either a peak or dip at the measurement frequency that makes the reading not representative of the response in this general frequency range.
For this reason it is well to assess the average sensitivity by comparing the sensitivity at a known frequency with the measured frequency response (Fig. 1022). Such an average sensitivity reading is an interpolation and not something that can be measured at any particular frequency.
Transient response
To date, no known means exists for establishing the precise waveform of an acoustic wave of transient form. Even the best speaker has such considerable transient distortion, compared to a reasonably good microphone (because of the relative dimensions involved) that it is impossible to generate a transient acoustic wave of precisely determined form.
Comparative measurements could be made between micro phones, using a speaker or some other source of transient sound of indeterminate form, but such measurement is limited in validity by the inability of determining the acoustic waveform. Fortunately, as microphones are invariably small in dimension compared to the sound wavelengths they pick up, the kind of transient distortion that occurs in speakers due to breakup can be virtually eliminated, at least from the best units. Thus the transient response can be predicted within fairly good limits.
Phase response
Phase response is unimportant for most applications. Correct phasing may be necessary where several microphones cover the same general area. But, because of the physically small dimensions of good microphones, phase deviation is always fractional. How ever, in design work such as for developing cardioid microphones using multiple elements, relatively small phase deviations can be important. For this purpose, comparative phase measurements can be made by the method of Fig. 1023. Positioning is adjusted until the outputs are precisely in phase. The phase difference, and thus the wavelength, is then computed from a knowledge of the frequency of test.
Impedance
Microphone impedance can be measured by any of the standard methods, provided the signal used does not drive the diaphragm physically to such an extent as to cause acoustic reflection into the electrical circuit.
Any transducer reflection that occurs normally appears as part of the equivalent electrical impedance of the microphone. But, as microphones are much less efficient transducers than speakers, (because of the much smaller size necessary to achieve the desired frequency response), there is much less reflection from the acoustic impedance to the electrical circuit than occurs with speakers. Most microphones have an electrical impedance governed principally by the electrical characteristic of the microphone. In moving-coil and reluctance types, this is due to the resistance of the coil or windings and the inductance due to the magnetic components in the instruments. In crystal or capacitor microphones, the impedance is almost a pure capacitance and any resistance components are usually due to losses in the capacitance as an electrical device rather than acoustic reflections.
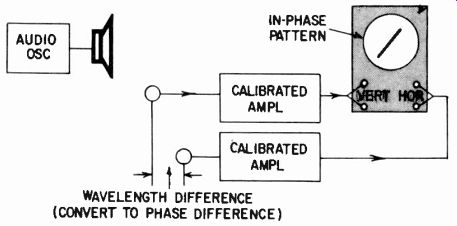
Fig. 1023. Method of measuring the phase response of microphones (relative).
With some microphones, such as the capacitor type, a preamplifier is necessary. Recently also dynamic microphones have been built with an incorporated transistor preamplifier. With these, it may be necessary to take the overall response including the characteristics of the associated amplifier. In this case, the direct impedance of the microphone itself is unimportant except in considering its possible contribution to the overall performance.
Impedance can be read, at any one frequency, by a bridge or by a direct-reading impedance meter, taking care not only to apply sufficient audio to the microphone to cause excessive diaphragm movement. The direct-reading impedance meter is convenient only for making an impedance check at the one frequency for which it is designed. More complete information requires the use of a bridge or else a simplified setup (Fig. 1024) and taking readings at a number of frequencies, so an impedance, magnitude and phase angle response can be plotted (Fig. 1025).
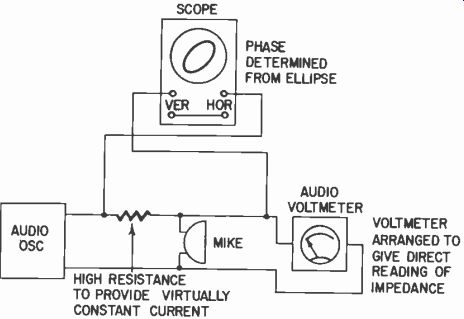
Fig. 1024. A simple setup for measuring the impedance characteristic of
a microphone.
From such information, if desired, the equivalent circuit can be deduced (Fig. 1026) and the elements identified. This can then be useful as a design adjunct. It can aid in predicting the electrical frequency response with various terminations-a more precise approach than repetitive acoustic response measurement with different terminations.
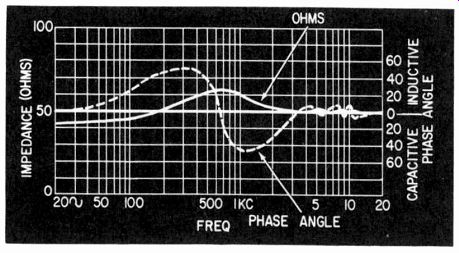
Fig. 1025. A typical impedance characteristic, plotted in ohms and phase
angle.
Distortion and noise
Distortion should always be measured in conjunction with the distortion of the amplifier used in making the test. Most micro phones produce very little distortion unless excessive sound levels are used-much greater than normally encountered unless the microphone is used in conjunction with a sound-level meter or as part of a vibration test or pickup device.
First check the amplifier with a simulated electrical input, then with an acoustic input through the microphone. This will need a high-quality speaker, whose distortion, measured on a calibrated microphone, is lower than the indication obtained on the one under test (Fig. 1027).
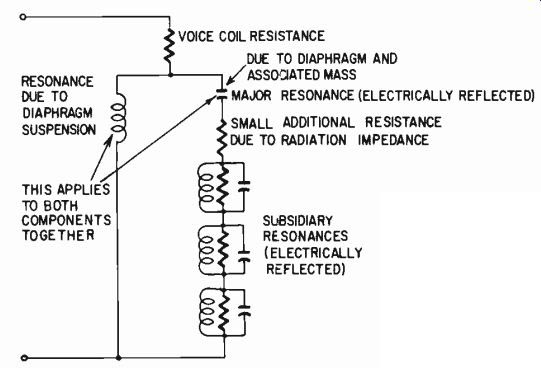
Fig. 1026. Equivalent circuit that can be deduced from the response of Fig. 1025 not to be confused with the mechanical or acoustical analogy for the
microphone, itself, in which mass is usually inductance and compliance is
capacitance, instead of vice versa, as here; this is the electrical impedance
equivalent.

Fig. 1027. A possible method for measuring microphone distortion: all other
components must be of extremely high quality for this measurement.
Also, it is necessary to check the noise level from the microphone. This requires the use of an anechoic chamber or isolated room which permits putting the microphone where there is absolutely no sound pickup, or where the sound pickup is of lower level than the noise level from the microphone itself. This can best be checked by listening to the output to determine that it is pure noise and that there is no break-through sound of an ambient nature. It is also necessary to check that the noise level of the amplifier, when terminated by an impedance corresponding to the microphone impedance, is not of sufficient magnitude to swamp the noise level measured from the microphone. Microphone noise measurement is valid only if the amplifier noise measures much lower--at least 10 db.
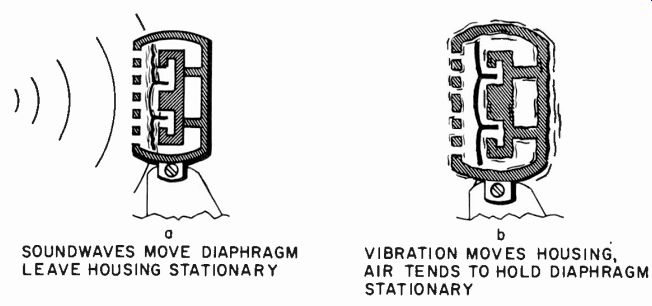
Fig. 1028. The difference in action between picking up a sound wave (a)
and a vibration from the mount (b).
Measurements of the maximum level the microphone can handle in conjunction with its minimum level which is just above the noise will enable a dynamic range figure to be given. Of course, not all of this is always practical dynamic range, because the higher levels may be much greater intensity of sound than can be used for practical purposes-except maybe for listening to the intensity of noise in a boiler factory! The more useful figure is an equivalent noise level in terms of the acoustic pickup intensity. In other words, the output noise level from the microphone is referred to an equivalent sound level, according to the sensitivity of the microphone.
Vibration isolation
A final important feature of microphones is their isolation of various forms of vibration not sound borne to the diaphragm and transmitted either through the microphone stand or the connecting cable.
Most microphones will have a different frequency response to vibrational than to acoustic sound pickup. This is because the function of the instrument is reversed (Fig. 1028). Vibration of the microphone housing tends to leave the diaphragm standing still. But this reverse action is controlled by the acoustic impedances reflecting to the diaphragm, some of which are coupled to the vibrating element and some of which may not be. The result is a completely different frequency characteristic from that using the microphone in its correct sense.
To find this frequency characteristic without any vibration isolation put the microphone in a stand and use a vibration generator. This is a special kind of transducer similar to a speaker coupled to produce mechanical vibration. At the same time use a vibration pickup, which is similar to a microphone (but in tended for contact pickup) to measure the vibration produced (Fig. 1029). Use the vibration generator as a calibrated source similar to the control microphone in taking microphone frequency response. Measure the output from the microphone insuring that none of the pickup is due to acoustic effects, by operating in an anechoic chamber. Then measure the output at different frequencies to obtain the frequency response of the vibration pickup of the microphone itself. This will naturally differ between various units.
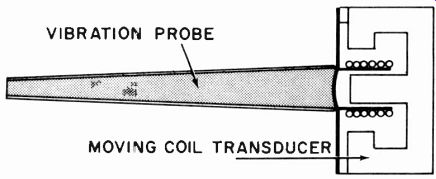
Fig. 1029. Basic construction of a vibration pickup.
Appropriate vibration-isolating units can be inserted in the microphone stand and the response repeated. The effectiveness of vibration isolation is the difference between these responses. The question as to whether the overall vibration pickup response, including the isolation or the actual reduction produced by the isolation, is of importance is one that has to be settled by looking at the individual responses concerned. If a particular microphone proves particularly susceptible to one frequency, which quite frequently happens due to the mechanical construction of the micro phone or its housing, then it is important that the isolation should give good rejection to this frequency.
Effect of housing
Many microphone responses published by manufacturers appear to have been taken with the development unit produced in the laboratory before the styling people designed the housing for it.
Unfortunately, as the manufacturers of better microphones know quite well, housing can considerably modify frequency response, both acoustic and vibration pickup. So if you take the response of a microphone and find that it does not agree with the published curve, check whether the microphone without housing agrees with the published curve.
Microphones are one component that cannot, after satisfactory laboratory development, be "handed over" to styling people for "packaging." Close collaboration with the development laboratory, taking careful measurements, is necessary right up to the evolution of the final product, if the benefit of original development is to be retained.
Recommended Reading
1. Frederick V. Hunt, Electroacoustics, Harvard University Press, 1954.
2. Leo L. Beranek, Acoustics, Mc-Graw Hill Book Co., Inc., 1954.
3. Harry F. Olson, Acoustical Engineering, D. Van Nostrand Co., Inc., 1957.
4. J. W. S. (Lord) Rayleigh, The Theory of Sound, Macmillan Co. (London) 1877, reprinted by Dover Publications, Inc., 1945.