BEFORE we can make any measurements we have to establish the quantities by which we measure the performance of the individual items of equipment. Because the modern concept of audio takes in much more than just equipment for the reproduction of a sound program we need to lay the ground work for measurement in a wide variety of applications.
In high-fidelity work exact frequency is not usually important because the equipment must respond uniformly, or as near uniformly as possible, over a very wide band of frequencies, from 20 to 20,000 cycles or from 40 to 10,000 cycles, etc. It is relatively unimportant whether the exact measurement frequency is 20 or 20.1 cycles--the equipment is not likely to behave radically different with such a small relative change in frequency.
On the other hand, sometimes we need to know the frequency with great precision. Perhaps we are concerned with providing equipment for a musicologist, who needs to know the pitch of a musical tone within 1 cent. As 1 cent in musical terminology is 1/1,200 of an octave, it represents a frequency change of only .058%; this would be the difference, for example, between 100 cycles and 100.058 cycles. Identification of frequency with this precision requires more careful measuring methods than those generally used for measuring the frequency response of high fidelity equipment.
Whatever we are measuring, whether it is frequency, voltage, current, resistance, impedance or acoustic quantities, such as velocity and pressure, the degree of accuracy required in the measurement method depends to a considerable extent on the application of the equipment. Most often however, the accuracy of frequency measurement never needs to be as close as one part in a million.
Frequency
Frequency is basically a measure of time. So measurement of frequency is dependent upon accurate establishment of a standard interval of time, which, for audio purposes is 1 second. The establishment of the time standard is conducted at observatories such as Washington and Greenwich. Standard frequencies determined at these observation posts serve as world-wide reference. WWV broadcasts standard frequencies of 440 and 600 cycles, as well as the actual carrier frequencies on which these modulated tones are imposed. An accuracy in the region of one part in one hundred million is maintained. A plot of the standard time radiated by WWV shows that the maximum error over a whole year reaches, at one point, almost 1/8 second. For the great majority of the time the accuracy holds within 1/50 second.
These very high accuracy standards can be used to calibrate standards for making measurements. For close accuracy work a tuning-fork oscillator will provide a stable signal in the region of one part in a million. Use of checks against WWV can determine just how far the signal deviates. Oscillators using quartz crystals, precision cut in one of a variety of manners, can afford a greater accuracy than this, achieving results comparable with the radiation of WWV.
The latest step forward toward standardization of frequency utilizes the molecular resonances of certain gases, such as ammonia and cesium. These are operated in conjunction with a klystron oscillator to synchronize its frequency. It is expected that such devices will reach long-term stability in the order of one part in a trillion.
For most audio work the standard of time measurement can be taken from the line supply, nominally 60 cycles in most American and 50 in most European countries. To a person used to operating in the order of accuracy afforded by WWV or a crystal oscillator this may seem an extremely erratic frequency standard. But most power lines are used as a basis for timing electric clocks and any self-respecting electric light and power company maintains the accuracy of frequency such that clocks relying on it will always tell correct time within 15 seconds.
The disadvantage of this method of standardization is that a sudden increase or decrease in the load on a power station is likely to slow down or speed up the generators and automatic or manual control has to be applied to maintain the correct speed and frequency. A sudden load, or removal of load, can produce a temporary deviation in frequency much larger than that used for corrective measures to bring "time" back to its correct position.
Thus, a sudden increase in load may momentarily drop the frequency from 60 to 59.5 cycles, or a sudden removal of load may raise it to 60.5 cycles. The corrective measures bring the frequency back close to 60 cycles after only a minute or two, but meanwhile the change in frequency may have put the timing of the clock several seconds off. So now the control has to bring the clock back to correct time over a longer period so as to achieve greater stability in frequency. When the frequency is held steady, its accuracy is usually within about 0.1%. But for short periods the frequency can vary as much as 1%.
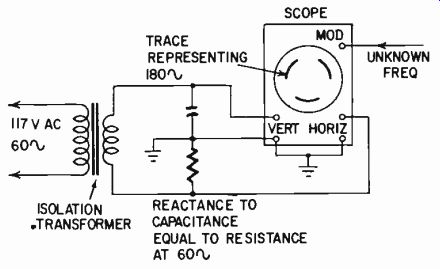
Fig. 301. Use of circular time base to produce the spot-wheel pattern for
frequency comparison.
This can be quite disconcerting in making accurate frequency comparison, but if you operate during a period when the frequency is more stable, the result will probably be within 0.1%, which is closer than most of oscillators are calibrated.
Instrument calibration
An oscillator or other variable frequency device can be calibrated by a variety of means according to individual preference.
Some prefer the wheel method on the oscilloscope. Using the 60-cycle standard as a reference, it makes the spot travel in a circle by applying 90° phase-shifted voltages to the vertical and horizontal plates (Fig. 301).
The unknown frequency is then fed into the modulation grid (Z-axis input) of the tube and causes the circular trace to vary in intensity at the frequency to be measured. If the frequency being measured is a multiple of 60 cycles, it will produce a proportionate pattern of light and dark variations around the circle. This makes the method convenient for measuring 120, 180, 240, 300 and further multiples of 60 cycles to a fair degree of precision. If the pattern of light and dark markings around the circle seems to rotate, the frequency is slightly above or below the multiple in question. The rate of rotation can be used to approximate just how much the frequency deviates from the exact multiple-the faster it is the greater the deviation.
An alternative method applies the unknown frequency to a sensitivity-modifying circuit in the scope, producing the cog-wheel patterns of Fig. 302.
The use of Lissajous patterns has the advantage that definite fractional relationships can be more easily observed than with the "wheel" method. Fig. 303 shows a whole family of Lissajous patterns for calibrating an oscillator using 60 or 1,000 cycles alternatively as the standard reference frequency. If 60 cycles is used as the basic reference-it is certainly the cheapest-then it is a good plan to set up a secondary standard of 1,000 cycles, which can be checked by using as an intermediate either 200 or 300 cycles.
Check the variable oscillator first with the 60-cycle patterns and then adjust the secondary standard against this setting for the 1,000-cycle pattern, using the sequence shown in Fig. 304.
In Fig. 303 the patterns identified by numbers in large type are intended for use in calibrating an audio oscillator. The patterns identified in smaller characters are merely to aid in distinguishing between the ones desired, indicated in the bold characters.
From a musical standpoint quite an interesting and useful alter native to the scope and Lissajous patterns is the Conn strobe frequency indicator (Fig. 305). This uses a synchronous motor driven from a tuning-fork controlled frequency. The fork frequency can be adjusted over a range of ±3.5% from the standard of 60 cycles by a sliding-weight arrangement. This control is so precise that the exact frequency can be read to within 1 cent.
The synchronous motor drives, through a sequence of gears, 12 stroboscopic discs. Each disc has a pattern of black and white segments that provide for identification of octavally related frequencies over the entire audio band. The 12 rotating discs, arranged in positions similar to the black and white keys of a key board instrument, identify each tone in the octave and in which octave a particular tone falls.
The tone is provided by illuminating a neon lamp with the amplified frequency being investigated. The exact pitch of the tone is determined by adjusting the tuning fork until the particular scope pattern appears to stand perfectly stationary. Its exact pitch relative to the standard can be then measured in cents, within a range of ±50 from standard pitch. Thus, the instrument has an accuracy comparable with the Lissajous pattern method.
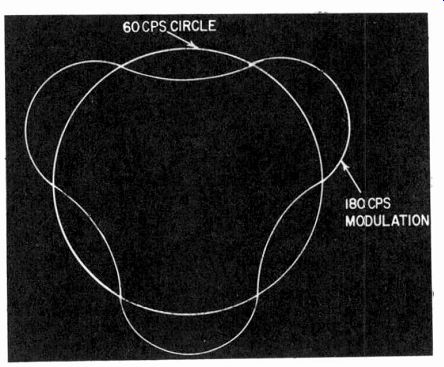
Fig. 302. Another method produces the cog-wheel pattern shown here.
Voltage and current
Standards of voltage and current were historically established in terms of direct voltage or current. Direct voltage is specified in terms of a standard cell, of which there are a variety, and the reader is referred to suitable texts which describe the standard voltage determined and its degree of accuracy.
Standard current is determined by electrolytic methods-how much copper or silver is deposited by an electrolytic process when a fixed current is passed for a standard period of time. These methods establish a standard-reference for direct voltage or current.
Alternating voltage or current, however, can be measured in terms of its peak value, its rectified average value, either half-wave or full-wave rectification, or its rms value. The only two references accepted as standard are the peak and rms values. Rms value is measured by a thermal instrument-one that deter mines the effective heating value over the period of the wave.
The old hot-wire ammeter (now obsolete) was such an instrument. This instrument was easily calibrated on direct current. It then gave a correct reading on alternating current, provided the frequency was not such as to allow the instrument to be bypassed partially by the self-capacitance of the system.
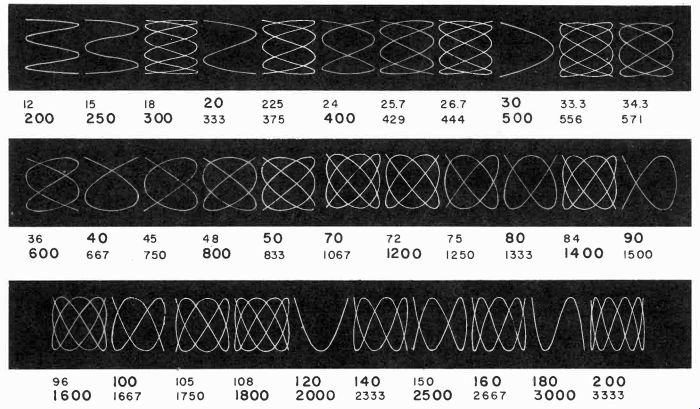
Fig. 303. Recognition patterns for using Lissajous figures for calibrating
an audio oscillator: the upper number under each figure indicates the frequency
displayed with 60 cps as a reference; the lower number is for 1,000 cps reference.
Numbers in large characters indicate the patterns useful for calibration points,
while the smaller numbers identify less important frequencies that may be used
in finding the calibration points.
For audio purposes, thermal instruments require too much current or are too elaborate. Using a vacuo-thermo junction, these methods have been applied, but currently preferred methods use a vtvm or a direct rectifier voltmeter. In either case rectifier action produces the reading with a moving-coil instrument calibrated on direct current.
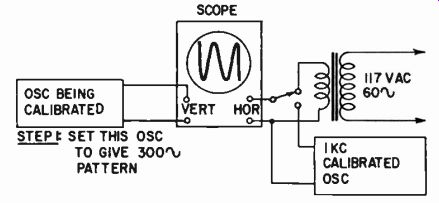
Fig. 304. Method used for get ting calibration of higher frequencies (above
1,000 cycles) from a 60-cycle line.
However, where a rectifier is used, it also needs calibration. If it behaved as a perfect rectifier, it could be calibrated simply from a theoretical basis. But a rectifier does not rectify perfectly: it provides a finite resistance path for the current in the forward direction and a very high resistance (but not infinite) to current in a reverse direction. This means the rectifier itself possesses a scalar characteristic.
With most instrument rectifiers, the reverse-current resistance is so high that only the very lowest part of the scale (at very small currents) is modified appreciably from the theoretical value (Fig. 306). But the forward-resistance characteristic makes the effective resistance of the instrument vary considerably with current reading. If a large multiplier resistance is used, the voltage scale is almost as linear as the current scale, but for low-voltage-full-scale readings, the scale is distorted (Fig. 307).
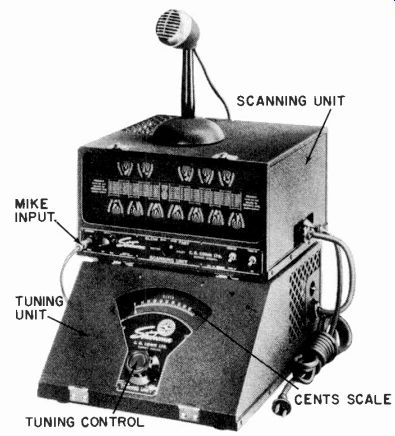
Fig. 305. The Stroboconn is a musicologist's frequency (or pitch) comparator
of great precision.

Fig. 306. Reverse resistance of rectifier invalidates the reading slightly,
as shown here, of alternating average current.
Fig. 307. Comparison between scales for higher and lower voltage readings, using a rectifier instrument.
Using, as an example, a 20 microampere-full-scale movement (50,000 ohms-per-volt) , the series multiplier needed to make the instrument read 10 volts full scale dc would be 10 X 50,000 = 500,000 ohms, less the movement resistance. Using a bridge rectifier, which is a full-wave rectifier, (Fig. 308-a) the theoretical value to give an rms reading on a sine wave (the way these instruments are calibrated) is calculated as follows:
The rms value of a sine wave is 0.707 times its peak value; the rectified value (in theory) is 0.637 times its peak value. The meter will take 0.637 times the peak value of a sine wave, but we want it to read 0.707 times the peak, or 0.707/0.637 = 1.11 times the current the movement actually passes. For a voltmeter, this is achieved by dividing the multiplier resistance by 1.11 (or multi-plying it by 0.9) so the actual current of 20 Na full scale is equivalent to 22.2 rms pa. So the theoretical multiplier resistance will be 0.9 x 500,000 = 450,000 ohms, less the resistance of the meter with its rectifier.
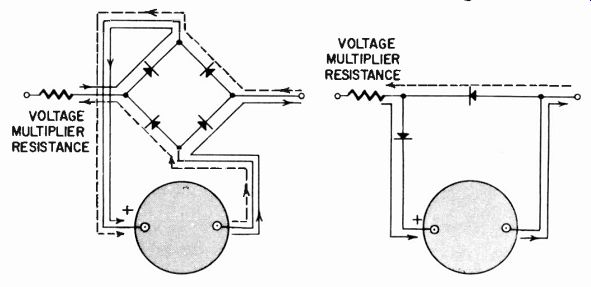
Fig. 308. Two commonly used rectifier circuits for ac measurements in audio:
(a) full bridge; (b) two-unit, half wave. The solid and dashed lines indicate
current paths for alternate half-waves of the ac cycle.
In practice, instrument rectifiers do not work very efficiently at only 20 pa full-scale. It is customary to shunt the dc movement to some higher value, usually so the same voltage multiplier can be used for ac. For example, the shunt may be arranged so the full-scale current is 180 pa (20 pa through the meter and 160 through the shunt). This would then be equivalent to a meter requiring 200 pa rms full scale. This is still a theoretical value, based on a rectifier efficiency of 100%. Some slight modification of the shunt is necessary in practice to compensate for deviation.
The other type of rectifier in ac instruments uses only two elements (Fig. 308-b). On a sine wave this halves the average current.
So to make an instrument with 200 pa rms full scale, the meter shunt needs to take a theoretical 70 pa, to bring the total average current up to 90 pa. In practice the current passed by the shunt is a little lower than this, because rectifier efficiency is not 100%.
At higher frequencies an instrument rectifier possesses effective self-capacitance that reduces the reading produced by a given alternating current. This is partly due to actual capacitance and partly to a "hysteresis" effect in rectification. It varies with rectified cur rent as well as frequency.
A useful instrument for measuring voltage is the cathode-ray oscilloscope. Some scopes can also be used to measure current with good precision, but the only completely satisfactory way of doing this is to use deflection coils instead of plates. Most modern scopes for measurement work employ plates for deflecting the spot in each direction.
By using direct connection to the plates, (provided for on most scopes), the deflection of the spot with the application of direct voltage is easy to see, and an alternating voltage of sinusoidal form can be applied to produce the same peak or peak-to-peak deflection. From the theoretical relationship between rms and peak or peak-to-peak voltages the scope can be calibrated, if desired, in terms of sinusoidal rms input.
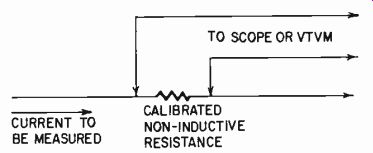
Fig. 309. Using a calibrated series resistance to measure alternating current
by voltage drop it produces.
By applying the voltages measured directly to the scope, there is no variation in response due to the scope amplifier. Although the capacitance of connecting leads can load the circuit to which the scope is connected, the voltage reading is always that actually present when the scope is connected. With any other type of instrument, or even when using the scope with its internal amplifier, one has to remember that the instrument itself may be inaccurate in its reading, either due to deviation from calibration or because of frequency response, in addition to the possibility of circuit loading.
Both ac and dc voltage measurements are relatively easy, using either a vtvm with a very high input resistance that will not appreciably load the circuit being measured, or by using a regular volt-ohm meter with a relatively high resistance-in modern instruments in the region of 20,000 to 100,000 ohms-per-volt. Current readings, however, are not so readily provided for.
Direct current can be read quite conveniently, using the instrument with its arrangement of shunts, but even this involves a small voltage drop that can interfere with the operation of the circuit being tested, invalidating the reading. For ac readings, the most satisfactory method is to insert a small resistance in the circuit and then measure the voltage drop across it, either with a scope or vtvm (Fig. 309). Either way, the voltage drop is something not normally present in the circuit until the resistance is inserted.
When using a resistor in this way, it is important, if the current reading is to be meaningful in absolute terms, to measure the resistance precisely. It is also important that the resistance be non-inductive, otherwise a rising current characteristic occurs during measurement at higher frequencies.
Phase
For high fidelity reproduction, relative phase angle is not important. But it can be in the design and development of feedback amplifiers and in audio applications not connected with high fidelity. The method used in measuring relative phase angle depends to some extent on the type of signal involved and the purpose of the measurement.
If both signals, the reference one and the one whose phase is to be compared with it, are sinusoidal, the scope can be arranged to give quantitative data from which the phase relationship can easily be calculated. If one signal is applied to the horizontal and the other to the vertical plates, either a line or an ellipse will appear. Adjusting the trace so its height is equal to its width, and both are some convenient dimension (which we will designate twice unity) the trigonometrical functions of the phase angle can be measured (Fig. 310) and the corresponding angle identified by the use of trig-tables.
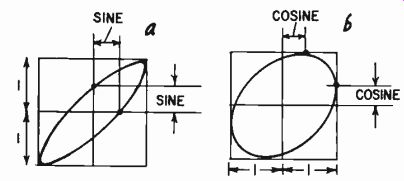
Fig. 310. Oscilloscope ellipses can be used to obtain quantitative measurement
of phase angle: (a) less than 45°; (b) between 45° and 90°.
Alternatively, the phase can be estimated (by comparing the trace observed with the ellipses shown in Fig. 303) to within about 10°. This also identifies the ellipses at points corresponding to measurements for sine (along the center lines) and cosine (along the edges).
With angles between 0° and 45° or the corresponding half of other quadrants, the sine is the most useful function. For angles between 45° and 90°, and the corresponding half of other quad rants, the cosine is more useful. Having read the appropriate function, the angle can be obtained from trig tables or a slide rule that gives trig functions. For angles close to 45°, particularly between 35° and 55°, it is well to cross-check by using both.
In using this method, particularly at low or high frequencies, it is important to check the phase accuracy of the scope. When the same input is applied to both sets of plates, the reading should show zero phase angle.
While this method is particularly useful where both waveforms are sinusoidal, it can be modified by a bridge technique for use where only one is sinusoidal.
Where neither waveform is sinusoidal, a different technique must be adopted. It is also important to define what is meant by phase angle, as ambiguities arise when the waves are complex.
Fig. 311 shows two possible reference points on a relatively simple waveform.
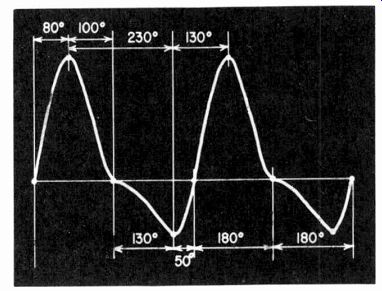
Fig. 311. This waveform illustrates the possible ambiguity of reference points
on a non-sinusoidal waveform, where the phase between mid-points and "tops" and "bottoms" is
no longer 90°. Here mid-points have been chosen to give 180° /180° spacing,
but the other spacings are altogether different.
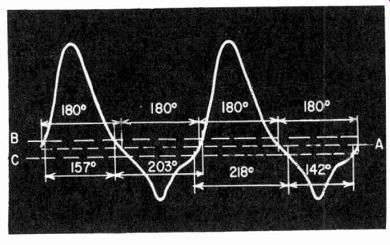
Fig. 312. How a mark-space ratio control works. The correct bias, which will
produce symmetrical square-wave output, is represented by dashed line A; incorrect
bias, which will make the square wave asymmetrical, as indicated by the angles
noted, is represented by dashed lines B and C, and will produce a correction
bias to bring operation back to A.
A range of phase meters has been marketed using automatic mark-space ratio control. This uses a limiter on each waveform, with a feedback that automatically adjusts limiter bias so the top of the resultant square wave has equal duration with the bottom.
The significance of this on a waveform is shown in Fig. 312.
A block schematic of such a phase meter is shown in Fig. 313.
Both input waveforms are passed through a limiter with automatic mark-space control, to produce a square wave. Its vertical lines are timed by the points on the input waveform that have the same instantaneous value 180° apart. These are then combined in a "product" type mixer, which gives a positive-going output only for the time when both inputs are positive-going. Thus, an integrating meter on the output will give a direct indication of how much of the total time for one cycle the two waves are positive-going together.
Such an instrument can be directly calibrated in phase, with a practically linear scale, and it will be independent of frequency over a wide range. The only limitation is whether the interpretation of phase on which the reading is based happens to be what you want.
Resistance and impedance
The established standard for resistance is in terms of a column of mercury of standard dimensions at a specified temperature. All resistances and impedances can be compared to it by means of various types of bridges.
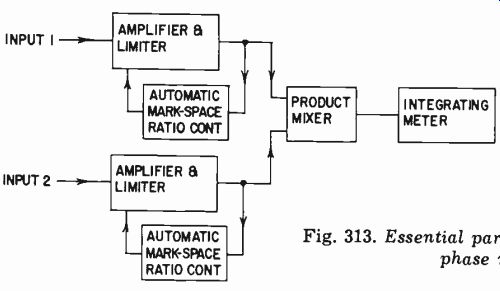
Fig. 313. Essential parts of a direct-reading phase meter.
Practical measurements of resistance and impedance are per formed with a variety of instruments. The most accurate method is always a calibrated bridge. For resistance checks this can be dc operated, but for all impedance measurements ac must be used and the frequency is important because impedance is never constant with frequency. Measurements of impedance are specified in a variety of terms.
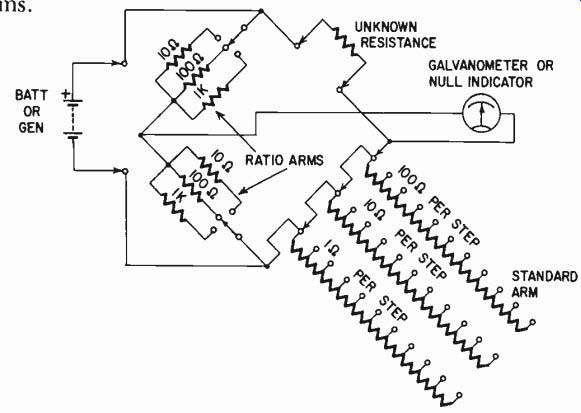
Fig. 314. Schematic of Wheatstone bridge used for de resistance measurements.
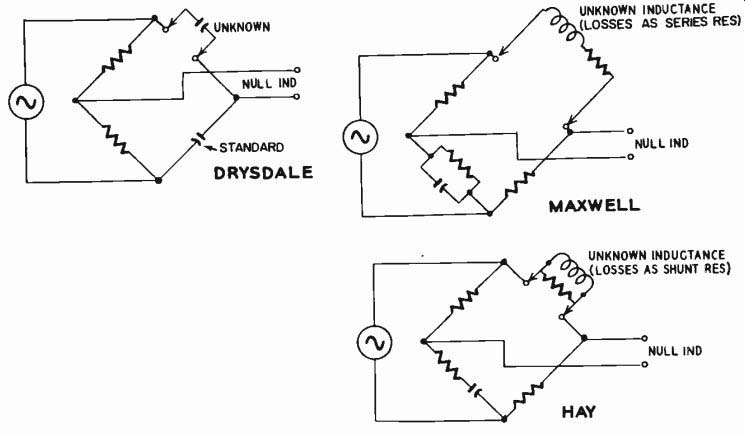
Fig. 315. The three commonly used ac bridges for the measurement of inductance
and capacitance.
They may be in terms of impedance value in ohms in conjunction with a phase angle, or this complex impedance may be broken down into resistive and reactive components at 90°. Sometimes it is desirable to specify the various reactive components in terms of their equivalent inductance or capacitance at the frequency in question. Some impedance bridges are designed to measure each of these quantities in their basic terms; others require conversion from the terms given to the terms desired.
The simple Wheatstone bridge for measuring resistance is shown in Fig. 314. It also appears in a variety of forms, such as the well-known Leeds-Northrup bridge, used in this country, or the-post office box" used in England. The common bridge uses ratio arms that pick out specific ratios between the standards resistors and the unknown, giving the instrument wide useful range. The resistors in the ratio arms bear relationships of multiples of 10, so the reading obtained is multiplied or divided by 1, 10, 100, or sometimes 1,000.
The standard arm is made so that resistance can be measured, usually to three significant places. It can take the form of decade dial switches or a plug system, the removal of any plug inserting the resistance designated on the panel.
For the ac measurement of different kinds of impedance, a variety of bridges are used. The most useful ones for audio measurements are the Drysdale bridge, for the measurement of capacitance, and the Maxwell and Hay bridges for measurement of inductance (Fig. 315).
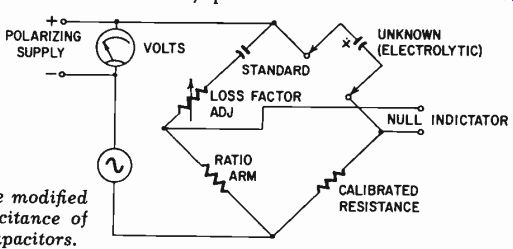
Fig. 316. Drysdale bridge modified for measuring the capacitance of polarized
electrolytic capacitors.
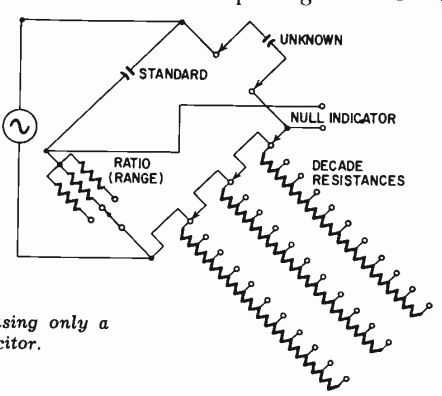
Fig. 317. Capacitance bridge using only a single "standard" capacitor.
The capacitance bridge can be modified (Fig. 316) to allow a polarizing voltage to be applied to the capacitor being measured.
This is useful for measuring electrolytic capacitors. The capacitance bridge can take two variations. One uses resistance ratio arms and employs a standard capacitance in decade arrangement to balance the unknown. The usually preferred method is to use a single standard capacitance with a resistance ratio arm to compare against it, and a standard resistance to compare against the un- known capacitance (Fig. 317). The standard resistance is arranged in decades or calibrated to give a precise reading of capacitance, whose value is multiplied or divided by the factor produced by the ratio arm.
For the larger values of capacitance provision is made for balancing loss components in the unknown capacitor. It can consist of an adjustable resistance either in series or in parallel with the standard capacitor (Fig. 318). The advantage of having the resistance in series is that it enables the polarizing supply to be inserted in series with the alternating test frequency. Then the standard capacitor, having a high voltage rating, prevents the polarizing supply from driving current through the remaining arms of the bridge.

Fig. 318. Two ways of including resistance in a capacitance bridge to compensate
for losses in the capacitor under test.
For measuring inductance the choice of configuration depends upon the kind of inductance to be measured. For measuring inductances intended for use on ac only, whether air- or iron-cored, the Maxwell bridge, is usually the more useful. In theory at least it gives an inductance reading independent of frequency. In the formula for balance with a Maxwell bridge, the resistance shunting the standard capacitor produces the same phase deviation at all frequencies as does a series resistance element in an inductance. In the case of an air-cored inductance, the same balance should hold throughout the entire frequency range.
The value is usually read from a variable resistance in one of the arms, while a ratio resistor is employed in the other. The reading is given in terms of inductance, based on the multiplying factor derived from the resistance relationship in conjunction with the capacitor in the balancing arm.
While the Maxwell bridge will give a balance that is independent of frequency for an air-cored coil (provided capacitance effects in the coil are negligible), it does not do so with an iron-core coil--the losses due to the core appear as an effective shunt resistor.
For an iron-cored inductance, the Hay bridge often proves best, especially in the frequency range at the low end of the audio spectrum, where the principal component of losses is the core loss. This bridge will then give the nearest approximation to a balance independent of frequency (Fig. 319).
Another advantage of the Hay bridge is that it can readily be adapted to pass polarizing current through the inductance, for measuring with fair precision the inductance of a smoothing or coupling choke, designed to pass a polarizing current and at the same time to achieve a given inductance value. The choke across the generator and the capacitor across the polarizing supply serve only to isolate the supply.
A practical limitation occurs here because the inductance produces some distortion of the test frequency. In practice one has to use a sinusoidal test frequency, if possible, of 120 cycles, but a smoothing choke distorts even this, so that when balance or null is achieved at 120 cycles, components of 240 cycles and other even-order harmonics of the test frequency are present.
Another adaptation of the Hay bridge is a scalar version in which the resistance arm in series with the test terminals across the generator supply is very small in value, so the voltage drop is less than one-tenth of the applied voltage (Fig. 320). With the special switching arrangement shown, it is possible to analyze in detail, not only the phase and loss components in the inductance being tested, but also its effective harmonic generation. This is achieved by critical examination of the residue at the null.
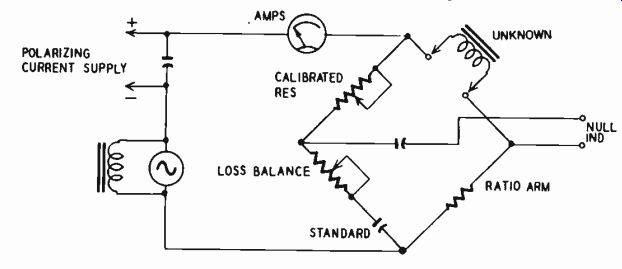
Fig. 319. The Hay bridge is useful for measurement of iron-cored inductances.
The best method of examining the residue is to apply the null output from the bridge to a calibrated scope, which is then adjusted so that the residue waveform falls conveniently between two parallel horizontal lines when appropriately amplified. Switching the scope so the vertical and horizontal deflections give the voltages across two sides of the bridge completes the information. The resistance and capacitance section is switched to produce vertical deflection, while the large resistance section in series with it produces horizontal deflection to give an ellipse that indicates the magnitude and phase angle of the current in the coil without the distortion introduced by its harmonic generation. Switching the scope inputs across the other two arms, the current in the arm adjoining the test inductance will contain the distortion component.
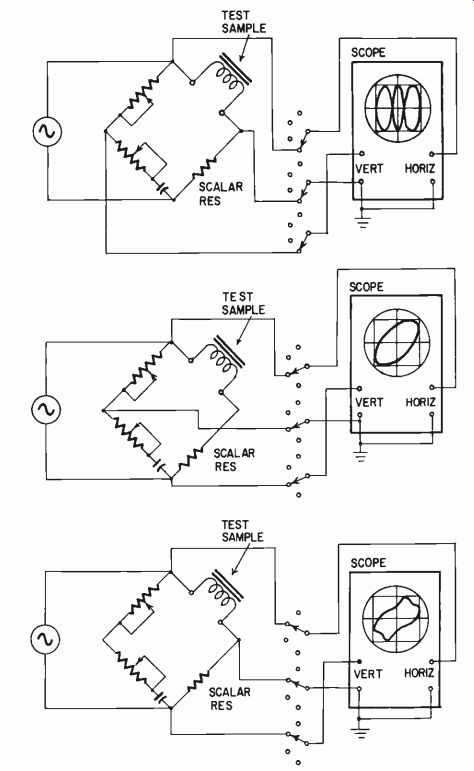
Fig. 320. Measurement procedure for obtaining full details of characteristics
of core materials on ac magnetization.
A further refinement consists of a 90° phase shift introduced into the voltage component across the coil to produce the hysteresis loop for the sample at this particular frequency (Fig. 321).
Using this method, it is possible to produce a precise analysis of the core material on which the inductance is wound. This has been used as a method of analyzing the behavior of different core materials and of predicting the performance of a coil wound on it.
It is useful in the design of iron-cored audio components such as output and other audio transformers.
Other instruments for measuring, in much more approximate terms, resistance and impedance, inductance and capacitance, are the so-called direct-reading types. The disadvantage of all bridge type instruments is that they rely upon attaining a null deflection, either with a meter or some other kind of indicator, and then reading from the dials (with which the adjustment has been made) the value of the component measured.
Direct-reading resistance meters, called ohmmeters, utilize either a battery or a rectified line-voltage source and measure the current flowing through the unknown resistance from a known voltage, or the voltage developed across a resistance when a known current is passed through it. Basic ohmmeter circuits are illustrated in Fig. 322.
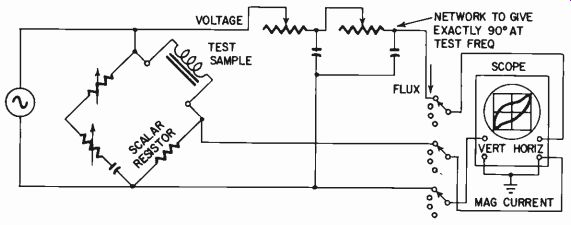
Fig. 321. Additional phase-shift network in configuration of Fig. 320 enables
hysteresis loop to be displayed.
The methods of adjustment are arranged so that a variation in supply voltage does not interfere appreciably with accuracy of the reading. The adjustment is made in such a way that it modifies the deflection of the instrument so full-scale reading can easily be obtained for an open or closed circuit, while not materially affecting the "standard" resistance value with which the unknown is compared when connected to the terminals of the instrument.
An ohmmeter as an instrument is severely restricted in accuracy. In the center-scale region a deviation of 1% in the accuracy of current indication, normal for a first-grade instrument, represents approximately an 8% error in resistance reading-assuming the calibration is accurate in the first place. Errors in component values add to the inaccuracy of reading. Consequently it is not advisable to rely on the resistance reading of an ohmmeter to closer than 10%.
However, the meter can be read to closer than 10%, at least in the middle of the scale of a good instrument. This makes it useful as a means of comparing resistance values. This is often valuable in audio work, because what are needed are balanced or matched resistors-two or more resistors, having values within a certain percentage of one another, the absolute value of the resistors not being important.
In a push-pull amplifier, the value of the resistors in the plate circuit of the two driver tubes should be within certain limits. But it is more important that the resistors be within a certain percentage of one another than that they be within a certain percentage of a specified value.
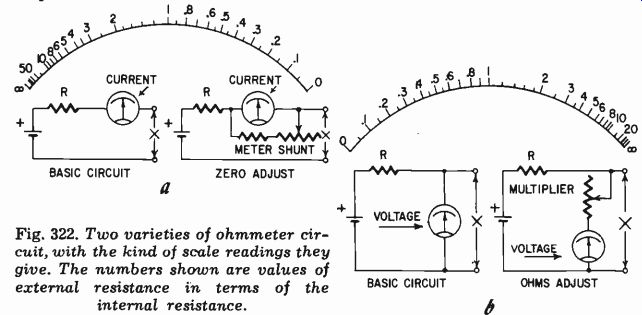
Fig. 322. Two varieties of ohmmeter circuit, with the kind of scale readings
they give. The numbers shown are values of external resistance in terms of
the internal resistance.
For convenience in production, it is usual to specify component values of close tolerance, because this enables the operation to be set up without the necessity for matching values in the same amplifier. For home-construction, it is simpler to use a resistance meter and match a couple of values to one another, without being sure that the values come within a specific tolerance of their coded value.
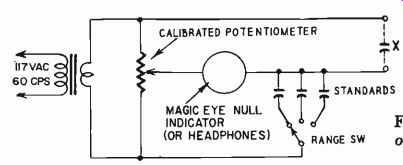
Fig. 323. General arrangement of a simple, easy-to-read capacitance bridge.
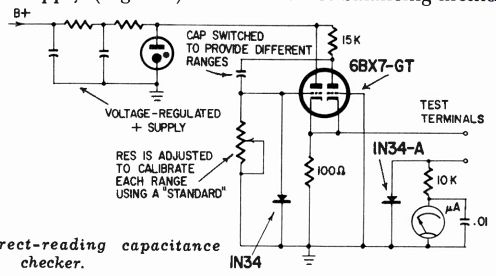
Fig. 324. Direct-reading capacitance checker.
A simple capacitance bridge is also easy to use. It consists of a high-accuracy potentiometer which takes the place of the normal ratio arm and performs a comparison check between the unknown and a "standard." Switching in different values for the "standard" acts as a range change and enables a quick null to be obtained on whichever range is appropriate. This type usually comes with a built-in magic-eye null indicator and uses the 60-cycle line voltage as a generator supply (Fig. 323). This resistance-balancing method achieves an accuracy comparable to that given by an ohmmeter type instrument for resistance. It is not actually direct-reading, but is much simpler to use than the regular type bridge.
Another type of capacitance checker is really direct reading. It works by repetitively discharging the capacitor and measuring the pulse required to charge it again. The circuit is shown in Fig. 324. The 6BX7-GT works as a cathode-coupled multivibrator, whose frequency is coarse-controlled by the range switch (not shown) that charges the capacitor. It is fine-controlled by the grid resistor associated with it, and a separate resistor switched in with range obviates the necessity for calibration every time the range is switched.
The circuit is fed from a voltage-regulated supply to assure (as near as possible) pulses of constant magnitude. Pulse shape is improved by use of the 1N34A diode (shown at the left) which prevents that grid from ever going positive from ground and thus limits the positive-going pulse in the 100-ohm cathode resistor.
The short positive-going pulse, sends a charge into the capacitor connected to the test terminals, which is measured by the micro ammeter. The negative-going pulse discharges the capacitor again through the 1N34A shown at the right. The .01 of capacitor across the microammeter serves to steady the meter reading, which other wise would try to indicate a succession of very sharp pulses.
This instrument is capable of good accuracy in the "checking" sense and has a convenient linear scale. This means that each range is limited to about a decade of capacitance values, as com- pared with about two decades for the other type. The choice rests largely on preference and purpose.
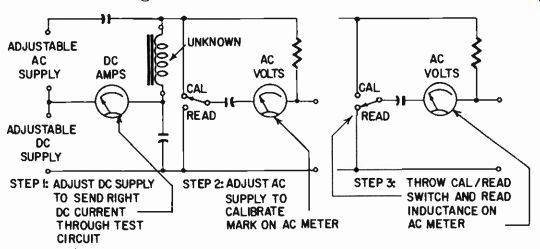
Fig. 325. A simple setup for "measuring" (or checking) inductance
of chokes carrying dc.
For smoothing or coupling-choke inductance checks, a better method is a simple impedance comparison setup, feeding the ac to the choke through a resistance and comparing the voltage developed across the choke with that across the "standard" resistance.
At the same time direct current of measured value is fed through the choke, so the "inductance" is measured at the specified current (Fig. 325).
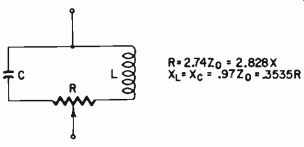
Fig. 326. Elements of the variable-phase constant impedance used in a direct-reading
impedance meter.
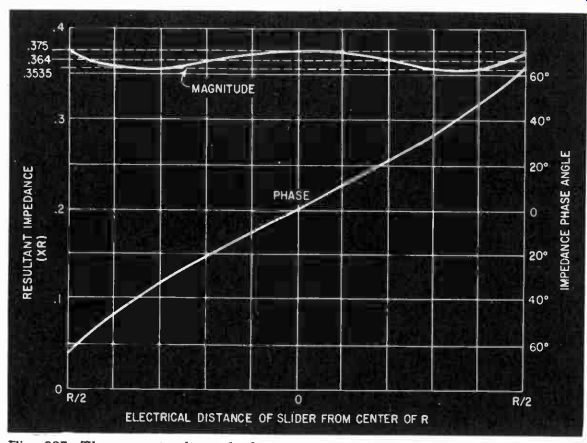
Fig. 327. The magnitude and phase will vary, depending upon the electrical
distance of the potentiometer slider from the center of R (shown in Fig. 326).
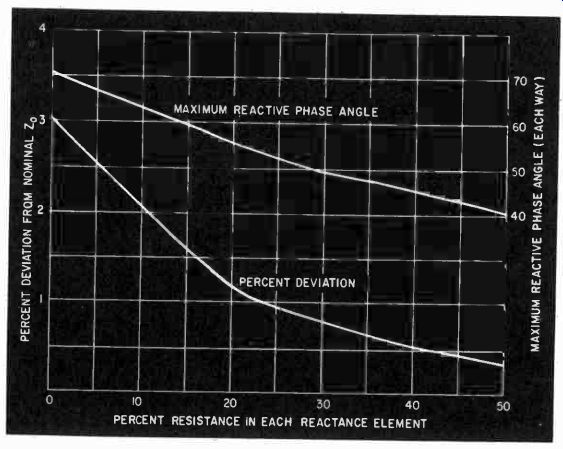
Fig. 328. Using some resistance in the reactance arms of the direct-reading
impedance bridge improves the constancy of magnitude more than it restricts
phase coverage.
The "ohmmeter principle" can also be applied to impedance measurements. Instead of using a "standard" resistance for comparison, the direct-reading impedance meter uses a variable-phase constant impedance, the element for which is shown in Fig. 326.
The impedance is not quite constant, but comes as close as can be utilized in an ohmmeter type instrument. Fig. 327 shows how the magnitude and phase of the impedance of the "standard" vary with phase-adjustment setting. The accuracy can be improved considerably by including some fixed resistance with each reactance element (Fig. 328). The inductance naturally has some losses, so the capacitor can have some resistance added to match the inductor losses.
The standard variable-phase impedance can be incorporated into an "ohmmeter" circuit in one of two ways (Fig. 329). Of course, this circuit will read correctly only at a fixed frequency.
Different frequencies can be used only by switching the L and C components of the "standard" impedance.
The instrument is read much like an ohmmeter, except that the phase-adjustment knob is turned to obtain a maximum or minimum reading (according to which of the circuits of Fig. 329 is used). Then the phase knob indicates the phase of the unknown impedance, while the dial reading gives its magnitude.
A precision type of bridge that overcomes some of the disadvantages of other bridges has recently been introduced. This uses a substitution method: the unknown component is substituted for known and calibrated values inside the bridge, which are taken out of the circuit when the set/measure switch is thrown.
This enables impedances to be measured right down to zero. At the same time, by using a different configuration, admittances can also be measured right down to zero (which takes impedance up to infinity).
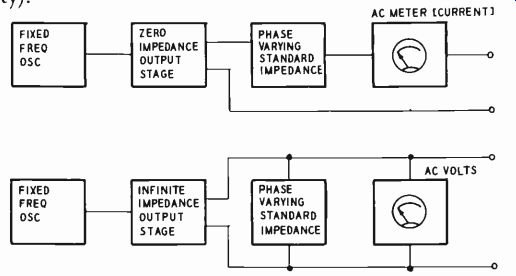
Fig. 329. Two basic ways of using the standard variable-phase impedance in
a practical meter. One requires a zero resistance and the other an infinite
resistance stage, just at the operating frequency.
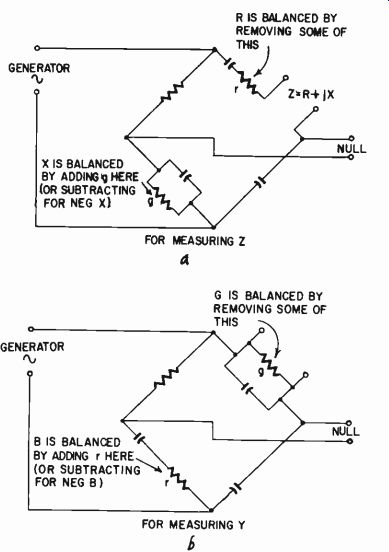
Fig. 330. Basic configurations of the impedance-admittance bridge that carries
through zero values by using a substitution or incremental technique.
This particular bridge is calibrated in terms of resistance and reactance for the impedance measurement, and in terms of conductance and susceptance for the admittance measurement (Fig. 330). The calibration on reactance and susceptance is based on set frequencies of 100, 1,000 or 10,000 cycles. If different frequencies are used, a correction factor has to be applied to deter mine the actual reactance or susceptance values. The calibration for resistance and conductance is independent of frequency. The bridge is designed around components in the region of 1,000 ohms (or 1,000 micromhos) so it achieves its highest precision when measuring impedances or susceptances in this region. Basically, the precision with which it will measure zero resistance or admittance is as a percentage of the reference impedances of the bridge.
For production purposes, specialized bridge circuits have been developed. The bridge is set up for the accurate value (design center) required, and its indicator is calibrated to read deviation from standard value. The dial is usually marked in go-no-go terms, so an operator without technical skill or knowledge can pass or reject components. While equipment of this type is used to test almost all components used in audio circuits, it is rather specialized and beyond the scope of the present guide.
So much for electrical quantities to be measured. Other basic measurements connected with audio concern the acoustic velocity and pressure of a sound wave, groove velocity in disc recording, and the compliance and viscosity of the disc material, the characteristics of magnetic tape and, for research work preparatory for design of equipment, the measurement of dynamic characteristics of non linear amplifying components such as tubes and transistors.
Acoustic velocity and pressure The properties of sound waves are extremely difficult to measure in absolute terms and yet this is necessary if we are to have a satisfactory starting point. The problem remains that we have a speaker and a microphone, with electronic equipment in between which may include recorders, broadcast transmitters and other items. How can we know we have a linear relationship between the original sound wave and the electrical audio signal? How can we be sure we have either a flat microphone or a flat speaker? We can use a microphone assumed to have a flat frequency response to calibrate a speaker, or we can use a speaker assumed to have a flat frequency response to calibrate a microphone, but how do we know just where we stand? The only way is to have some independent method of measuring either sound velocity or pressure.
Books on acoustic theory explain the basic wave phenomena and formulas which have been substantiated quite well by experimental research. It is possible quite easily to measure linear velocity of air particles or to maintain air, particles at a known linear velocity. The difficulty is measuring the velocity that occurs back and forth due to the passage of a sound wave. Similarly it is
readily possible to measure the static pressure of air. The difficulty is in precision measurement of air-pressure fluctuation. The difficulty can better be appreciated when we realize that the pressure fluctuations are no more than about 1-millionth of the static pressure.

Fig. 331. Air flowing in opposite directions past an inclined disc tends to
make it rotate in the same direction.
The best form of standardization is based on the use of a simple device called a Rayleigh disc. This is a small disc suspended in the air so that the movement of air particles tends to turn it. You may have noticed that the wind causes leaves suspended on a tree to flutter back and forth. The tendency of air striking a surface free to pivot is to set the surface at right angles to the direction of air travel, to produce a maximum opposition. This happens if a disc is suspended in a column of moving air (Fig. 331).
The velocity of" vibration due to the passage of a sound wave tends to turn the disc just the same as a steady flow, and the torsion or force produced is proportional to the average effect of the velocity through the cycle of the wave's passage.
Provided the size of the disc is kept small compared to the wave length of the sound being measured, this principle remains true.
A static torsion can be set up, as measured by the thread supporting the disc, and compared with the torsion produced by a known steady draft of air past the disc.
In this way it is possible to calibrate accurately the acoustic velocity of air particles in a wave. To do this, of course, it is necessary to exclude direct drafts, which will have an effect on the disc completely swamping that due to sound waves passing. For this purpose, the Rayleigh disc is inserted in a large tube and the sound wave is produced by a sound generator from one end of the tube. This enables a calibrated acoustic velocity to be established in the tunnel in which the Rayleigh disc is contained.
From the established properties of air (its density and elasticity) the acoustic pressure can also be calculated at this same point in the tunnel. By placing a microphone for calibration in such a position as not to obstruct the passage of air, a pressure or velocity calibration of the microphone can be obtained. The microphone must be placed in a position where the intensity is the same as at the Rayleigh disc. This, in essence, is the standard method of calibrating a microphone.
Groove velocity
Groove velocity in disc recording is probably one of the easiest things to measure in audio. Some refinements which give better precision are beyond the scope of this guide, but, in simple terms, the velocity of projected stylus movement in disc recording can be measured by examination under a point source of light (Fig. 332).
When the groove is unmodulated, the point source of light will be reflected at a single point in the whole succession of grooves right across the disc, so as to produce a narrow straight-line reflection. When the groove is modulated by a tone of known frequency, light is reflected from the groove at an angle dependent on the maximum slope the groove makes with a constant radius. So the angular width of the band of light is proportional to the maximum angle of the groove and to its original unmodulated radius. The maximum angle of the groove multiplied by the linear velocity of the record at this radius gives the lateral groove velocity. This maximum occurs at the mid-point of its excursion and is the maxi mum groove velocity of the wave.
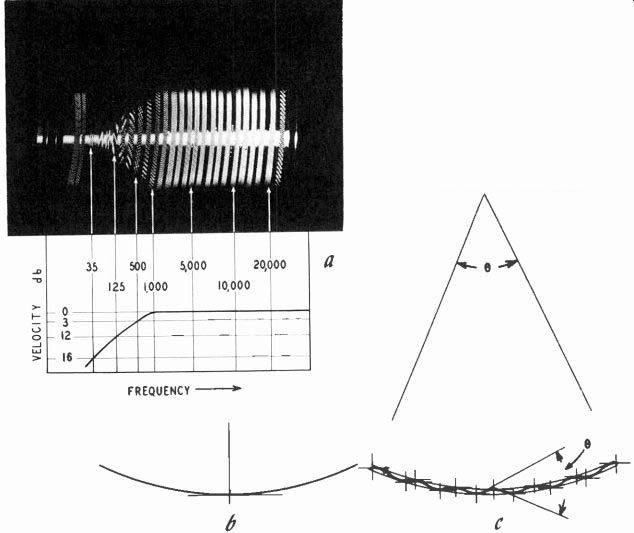
Fig.
332. Basis for the light pattern calibration of velocity characteristic of
records: (a) complete pattern of a test record shows its frequency response;
(b) single reflection from an unmodulated groove; (c) width of reflection from
modulated groove depends on maximum velocity.
The record does not rotate so as to produce constant linear velocity, but a constant rpm or angular velocity. Consequently, the same maximum stylus velocity must be accompanied by an in crease in angle at a smaller radius, so the linear velocity times the groove angle gives the same product for stylus velocity. As a result, a disc recorded with the same frequency all the way through, at the same maximum velocity, will produce a parallel band of light from inside to outside.
Because the product of the angle and linear velocity gives the maximum stylus velocity without reference to frequency, the width of the band is also independent of the frequency at which the disc is recorded and dependent only on the maximum groove velocity.
Maximum amplitude, of course, is another thing, since this will be inversely proportional to frequency for a constant maximum velocity.
Disc compliance and viscosity
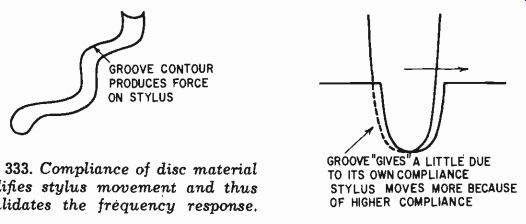
Fig. 333. Compliance of disc material modifies stylus movement and thus invalidates
the frequency response.
Compliance and viscosity of disc material are important be cause they contribute to the performance of a pickup. Just as the compliance and viscosity of the stylus support control the movement in the pickup itself, so the compliance and viscosity of the materials of which the disc is made enter the picture in determining the performance of the overall arrangement (Fig. 333).
At the date of writing, no standard has been established in this regard and consequently different discs recorded with the same characteristics, as measured by the same basic velocity method just described, used with different pickups, produce apparently conflicting results. This is due to the lack of standardization between pickup and record material.
Naturally, each pickup manufacturer will choose a test record that makes his pickup look best. This does not say that there is necessarily any major discrepancy between test records in terms of groove velocity. But different test records will not give consistent results with various pickups because of the different way the material of the disc contributes to the performance of the pickup.
The compliance and mass, or rotational mass, of a pickup can be measured or computed from measurements that will be discussed in detail in Section 7. The best method is to apply the drive force through the coil of the pickup and note the frequency and magnitude relationships between the drive force and the stylus movement as measured by a projection method using the shadow produced optically to indicate the movement magnitude relative to the driving force. Extra calibrated mass is added to the stylus and the experiment repeated. This can produce a characteristic mass-compliance relationship by analysis (Fig. 334).
Applying the same pickup to the groove of a disc and maintaining the same method of measurement will show in what way the compliance and viscosity of the disc material modify the stylus movement. Naturally the compliance of the disc material should be very much lower than the compliance of the pickup, and hence will tend to stop its movement altogether. If the disc material had zero compliance, it would rigidly lock the stylus and no movement would be observed.
This comparative measurement can be made at a variety of frequencies to determine the compliance characteristics of the record material in comparison with the compliance characteristic of the stylus mechanism.
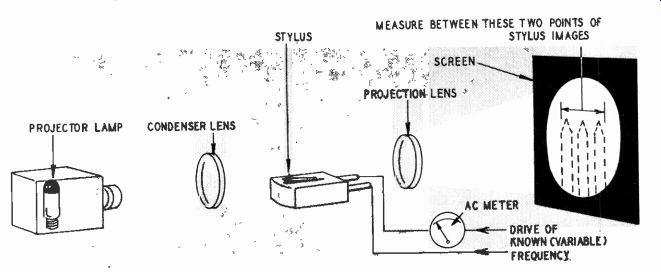
Fig. 334. Setup for computing the compliance of a pickup.
Viscosity produces a loss effect, much the same as introducing resistance into an L-C circuit. This is determined by the phase relationship of the movement through the drive force provided by the coil or whatever type of drive is used. It is, obviously, essential for this kind of measurement to use the simplest type of mechanism in which there are the minimum of mechanical effects to compensate or calculate for, so the basic compliance properties are readily separated from other properties in the unit.
Tape magnetization
Measuring the velocity of groove movement on a disc is relatively simple because it can be done optically. Tape is not so simple because the precise measurement of a rate of fluctuation of magnetic field along a magnetic oxide is extremely difficult. The only way of making a measurement in which compensation can be supplied by calculation alone for the characteristics of the measuring device, is to use a single-loop pickup of the smallest possible dimension (Fig. 335).
The output from a regular iron-cored playback head is quite small, so one can imagine how small would be the output from a single-turn pickup. Such an approach may be possible for academic verification of first principles, over a comparatively narrow frequency range and at fairly high-level magnetization on the tape.
However, all is not as difficult as it may seem. It is relatively easy to compute or measure the losses of both recording and play back heads by means independent of the tape. The use of high-frequency bias helps by decreasing the complications involved.
Because the audio component is a small current riding on top of the bigger bias current, various stray losses that otherwise might become important can be ignored.
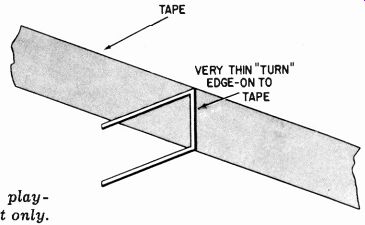
Fig. 335. Single-loop magnetic play back head has academic interest only.
The electrical characteristics of the head can be measured with out the presence of tape, so a correction can be evaluated for production of constant magnetizing force at the air gap against the magnetizing current. With a perfect, loss-free head (in which the capacitance of the winding and any losses in the core material have no effect) the magnetization at the gap is directly proportional to the current flowing in the coil at all frequencies. The correction factor is easy to calculate and is the only thing requiring compensation.
To know the magnetization actually put on the tape, we need to know the losses that occur in the tape. These are principally due to self-demagnetization of the tape, an effect which occurs increasingly at the higher frequencies because of the progressive shortness of the effective magnets induced on it.
Playback-head characteristics can be calculated on the basis of the gap width of the playback head, there being theoretical frequencies where nulls occur in the playback because the gap is just a wavelength, or an exact multiple of a wavelength, long.
Experimental verification of this principle shows that an adjustment has to be made according to the configuration of the gap, so the precise null points do not occur at these harmonically related intervals.
However, the precise frequencies at which null points occur above the cutoff point of the head do enable the effective gap to be calculated, and the effect of high-frequency rolloff due to gap width can be interpolated. Thus, a secondary measure of magnetization on the tape can be obtained.
Results using these two approaches prove that it is possible to determine the strength of the field placed on the tape within fairly close limits. Of course, subsidiary losses in the playback head also require compensation. The precise density of magnetization on the tape can be calculated from the knowledge of the precise gap dimension, deduced from the basic induction formula.
All that remains now is to deduce the characteristics of the magnetic tape itself. These can be derived by magnetizing the tape under different combinations of bias and audio current and determining the point where distortion reaches various levels so as to derive figures for the coercivity of the tape and also the magnetization level at which distortion reaches a predetermined figure, such as 2% or 4%. Of course, the tape magnetization characteristic can also be measured by the method employed for determining the magnetic properties of samples of other magnetic material.
Tube and transistor dynamic characteristics One more type of basic measurement concerns the setup for determining the dynamic characteristic of amplifier components such as tubes and transistors. These can sometimes be satisfactorily derived from published curves, but it often happens that all of the data needed are not available. This is particularly true of transistors.
Sometimes the transfer characteristics, in terms of collector voltage and current against base current, for grounded-emitter operation, are published, and perhaps various thermal characteristics also. What may not be given is the way the input resistance varies with input current at the base and with output loading. So, al though we may have enough data to calculate a working current gain of the transistor, we do not have the data necessary to find the ideal working source resistance to maintain a specific degree of distortion with a voltage input rather than a current input.
In tube operation, a typical problem may be determining satisfactory transformer taps, working voltage and load value for Ultra-Linear operation. Characteristics are given for pentode or triode [...pg. 78, 79 missing]
Recommended Reading
1. E. N. Bradley, The Oscilloscope Book, Norman Price Publishers Ltd.; London, 1951.
2. Norman H. Crowhurst, "Calibrating Audio Oscillators," RADIO-ELECTRONICS Magazine; November, 1952.
3. F. D. Lewis, "Frequency and Time Standards," Proceedings of the IRE; September, 1955.
4. National Bureau of Standards, "Standard Frequencies and Time Signals WWV and WWVH," Proceedings of the IRE; October, 1956.
5. Fritz A. Kuttner, "Toward the Perfect-Pitch Machine," High Fidelity; August, 1956.
6. E. N. Bradley, Radio Servicing Instruments, Norman Price Publishers Ltd.; London, 1953.
7. Norman H. Crowhurst, "Transformer Iron Losses," Electronic Engineering; October, 1951.
8. Norman H. Crowhurst, "High-Accuracy Ohmmeter," RADIO-ELECTRONICS Magazine; August, 1954
9. Norman H. Crowhurst, "A Direct-Reading Impedance Meter," Electronic Engineering; January, 1949.
10. "A New Approach to Audio-Frequency Impedance Measurement," General Radio Experimenter; July, 1955.
11. Leo L. Beranek, Acoustics, McGraw-Hill, 1954.
12. P. E. Axon, "An Investigation into the Mechanism of Magnetic Tape Recording," Proceedings of the IRE; May, 1952.
13. P. E. Axon, "Some Problems of Magnetic Tape Reproduction," Sound Recording & Reproduction; May 1954.
14. G. A. Briggs, Sound Reproduction, Wharfedale Wireless Works, 1953.
15. F. P. Moss, "An Audio Frequency Phase Meter," Electronic Engineering, August, 1954.