AMAZON multi-meters discounts AMAZON oscilloscope discounts
Several types of waveforms come into analysis in transistor black-and-white TV circuits. The most prominent type is the self-generated waveform; with reference to Fig. 1, such waveforms are found in the uhf tuner, vhf tuner, vertical oscillator, and horizontal-oscillator sections. These are the source sections of self-generated waveforms, from which the waveforms branch out through waveshaping circuits into many driven sections. In other words, we are concerned with the ac voltage distribution of the receiver in the same way that we are concerned with the DC voltage distribution. Many of the source waveforms, such as those generated by the vertical and horizontal oscillators and processed by waveshapers, can be observed directly with the aid of a scope. On the other hand, waveforms generated by the uhf and vhf oscillators have frequencies that are beyond the capabilities of ordinary service scopes, and these waveforms must be analyzed indirectly.
Therefore, we sub-classify self-generated waveforms into the directly observable types, and the indirectly observable types.
Next, let us note another basic type of waveform that is al most as prominent as the self-generated waveform. This class of waveform is the applied type, which is subclassified into the signal and power types. With reference to Fig. 1, such waveforms are found throughout the signal channels and the sync channel, and in the low-voltage power supply (provided the transistor receiver is operated from a 60-Hz line). Applied waveforms are, in turn, subclassified into normal-operation and test-signal types. For example, the composite modulated-rf video signal supplied by an antenna is a normal-operation waveform. Signals supplied by signal generators, audio oscillators, sweep-and-marker generators, square-wave generators, and TV analyzers are test-signal types of waveforms.


Fig. 1, Fig. 2. (A) Normal video-signal waveform, (B) Presence of 60-Hz hum
voltage.
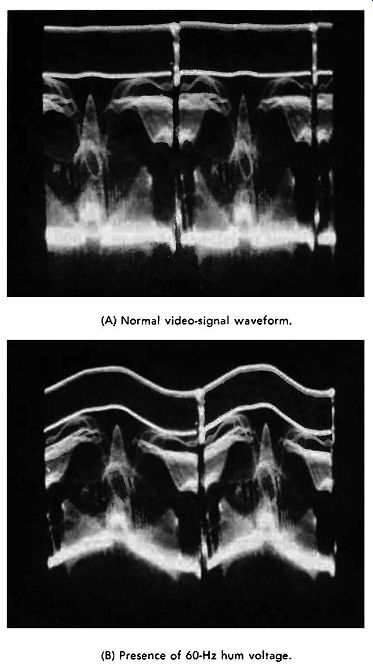
Fig. 3. Normal and distorted signal waveforms.

Fig. 4. Processing of video i-f signal to develop envelope waveform.
Waveforms are also classified into generic and derived types of waveforms. For example, the output from a vhf oscillator is a generic waveform, which means that it is the actual wave form generated by the transistor circuit. On the other hand, the beat waveform that is produced by mixing the vhf oscillator output with the output from a signal generator is a derived waveform. This means that we invoke a process that operates on the generic waveform and develops a new waveform that is related to the generic waveform, but is not the same. For ex ample, if we apply an fm sweep signal to the input terminals of a vhf tuner, the signal beats with the vhf-oscillator waveform and develops a new waveform called a frequency-response curve. A frequency-response curve is a derived waveform.
Generic waveforms are illustrated in Fig. 2A and B. Two generic waveforms are also shown in Fig. 2C. On the other hand, the waveform to Q22 is a shaped waveform. In the first analysis, we merely note the waveform amplitude by measuring its peak-to-peak voltage. Preliminary signal-tracing procedures involve only a check for presence or absence of various waveforms. More detailed analyses include measurement of frequency or repetition rate, and observation of waveform distortions. There are many classifications of waveform distortion, the more basic types of which are explained subsequently.
Every effect has its cause, and if you know how to analyze the effect, you can proceed without hesitation to its cause. Note that waveform displays can be completely misleading unless good practices are observed. For example, circuit loading can be a problem in some situations.
Fig. 3 illustrates normal and distorted waveforms of the applied test-signal type. Note that the antenna supplies a composite modulated-rf video signal, which is a normal-operation waveform. This waveform is immediately converted into a derived waveform by beating against the local-oscillator out put. In turn, the derived waveform is a composite modulated-rf video signal with a beat envelope. This derived waveform is then heterodyned by the mixer transistor which operates as a nonlinear device to produce the i-f signal. This i-f signal is a composite modulated-i-f video waveform which has a lower carrier frequency than the input waveform. Next, the i-f waveform is processed by a semiconductor diode that operates as a nonlinear device to develop the envelope waveform as depicted in Fig. 4.
SIGNAL-TRACING PROCEDURES
(A) Schematic of probe. (B) Specifications.
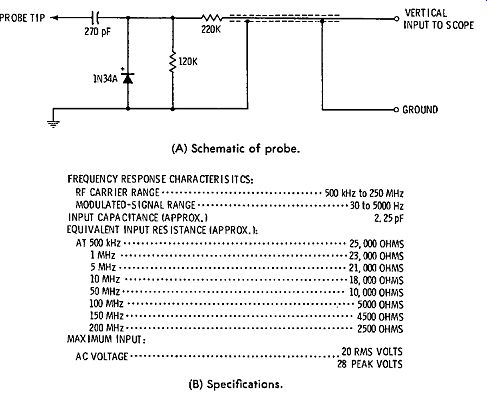
Fig. 5. Typical demodulator probe and specifications.
SIGNAL-TRACING PROCEDURES
Signal tracing generally refers to checking the course of an applied composite video signal through the picture, sound, and sync channels. On the other hand, waveform checking generally refers to the analysis of self-generated waveforms. These two areas of troubleshooting overlap because a horizontal-afc waveform, for example, comprises both applied and self-generated components. Nevertheless, the general distinction is a useful one. In the i-f amplifier, a demodulator probe must be used with the scope to check the progress of an i-f signal. A typical demodulator probe is depicted in Fig. 5. Note that the probe has an input resistance of about 15,000 ohms and an input capacitance of approximately 2.5 pF when an i-f signal is applied. This is a comparatively high input impedance, compared with the internal impedance and the load impedances of the i-f transistor (see Fig. 6). Therefore, signal tracing in the i-f amplifier usually involves no serious loading problem.
Waveforms processed by a demodulator probe are usually distorted, due to the limited envelope response of the probe.
Therefore, it is helpful to operate the scope on 30-Hz deflection, so that the vertical interval and low-frequency components of the video waveform are displayed. We are chiefly interested in the presence or absence of signal. Peak-to-peak voltage measurements are unreliable because the input capacitance of a demodulator probe tends to detune the circuit across which it is applied. This detuning effect will occasionally throw an i-f amplifier into oscillation, if the amplifier is substantially regenerative. For example, if one of the neutralizing capacitors in Fig. 6 were open, there is a possibility of oscillation when the probe is applied at associated terminals. Oscillation in an i-f amplifier blocks signal passage, and can be confused with other defects such as short-circuits. Note that if oscillation occurs, the DC voltage output from the picture detector increases greatly.
A demodulator probe is also used to signal-trace the inter carrier sound i-f signal from the sound-takeoff point in the video amplifier to the fm detector. Fig. 7 shows the configuration of a typical intercarrier sound i-f system. Since the bandwidth of a sound i-f amplifier is comparatively narrow, the collector load impedances are comparatively high. There fore, a demodulator probe loads the tuned circuits and detunes them from their 4.5-MHz center frequency; however, the presence or absence of signal at each stage is clearly indicated in the test. Note that an intercarrier sound signal must be present. A TV station signal is suitable, or a TV analyzer signal that has a 4.5-MHz tone signal included with the video signal.
The tone signal is displayed as a sine wave on the scope screen.
An rf sweep generator provides a suitable test for signal tracing through the picture channel to the output of the video amplifier. However, an rf sweep signal applied to the antenna input terminals of the receiver will not provide an intercarrier-sound signal. If a sweep generator or an a-m generator is to be used for signal-tracing the intercarrier-sound channel, the signal must be applied at the output of the picture detector, and the generator must be tuned to a center frequency of 4.5 MHz. Note in passing that service-type a-m generators usually have more or less incidental fm. This means that if the genera tor is tuned to 4.5 MHz, and is amplitude-modulated, the out put signal will contain incidental fm in addition to amplitude modulation. Greater percentages of amplitude modulation tend to produce greater deviation of the carrier.
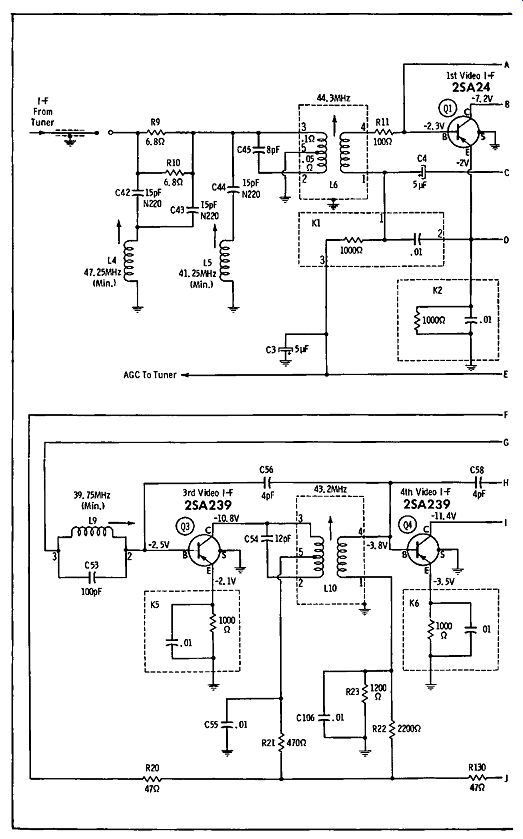

Fig. 6. Typical video i.f amplifier strip.
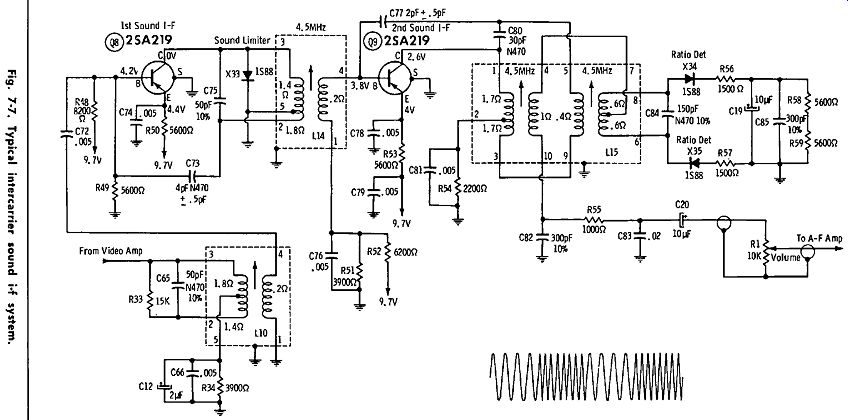
Fig. 7.
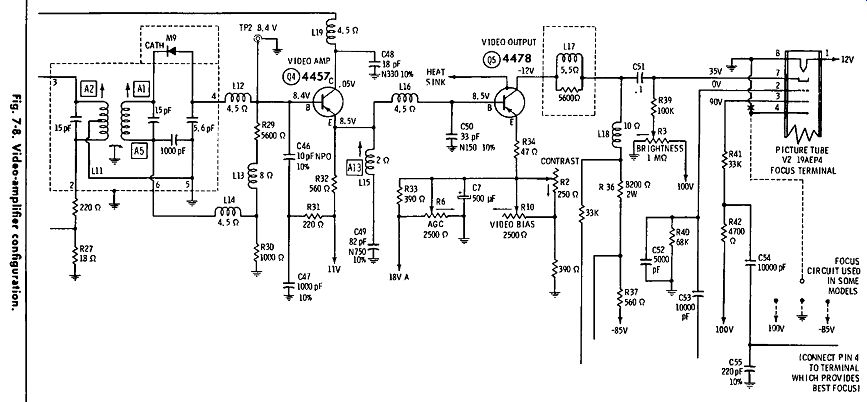
Fig. 8.
In the video-amplifier section of the receiver, a low-capacitance probe is used with the scope in signal-tracing procedures.
Fig. 8 depicts the configuration of a typical video amplifier.
The first stage operates as an emitter follower, and produces no voltage gain. However, it provides the needed current gain for driving the video-output transistor. The total voltage gain of the system is 125 times in this example. A signal-tracing test not only shows the stage gain, but also shows distortion that may be occurring. For example, if a transistor is clipping the camera signal, the scope display appears as illustrated in Fig. 7-9. Poor high-frequency response produces rounding of the sync pulses. However, analysis of frequency response can be made to better advantage with a video-frequency sweep generator, or a square-wave generator.
A low-capacitance probe is also used to trace signals through the audio amplifier and the sync system. A TV station signal can be used, although generator signals are preferable because they are steady. If a TV analyzer is available that provides a Fig. 9. Clipping of camera signal.
4.5-MHz tone signal, a sine waveform will normally be ob served in the audio section. Otherwise, the audio output from an a-m generator, or from an audio oscillator, can be applied at the input of the audio section. To check the sync system, any pattern generator can be used. For example, a test-pattern generator, white-dot or crosshatch generator, or even a color bar generator is suitable. It is desirable to use a generator that provides well-shaped sync pulses, so that a meaningful comparison can be made with the waveforms specified in receiver service data.
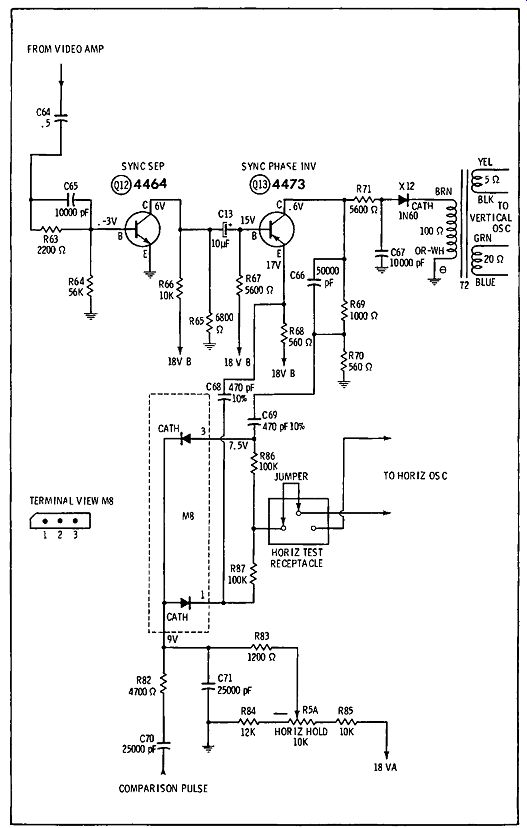
Fig. 7-10. Typical horizontal and vertical sync system.
Fig. 10 shows a typical horizontal and vertical sync system. The sync-separator transistor Q12 is reverse-biased, and clips the sync tips from the composite video signal. This stage provides a voltage gain, and drives sync-phase inverter Q13, which provides double-ended output. R71 and C67 form an integrating circuit that accepts the vertical-sync pulses and rejects the horizontal-sync pulses. To avoid confusion due to kickback from the vertical oscillator, the oscillator transistor is removed from its socket during the waveform check. The integrator normally introduces an insertion loss of 37 percent.
Diode X12 is used to minimize reverse coupling from the vertical oscillator into the sync phase-inverter stage.
The foregoing waveforms are signal waveforms. However, the waveforms associated with MS are combination wave forms; they comprise horizontal sync pulses and comparison pulses from the flyback section that have been shaped in saw tooth waves. Both the amplitudes and the shapes of these wave forms are of practical concern. In case of sync trouble, signal tracing procedures are very helpful to localize the defective stage. Then, DC voltage and resistance measurements are generally utilized to close in on the defective component. Due to circuit interaction, trouble symptoms are not always clear. For example, if one diode in the sync phase-comparison circuit has a poor front-to-back ratio, all three waveforms will be distorted. Therefore, it is usually necessary to check the front-to back ratios of both diodes.
WAVEFORM ANALYSIS
The waveforms in a TV receiver system are not sharply distinguished from signals, as noted previously. However, it is helpful to classify those ac voltages that are self-generated as waveforms. From this practical viewpoint, we find waveforms in the rf tuner, vertical and horizontal sections, and in a related way in the power supply system. The 117-volt 60-Hz line applies a sine waveform to the power supply, and this sine waveform is not classified as a signal. Instead, it is an applied power waveform. Again, with reference to Fig. 2B, the three ac voltages that are illustrated are called waveforms, and are not described as signals.
Analysis of the drive waveform to Q22 in Fig. 2C entails a measurement of its peak-to-peak voltage, repetition rate, pulse width, waveshape, and its rise and fall times. A scope calibrated in peak-to-peak voltage values is utilized to measure the amplitude of the waveform. Its repetition rate can usually be taken for granted because the symptoms of horizontal sync loss are generally prominent. However, in the case of a dark screen, measurement of repetition rate is necessary. That is, the amplitude and shape of the waveform might be normal, but if its repetition rate is greatly abnormal or subnormal, the horizontal-output system develops deteriorated circuit action.
If we know that the repetition rate of the drive waveform to Q22 in Fig. 2C is normal, we need not measure the pulse width directly. Instead, we can merely note the duty cycle and compare it with the duty cycle specified in the receiver service data. Direct measurement of pulse width requires a scope that has a calibrated time base. The waveshape can be evaluated with an ordinary service-type scope, provided that the scope has ample bandwidth to accommodate the higher harmonics in the waveform. The horizontal-output system will not operate normally if the rise and fall times of the drive waveform are too slow. Measurement of rise or fall time requires a scope that has triggered and calibrated sweeps. Since only a minority of service shops have this type of scope available, rise and fall times are generally omitted from receiver service data. That is, routine service work does not provide for this aspect of wave form analysis.
Key waveforms for a vertical-sweep system are illustrated in Fig. 11. Waveform analysis entails a measurement of peak-to-peak voltage, repetition rate, and waveshape. Rise and fall times are of comparatively little significance in this case, and are considered only under the classification of waveshape.
The amplitude of a vertical-system waveform is of basic concern. Repetition rate has an important effect on amplitude, but we need not measure the waveform repetition rate unless the screen is dark. As long as the pattern is in vertical sync lock, the repetition rate will be correct. Waveshape is also of basic significance. Distortion of any type indicates a circuit defect that should be localized and identified. In the analysis of wave shape, the linearity of the drive waveform to Q18 is of basic concern. It is closely associated with vertical linearity in the picture. If the specified waveshape cannot be matched by adjustment of the vertical-linearity control, we know that a component defect is present.
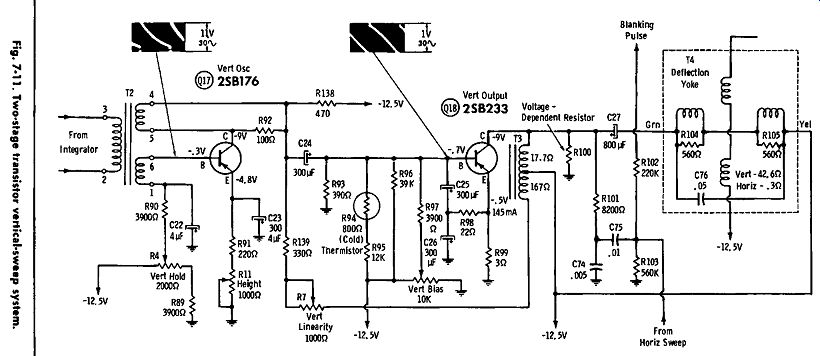
Fig. 11.
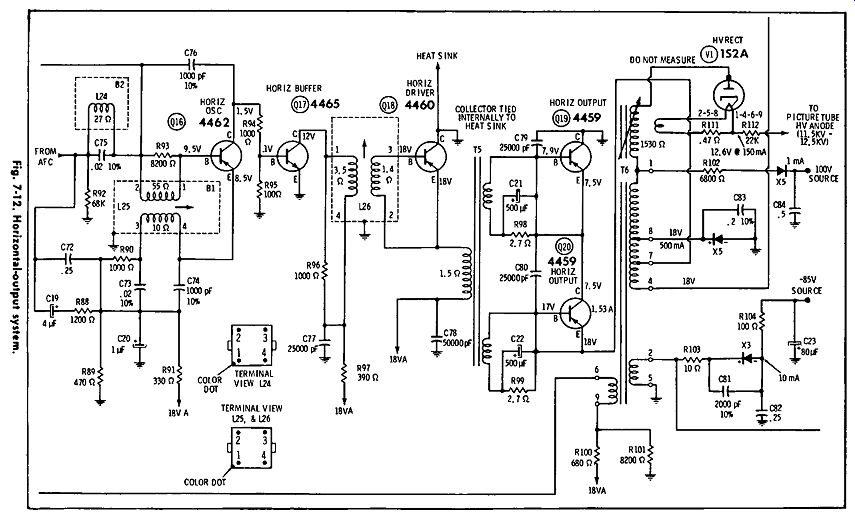
Fig. 12.
Of course, there is a possibility of reflected trouble in the system of Fig. -7-11. For example, if there is an open damping resistor, a ringing interval will be generated in the output waveform. Due to feedback via T3, this ringing interval will also appear in the drive waveform to Q18. Therefore, wave form analysis necessitates the consideration of reflected trouble possibilities; otherwise, we can waste time looking for the defective component in the wrong places. Interpretation of distorted waveforms requires both study and practical experience.
If we have a good understanding of circuit action, waveform analysis becomes much less mysterious than it seems to the beginner.
Circuit interaction is also encountered in the horizontal-output system. For example, with reference to Fig. 12, a few shorted turns in T6 can change the amplitudes and shapes of many of the waveforms. The horizontal-hold control should first be adjusted so that the horizontal oscillator free-wheels at approximately 15,750 Hz. This permits us to determine whether the drive waveform to Q1 7 is correct. Since the transistor operates as a buffer, component defects in the output system will not affect the drive waveform under this condition of test. Leaky or open capacitors can produce waveform distortions that are easily confused with transformer defects. Since capacitors are the more common troublemakers, we check out the capacitors first in case of doubt.
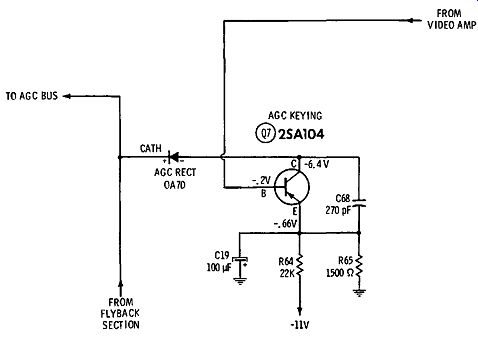
Fig. 13. Keyed-age circuit.
Next, let us briefly consider a keyed-age circuit, such as the one depicted in Fig. 13. We normally find a video waveform at the base of the transistor, such as that illustrated in Fig. 7-3A. A flyback pulse is introduced from the sweep section, which becomes shaped into a sawtooth waveform. This pulse is the collector-supply voltage, and the pulse is normally coincident with the horizontal-sync pulse applied to the base. Since the emitter is reverse-biased, Q7 can conduct only when the flyback pulse is present. The amount of pulse conduction depends on the amplitude of the horizontal-sync pulse. Since the sync pulse is amplified during the conduction interval, the collector waveform displays a combination of the shaped comparison pulse and the horizontal-sync pulse. Therefore, the picture must be in horizontal sync in order to make a valid waveform check.
Fig. 14 depicts a transistor power supply. The waveform of interest in this case is the ripple waveform on the -11.8 volt line. Its amplitude should not exceed the specified value -0.5-volt pk-pk in this example. An excessive amplitude points to a defective filter capacitor in most cases, although a leaky feed back-amplifier or current-regulator transistor can also cause excessive ripple amplitude. Rectifier bridge defects show up as subnormal DC voltage output. It is difficult to analyze the wave forms in the bridge-rectifier circuit unless a scope with balanced vertical input is available. Few service shops utilize this type of scope. Therefore, most component defects are localized by means of voltage and resistance measurements. It is usually necessary to disconnect one end of a rectifier for test.
FREQUENCY-RESPONSE CURVES
A comprehensive coverage of sweep- and marker-generator application cannot be included in this guide. Instead, only the basic principles of response-curve analysis will be covered. Interested readers may refer to specialized alignment handbooks for procedure information and data. Of course, because of circuit variations, the receiver service data should always be consulted when a particular receiver is under test. Fig. 15 shows the configuration of a typical transistor tuner. A normal frequency-response curve is illustrated in Fig. 16A. We are concerned with the hump frequencies and the waveform amplitude. The hump frequencies are measured with a marker generator. Waveform amplitude can be evaluated only on the basis of experience with the sweep generator and scope that are used in the alignment procedure.
Fig. 16B shows how the picture-carrier and sound-carrier frequencies normally fall on the humps of the rf response curve. The humps may not be at exactly the same amplitude, but large discrepancies should be avoided. That is, a reasonably uniform 4-MHz band should be provided for the video-frequency spectrum, and the audio-frequency spectrum should not be excessively attenuated or boosted. Excessive tilt in the top of the rf response curve is associated with impaired picture quality. Because there are various active channels to contend with, compromise alignment is often necessary, but we try to approximate the specified frequency-response curve for each active channel.

Fig. 14

Fig. 15
A typical i-f amplifier strip is depicted in Fig. 6. Most of the receiver gain and selectivity is developed in the i-f system.
Therefore, i-f alignment is a critical consideration in regard to picture quality. Alignment procedure and the specified i-f response curve for a typical transistor TV receiver are shown in Fig. 17. The chief points in curve analysis are the frequencies at the 50 percent-of-peak points, and the trap frequency.
These are 26.75, 23.75, and 22.25MHz, respectively, in this ex ample. A specified curve also depicts the permissible sag at the midband frequency (25 MHz). The bandwidth in this example is 3 MHz. Reduced bandwidth is objectionable because it results in loss of picture detail. Increased bandwidth is desirable, if it can be obtained without developing objectionable sag.
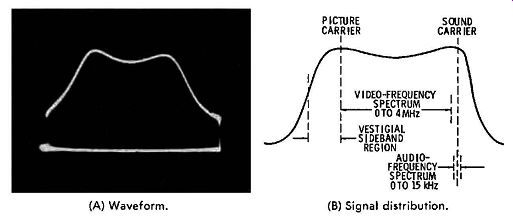
Fig. 16. Rf frequency response curve. (A) Waveform. (B) Signal distribution.
-------------------

Fig. 17
Use an isolation transformer and maintain. voltage at 117 volts. Allow a 20-winute warm-up period for the receiver and test equipment.
Suggested Alignment Tools:
A1 thru A10
GENERAL CEMENT f886B1 B987, 9089
WALSCO 02531-X, 2541, 25B7 Mixer Plate Coll
GENERAL CEMENT •B2B4....... . •. WALSCO #2584
VIDEO IF AUGNMENT
Connect the synchronized sweep voltage from the sweep generator to the horizontal input of the oscilloscope for horizontal deflection.
Use only enough generator output to provide a usable indication.
Note: Response may vary slightly from those shown.
Connect a variable bias supply to the IF AGC line ( point t ) and adjust to obtain a response curve which shows no indication ol overload.
Disable Oscillator section of Mixer-Osc. Set the Channel elector to any non-Interfering channel.
SWEEP MARKER INDICATOR GENERATOR
GENERATOR
GENERATOR ADJUST REMARKS COUPLING FREQUENCY
FREQUENCY
Connect DC probe of
Connect high side to ZZ. 25MHz Al Adjust for
Connect DC probe ol Connect high side to 25.8MHz A2
Adjust for maximum.
--------------

Fig. 18. Typical video-amplifier response curve.
Careful attention should be directed to the sound traps.
Unless the traps are adjusted correctly, sound interference is likely to be visible in the picture. Then, if the fine-tuning control is misadjusted to minimize sound interference, the picture quality will be impaired. Note that if a sound trap is mistuned and falls in the video-signal passband, either the bandwidth of the response curve will be reduced, or a "suck-out" will appear in the curve. Both distortions are objectionable from the stand point of picture quality. If the specified response curve cannot be reasonably approximated, a defect will be found in the i-f system. Capacitors are the most common culprits.
A transistor video-amplifier configuration is shown in Fig. 8. The video-amplifier response curve can be checked with a video-frequency sweep generator and a scope. Fig. 18 illustrates a typical video-frequency response curve. Curve analysis concerns chiefly the bandwidth and the setting of the 4.5-MHz trap. Bandwidth between the 50 percent-of-peak points should be at least as great as that of the i-f amplifier; otherwise, the picture detail will be attenuated. Absorption markers are generally preferred to beat markers in this procedure, because spurious markers are often produced by beat harmonics, and can be very troublesome. Absorption markers do not produce spurious markers.
SQUARE-WAVE TESTS
Since many service shops do not have video-frequency sweep generators available, a square-wave test is often preferred. A square-wave test is made as shown in Fig. 19. It is standard practice to use a 100-kHz square wave, although other repetition rates are also useful in waveform analysis. The shape of the reproduced square wave is chiefly dependent on the peaking-coil inductances and damping-resistor values. However, the values of the load resistors also affect square-wave response. The square-wave response shown in Fig. 19B is typical of economy-type receivers. Deluxe receivers have somewhat better transient response.
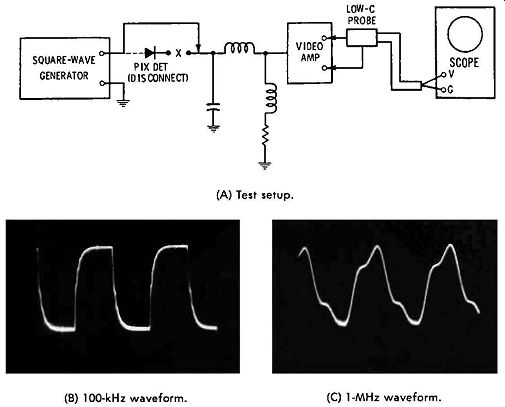
Fig. 19. Checking square-wave response of a video amplifier. (A) Test setup.
(B) 100-kHz waveform. (C) 1-MHz waveform.
Objectionable waveform distortions include excessive over shoot, which may be accompanied by ringing. An overshoot of 10 percent can be tolerated. Diagonal corner rounding is seen in Fig. 19B; excessive corner rounding points to out-of-tolerance peaking coils, and should be corrected. Overshoot and ringing are associated with excessive gain at high frequencies, which in turn is associated with load resistors that are too small in value. Open damping resistors can also cause over shoot and ringing. If a scope is available that has a triggered and calibrated time base, the rise time of the reproduced square wave can be measured. A video amplifier that has a bandwidth of 4 MHz has a rise time of approximately 0.08 µ-s.
In any square-wave test, it should be remembered that the scope must have better response than the video amplifier under test. Otherwise, distortions introduced by the scope will be falsely charged to the video amplifier. On the other hand, in frequency-response tests, it is necessary that the scope merely have good 60-Hz square-wave response. This is because the sweep signal that is used in a frequency-response test is demodulated, and the wave envelope has a 60-Hz repetition rate.
QUIZ
1. Name the sections in a TV receiver that generate wave forms.
2. Why is it impractical to display the output waveform from a uhf oscillator on a scope screen?
3. How is the video i-f signal processed by the picture detector?
4. Describe a signal-tracing procedure.
5. Why must a demodulator probe be used in signal-tracing an i-f amplifier?
6. Explain how a video amplifier may clip the camera signal.
7. What is meant by an intercarrier sound signal?
8. Describe incidental frequency modulation.
9. Why must a low-capacitance probe be used in checking various waveforms?
10. Give an example of circuit interaction.
11. Explain the operation of a signal-biased sync clipper.
12. State some characteristics that are entailed in waveform analysis.
13. Give an example in which rise time is a critical characteristic.
14. When would the repetition rate of a waveform be of concern?
15. Discuss a requirement for waveform linearity.
16. Why are waveforms with excessively high voltages avoided in scope tests?
17. Describe the key waveform in an age circuit.
18. What is the chief waveform of interest in a power-supply system?
19. Explain what is meant by a frequency-response curve.
20. Which sections of a TV receiver are checked for frequency response?
21. What characteristics do we look for in an rf response curve?
22. What characteristics do we look for in an i-f response curve?
23. Name two ways in which a video amplifier can be checked.
24. Discuss the requirements in adjusting a video amplifier for good frequency response.
25. Explain how component defects affect the square-wave response of a video amplifier.