AMAZON multi-meters discounts AMAZON oscilloscope discounts
A color-TV receiver contains all the circuit sections found in a black-and-white receiver, plus the chroma processing, color sync, and convergence circuitry. Fig. 1 shows the block dia gram for a typical color-TV receiver. As far as the duplicated black-and-white sections are concerned, there are certain minor distinctions to be noted, as follows:
1. Tuner frequency-response curves are generally held to somewhat tighter specifications than in monochrome receivers.
2. Similarly, i-f response curves are held to comparatively tight specifications.
3. A delay line is included between the video-amplifier and video-output stages. This delay line normally introduces negligible waveform distortion, and delays the video signal for approximately 0.9µ s.
4. The video-amplifier system often provides phase compensation and provides better square-wave response than its monochrome counterpart.
5. A 3.58-MHz color-subcarrier trap is included in the video amplifier (trap is not shown in Fig. 1).
6. Separate intercarrier-sound and picture detectors may be employed.

Fig. 1
Since waveform analysis is basically the same in the mono chrome sections of both color and black-and-white receivers, the reader is referred to receiver service data for these sections. This Section explains waveform analysis in the chroma processing and color-sync sections of transistor color-TV receivers. We will find that the basic chroma waveforms are quite different from those that have been discussed previously, although the general principles of scope application are the same. It is essential to understand the circuit actions in the chroma sections to interpret the waveforms effectively.
GENERAL SURVEY OF THE COLOR CIRCUITRY
Fig. 2 shows a typical chroma signal-processing and color sync configuration. The color signal is first applied to a chroma bandpass amplifier, which is also called a color i-f amplifier.
This chroma section has the function of effectively separating the chroma signal from the black-and-white signal, as explained in greater detail later. From the color i-f amplifier, the chroma signal is fed to the three chroma demodulators.
These are combination phase and amplitude demodulators, which operate as product detectors; note that a 3.58-MHz color-subcarrier signal is fed into the chroma demodulators from the color oscillator. The chroma demodulators also function as matrices in this example, by mixing the demodulated chroma signal with the monochrome signal.
Other subsections include the color killer, which operates as an electronic switch. In the absence of a chroma signal ( during reception of a monochrome signal), the color killer disables the chroma circuitry, so that colored snow (confetti) cannot be displayed on the picture-tube screen. Another subsection is an automatic chroma-control (ACC) circuit that operates as an age system for the chroma signal. Still another subsection is the 3.58-MHz color oscillator, which contains an associated color-sync function. Its purpose is to reconstitute the color sub carrier signal, and to maintain its frequency and phase in step with the color subcarrier that is suppressed at the color-TV transmitter.
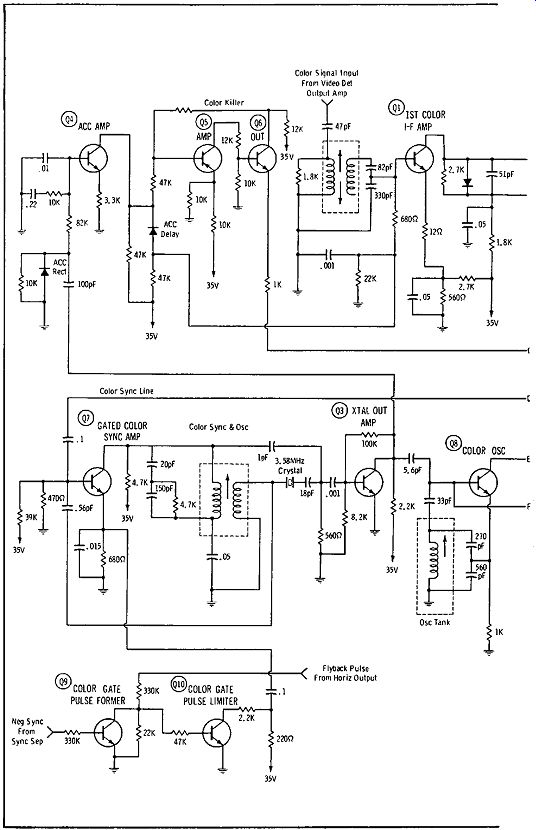
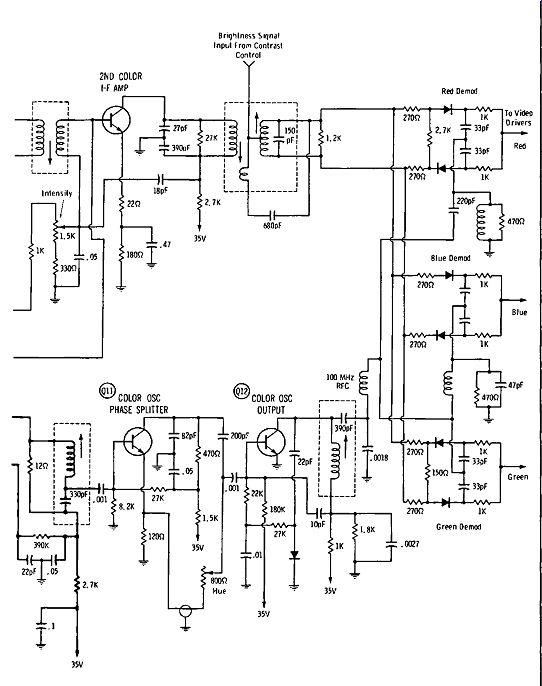
Fig. 2. Chroma signal processing and color-sync configuration.

Fig. 3. Elements of NTSC color bars.
(A) Y signal.
(B) Chroma signal.
(C) Saturated color-bar signal.
CHROMA WAVEFORM FUNDAMENTALS
The complete color signal is a multiplexed waveform in which the chroma information is encoded on a 3.58-MHz color subcarrier. This subcarrier itself is suppressed at the color-TV transmitter, and only the chroma sidebands are transmitted.
This is done to minimize crosstalk between the chroma information and the monochrome information. As noted previously, this color subcarrier (a 3.58-MHz sine wave) is reinserted by the color receiver. A complete color signal with its encoded chroma components is depicted in Fig. 3. In this example, the chroma information comprises color bars, consisting of the primary colors, complementary colors, and white. Color sync is accomplished by means of the color burst, which appears on the back porch of the horizontal sync pulse.
Note that the chroma signal is characterized by phase and amplitude variations, as depicted in Fig. 4. A color bar displayed on the picture-tube screen has the properties of brightness, hue, and saturation. Brightness is determined by the amplitude of the Y signal (Fig. 3). Hue is determined by the phase of the chroma signal; saturation is determined by the amplitude of the chroma signal. The Y signal is the same as the monochrome camera signal. It appears at the output of the picture detector in a color receiver, and is commonly fed through the video and Y amplifiers to the cathodes of the color picture tube, as shown in Fig. 1. In some receivers, the Y amplifier may be fed to the center tap on the secondary of the chroma-demodulator transformer, as depicted in Fig. 2. The result is the same in either case.
(A) Screen pattern.
(B) Vector relationships.

Fig. 4. NTSC generator output.
The chroma signal also appears at the output of the picture detector; however, it is trapped out and does not pass through the Y amplifier. Instead, the chroma signal is fed to the chroma bandpass amplifier, and then to the chroma demodulators.
Although terminology differs, we often call the video-amplifier section past the delay line the Y amplifier, and the section prior to the delay line the video amplifier. Thus, the video section carries both Y and chroma signals, while the Y section carries the Y signal only. Chroma phases are measured with respect to the burst phase. Color-TV transmission is a quadrature system in which two phases, I and Q, of the subcarrier are modulated as shown in Fig. 5.
Although I and Q demodulation is possible, it is comparatively complicated, and practically all modern color receivers demodulate the chroma signal on axes other than the I and Q phases. This is possible because the I and Q signals have components on any axis that might be selected. Regardless of the demodulation axes that are used, every chroma demodulation system must produce output signals that have the R - Y, B - Y and G - Y phases, as depicted in Fig. 6A. These three signals are required for operation of the color picture tube. The R - Y signal is fed to the red grid, the B - Y signal to the blue grid, and the G - Y signal to the green grid.
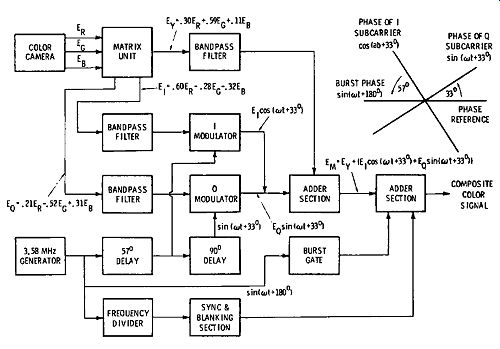
Fig. 5. Partial block diagram of color-TV transmitter.
CHROMA SIGNAL PROCESSING
In a basic chroma demodulation system, R - Y and B - Y DC modulators are used, and a chroma matrix is utilized to form the G - Y signal. The chroma matrix mixes the R - Y and B - Y signals in suitable polarities and amplitudes. Note in Fig. 2 that the chroma demodulators also operate as matrices; however, these are not chroma matrices, but RGB matrices. This simply means that the demodulators outputs are red, blue, and green signals, as depicted in Fig. 4. We also find X and Z demodulation axes in common use, as shown in Fig. 6B. After the X and Z demodulators, R, G, and B amplifiers are used; these amplifiers operate as matrices, and their outputs are R - Y, B - Y, and G - Y signals. Thus, the RGB terminology might be misleading in this case, and the beginner should carefully note the circuit action.

Fig. 6. Standard demodulation axes.
Some color receivers use an R - Y demodulator, a B - Y DC modulator, and a G - Y demodulator. Fig. 2 is a typical ex ample. It follows from Fig. 5 that an analogous color receiver will have a chroma demodulator with an input consisting of an I signal and a Q signal. There is a phase separation of 90 degrees between these two signals. The receiver will also have another chroma demodulator with the same I and Q signal input. The 3.58-MHz color subcarrier is also fed from the subcarrier oscillator into each of the chroma demodulators. However, the I demodulator operates with an injected subcarrier that has the I phase, and the Q demodulator operates with an injected sub carrier that has the Q phase. The I and Q signals are separated in the process of demodulation.
Waveform checks will show that injected 3.58-MHz subcarrier sine waves have comparatively large amplitudes; thus, the peak of the injected waveform drives the demodulator transistor (or semiconductor diodes) into conduction for a small interval of time. Thus, the demodulator transistor or diode is cut off most of the time, and conducts briefly at the peak of the subcarrier waveform. This is just another way of saying that the I and Q signals are sampled by the chroma demodulators.
Sampling serves to separate one of the chroma signals from its companion quadrature signal. With reference to Fig. 7, a summary of the principal chroma demodulator arrangements is presented. All of these systems employ the same circuit actions in various ways, and the result is the same for all.
The basic principle of chroma demodulation is seen in Fig. 8. There is a 90-degree phase difference between the I and Q signals. Therefore, when the I signal reaches its peak value, the Q signal is going through zero. Since the I demodulator is driven into conduction on the peak of the I signal, as shown at A by the heavy bar, only the I signal produces an output voltage during the conduction interval. Conversely, since the Q demodulator is driven into conduction on the peak of the Q signal, as shown. at A by the light bar, only the Q signal produces an output during the conduction interval. Thereby, the two chroma signals separate the I and Q signals by a sampling process. Note that the I signal might be positive during the sampling interval (B), or it might be negative during the sampling interval (D). Similarly, the Q signal might be positive (C), or it might be negative (E). This is called quadrature, or two-phase demodulation. It follows from Fig. 6A that if R - Y and B - Y demodulators are used, they operate as quadrature demodulators. However, X and Z demodulators are modified quadrature demodulators; as seen in Fig. 6B, the X and Z phases are separated by only 63.9 degrees. Complete separation of the X and Z phases is accomplished by sampling the X signal as the Z signal goes through zero, and sampling the Z signal as the X signal goes through zero. Normal operation of a chroma demodulator depends on adjusting the phase of the injected 3.58-MHz oscillator signal correctly, so that the desired signal is separated cleanly. This is done on the basis of waveform checks, as will be explained.
(A) Triple demodulator.
(B) R - Y /B - Y. tq R-Y/G-Y.
(D) Bootstrap.
(E) X/Z.
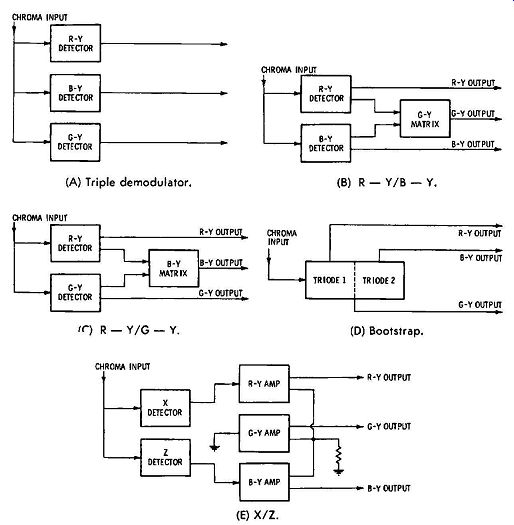
Fig. 7. Common demodulator systems.

Fig. 8. Sampling I and Q signals.
Let us consider the "phasing" of an R - Y and B - Y demodulator system. We apply simultaneous R - Y and B - Y test signals from a color-bar generator to the receiver; a scope is connected in turn at the demodulator outputs to check the wave form of the demodulated signal. Fig. 9 shows results of these tests. The demodulators should separate the R - Y and B - Y signals almost completely. If the demodulators are phased correctly, a single-bar (square-wave) signal is observed at each output. Incorrect adjustment results in the display of two bars (square waves), which may have various relative amplitudes, at the output of each demodulator. If we are checking an R - Y demodulator, the desired output waveform appears as shown in Fig. 9B. The waveforms in A and C represent incorrect phase adjustments.
A chroma matrix (Fig. 7) is checked in the same basic way as a chroma demodulator. That is, we apply a quadrature signal to the matrix, and check to see if a null pattern is displayed on the scope screen. Chroma demodulators and chroma matrices can also be checked by means of a keyed-rainbow signal.
A keyed-rainbow signal provides 10 chroma bars, and an eleventh bar that serves as a color burst. Each bar has a phase advance of 30 degrees. A keyed-rainbow waveform, and its corresponding bar pattern is shown in Fig. 10. An R - Y demodulator normally nulls on the sixth bar; a B - Y demodulator on the third and ninth bars; a G - Y demodulator or matrix normally nulls on the first and tenth bars. An I demodulator would normally null on the fifth bar, and a Q demodulator on the second and eighth bars.
(A) Incorrect; B - Y too positive. (B) Correct; B - Y nulled. (C) Incorrect; B - Y too negative.

Fig. 9. Nulling B - Y output.
In other words, if we apply a keyed-rainbow signal to a color receiver, the waveforms at the outputs of the various chroma channels normally display the nulls depicted in Fig. 11. Note that the chroma demodulators in Fig. 2 also operate as RGB matrices. Therefore, a definitive test is made by applying an NTSC color-bar signal to the receiver (Fig. 12). If there is no component defect present, the red bar is displayed on a scope at the output of the red demodulator with full amplitude.
The blue, green, and cyan bars are nulled. The yellow, magenta, and white bars also appear in the "square wave" with the red bar, as seen in Fig. 13. Next, if the scope is connected at the output of the green demodulator, we normally observe two "square waves," as shown in Fig. 13. When the scope is connected at the output of the blue demodulator, we normally see the broad "square wave" depicted in Fig. 13.
(A) Keyed rainbow signal. (B) Chroma phases or bar display.
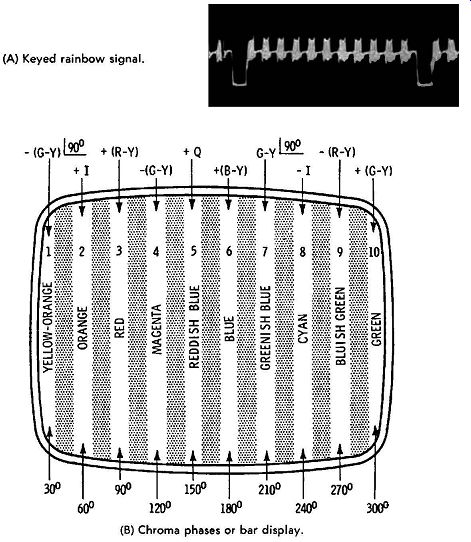
Fig. 10. Rainbow signal generator.
Some color bar generators provide one signal at a time, as illustrated in Fig. 14. It makes no difference whether we test with one signal at a time, or with a simultaneous multi-bar signal. In the case of a multibar signal, we merely count the bar intervals to locate a given chroma phase, or a given color signal. A keyed-rainbow generator supplies a multi-bar signal, as shown in Fig. 10A. Similarly, a simultaneous NTSC genera tor supplies a multibar signal, as depicted in Fig. 12. An NTSC generator commonly supplies color-difference signals in pairs, as shown in Fig. 15.
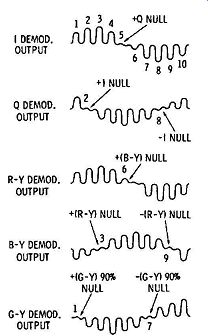
Fig. 11. Nulls of keyed rainbow signal.
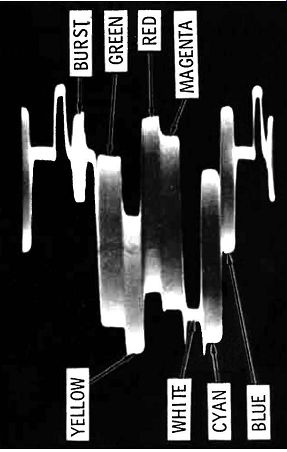
Fig. 12. The color signal from color-bar generator.

Fig. 13. Y component of NTSC signal.
(A) Y signal only. (B) Complete signal (Y and chroma).
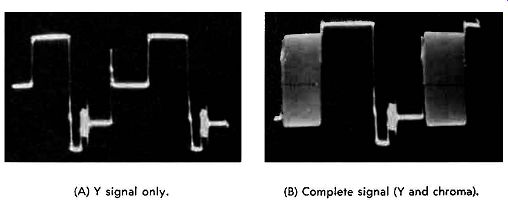
Fig. 14. Single-bar
NTSC output.
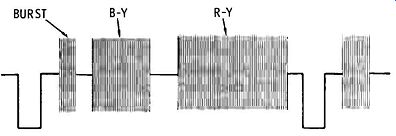
Fig. 15. R-Y/B-Y waveform supplied by NTSC generator.
The basic distinction between a keyed-rainbow generator and an NTSC generator iii seen in Figs. 8-10 and 8-12. In a keyed-rainbow generator, the chroma signals are all lined up at black level. That is, the keyed-rainbow generator provides color-difference signals only. On the other hand, in an NTSC generator, the chroma signals are placed on their respective monochrome (Y) levels to provide true and fully saturated primary and complementary colors. When an NTSC genera tor is set to supply color-difference signals (Fig. 15), the waveform is basically the same as provided by a keyed-rain bow generator. Most NTSC generators provide R - Y, B - Y, I, and Q signals. Some NTSC generators also provide quadrature G - Y signals.
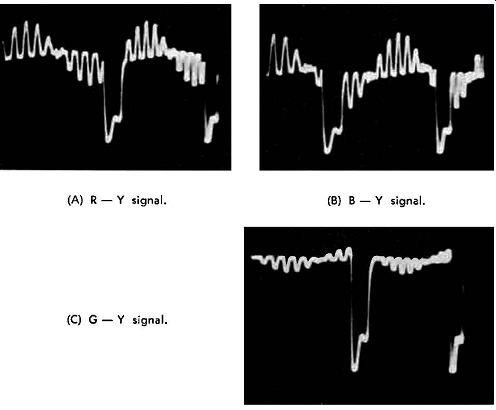
Fig. 16. Normal keyed-rainbow signals from R - Y, B, - Y, and G - Y circuits.
(A) R - Y signal. (B) B - Y signal. (C) G - Y signal.
A keyed-rainbow generator does not supply pure and saturated color signals. However, this is of no concern in practical servicing procedures, because we are concerned only with re produced waveforms such as those depicted in Fig. 11. These waveforms have been somewhat idealized for the sake of clarity. In actual practice, we analyze waveforms such as illustrated in Fig. 16. If you compare these waveforms with the diagrammatic representation in Fig. 11, you will observe that the same nulls are indicated. We analyze the foregoing waveforms in terms of their nulls, rather than their peaks, be cause a null is sharply defined in a scope pattern. On the other hand, the determination of maximum peak amplitude is usually less definite. As the receiver's chroma-phasing control is varied, the peak and null points shift in the waveforms of Fig. 16. At any control setting, we will find that the null indications are always quite definite.
The long pulse that extends downward in Fig. 16 is the retrace blanking pulse. In some receivers, the blanking pulse is comparatively wide, and tends to merge more or less with the first or the last chroma pulse. Sometimes, this can make it a bit difficult to "count bars." That is, we might not be certain where to start counting bars in the pattern. In such case, we can temporarily disable the blanking pulse at the input of the chroma section. Then, all 10 chroma pulses will be clearly displayed on the scope screen. Subcarrier phases in the chroma demodulator circuits are determined by R, C, and L components, as seen at the right-hand edge in Fig. 2. If incorrect nulls are observed, a defective component is indicated. Capacitors are the most common troublemakers.
CHROMA SYNC WAVEFORMS
Chroma sync action starts with the color burst. With reference to Fig. 2, the complete chroma signal is applied to the gated color-sync amplifier. This stage is also called a burst amplifier. Note that Q7 is gated by a pulse developed from the flyback pulse and the horizontal-sync pulse. In turn, this gating pulse is timed to coincide with the color burst (see Fig. 15). Therefore, Q7 in Fig. 2 conducts during the burst interval, and passes the color burst to the 3.58-MHz quartz crystal. The crystal is shock-excited by the burst, and rings continuously in phase with the burst signal. Since the crystal has a very high Q value, its ringing waveform decays very little from one burst to the next. Thereby, the color subcarrier is reconstituted.
However, since the output waveform from the crystal is not perfectly uniform, the crystal output is used to synchronize the locked oscillator Q8. The output from this color oscillator has a completely uniform amplitude. Next, to obtain a wide range for the chroma-phasing (hue) control, the output from the color oscillator is fed to phase splitter Q11. In turn, Q12 amplifies the color-subcarrier signal and feeds it to the R, G, and B demodulators. The color burst from a generator appears as seen in Fig. 14. If a triggered-sweep scope is used, the
burst can be expanded as illustrated in Fig. 17. This is not necessary in ordinary service procedures, and is done chiefly when adjusting a color-bar generator for optimum output waveforms.
(A) Ideal waveform. (B) Practical waveform.
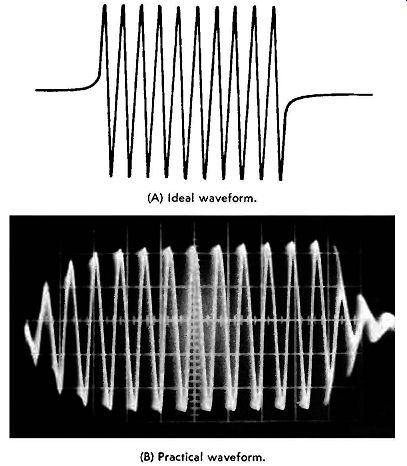
Fig. 17. Color burst waveforms.
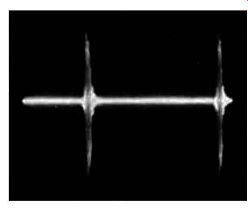
Fig. 18. Normal burst-amplifier output waveform.
The output waveform from the burst amplifier normally appears as illustrated in Fig. 18. We are concerned chiefly with the peak-to-peak voltage of the burst waveform when a normal signal input is applied to the color receiver. This value is specified in the receiver service data. Subnormal amplitude can be caused by a defect in the burst-gating circuit, such as a leaky capacitor; misalignment of tuned circuits in the signal channel can also be responsible. Misalignment is generally associated with poor picture quality, whereas defects in the burst-gating circuit impair color sync only.
FREQUENCY-RESPONSE CURVES
Details of chroma alignment procedure cannot be covered in this guide; however, interested readers may refer to alignment handbooks for procedural details. Receiver service data also provide the essential instructions. Frequency-response curves for chroma bandpass amplifiers vary considerably from one receiver to another. Therefore, alignment should not be at tempted without guidance from the receiver service data. A typical bandpass response curve is illustrated in Fig. 19. We are concerned with the frequencies at the ends of the top, the tilt of the top. ( if specified as uphill, downhill, or flat), and the shape of the skirts. When a tilt is specified, it is employed to compensate for rising or falling frequency response in a previous section of the signal channel.
The purpose of the bandpass specified for the curve is to accept most of the chroma sidebands, and to reject the low-frequency components of the Y signal. Of course, the high-frequency components of the Y signal are passed with the chroma sidebands. However, these Y signal components cancel out be ca use the chroma signal is frequency-interleaved with the Y signal. Details of this signal action are explained in books on the theory of color television. The Y amplifier has a frequency response that is approximately the inverse of the bandpass amplifier response. Fig. 20 shows a typical frequency-response curve for a Y amplifier. Note that the lower-frequency components of the Y signal are passed at high amplitude, while frequencies in the vicinity of the color subcarrier are attenuated. A subcarrier trap is provided at 3.58 MHz.
Y-amplifier response curves vary considerably from one receiver to another. In some cases, the subcarrier trap merely places a fairly deep notch in the curve, and does not reduce the response to zero at 3.58 MHz. Greater response is provided between the subcarrier trap and the sound trap than is seen in Fig. 20, in some cases. The amount of subcarrier trapping and high-frequency attenuation that is provided depends considerably on the amount of linearity developed by particular color picture tubes. If a tube is comparatively linear, more response at high video frequencies is permissible. In any case, beat interference between the chroma sidebands and the Y signal is held below a visible level. Beat interference has the form of color-picture "crawl." It also has the aspect of 920-kHz bars; that is, the difference between 3.58 MHz and 4.5 MHz (chroma and sound signals) is 920 kHz. Therefore, the sound signal must be extensively trapped.
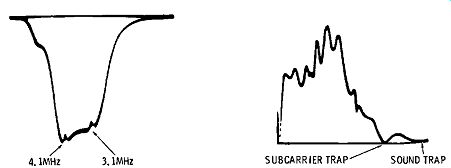
Fig. 19. Frequency-response curve for bandpass amplifier.

Fig. 20. Frequency-response curve for Y amplifier.
The waviness seen along the top of the Y-amplifier response curve in Fig. 20 is caused by residual resonances in the delay line. On a square-wave test, residual resonances tend to cause ringing. Delay lines vary considerably, and high-quality delay lines have very small residual resonances. In such cases, the top of the Y-amplifier response curve is practically as smooth as the top of the video-amplifier response curve. Since the majority of service shops do not have video-frequency sweep generators available, the Y-amplifier response curve is not usually checked. However, most sweep generators can sweep a band pass amplifier over the 2.5 to 4.5 MHz range, and alignment of bandpass amplifiers is commonly checked.
OTHER COLOR RECEIVER WAVEFORMS
Transistor color-TV receivers also have dynamic convergence waveforms that are absent in monochrome receivers.
These convergence waveforms are merely noted here and are specified for particular receivers in the pertinent service data.
These waveforms are analyzed in case the dynamic convergence controls lack sufficient range, or are otherwise ineffective in obtaining satisfactory convergence of the color picture tube.
Convergence procedure is somewhat involved, and requires both study and experience. Interested readers may consult specialized color-TV servicing books for detailed explanations.
QUIZ
1. Name the principal sections in a transistor color-TV receiver that are not present in a monochrome receiver.
2. What is the function of the chroma bandpass amplifier?
3. Describe the function of a chroma demodulator.
4. How does a color-killer operate?
5. Explain the purpose of an automatic chroma-control circuit.
6. Discuss the composition of an NTSC color-bar signal.
7. Why is a color burst required in the complete color signal?
8. State the electrical characteristics that correspond to brightness, hue, and saturation.
9. Define the Y signal.
10. Give an example of quadrature chroma signals.
11. Name the three color-difference signals that are applied to the color picture tube.
12. What is the function of a chroma matrix?
13. Describe the sampling process in chroma demodulation.
14·. Define a null in a chroma waveform.
15. Explain the characteristics of a keyed-rainbow signal.
16. What is the distinction between an NTSC signal and a keyed-rainbow signal?
17. Why is a burst amplifier gated?
18. How does misalignment affect the output waveform from the burst amplifier?
19. State the approximate passband of a chroma bandpass amplifier.
20. Describe the function of a chroma bandpass amplifier.
21. What are the chief characteristics of a Y-amplifier response curve?
22. How is the color subcarrier reconstituted in a color receiver?
23. Explain how a quartz crystal is activated by a succession of color bursts.
24. Discuss the phasing of the injected subcarrier in the chroma demodulators.
25. What type of scope is required to expand a color burst?