Oscilloscopes are not difficult to operate, although they do have a large number of controls. Even the simplest scopes (Fig. 2-1A) have about a dozen knobs and switches. Note that oscilloscope controls are generally grouped as shown in Fig. 2-1B. Of course, even the names of the groups or control zones may be puzzling to the apprentice technician. However, if the action of each control or switch is taken step by step, the instrument soon loses its mystery. Most service scopes are ac operated and hence have a power cord which must be plugged into a 117-volt, 60-Hz outlet.
To turn the scope on, set the power switch to its "on" position.
This switch may be an individual control, or it may be combined with an operating control-usually the intensity control. In this case, the control is turned from its "off" position to the right, just as a radio or television receiver is turned on. When power is applied to the scope circuits, a pilot lamp glows or, in some cases, an edge-lighted graticule is illuminated (Fig. 2-2).
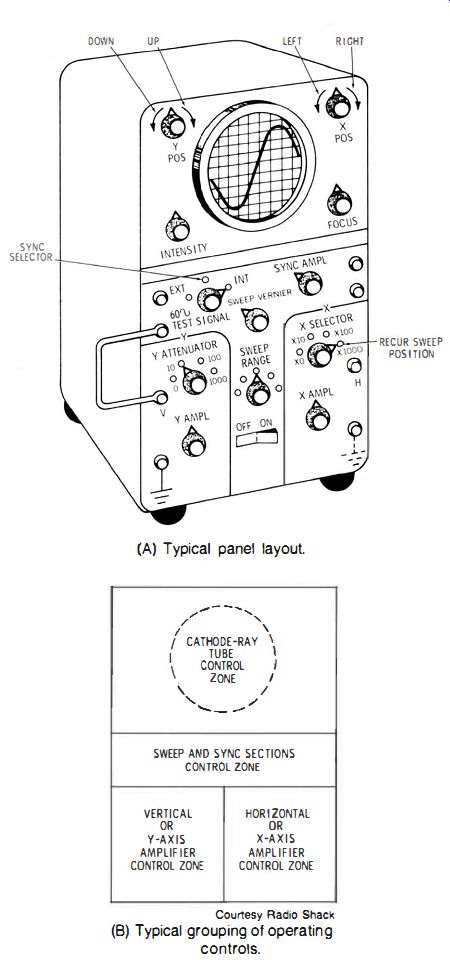
Fig. 2-1 A simple oscilloscope. (A) Typical panel layout. (B) Typical grouping
of operating controls.
INTENSITY· CONTROL ADJUSTMENT
After a brief warm-up period, a spot or line may appear on the screen. If not, turn up the intensity control. Do not advance it more than is necessary, however, because the screen of the cathode-ray tube can be burned, particularly if the electron beam is forming a small spot on the screen.
If a spot or a line does not appear when the intensity control is turned up, either the horizontal- or vertical-centering control may be at the extreme end of its range. This can throw the spot or line off-screen. Therefore, begin the operating procedure by adjusting each centering control to its midrange.
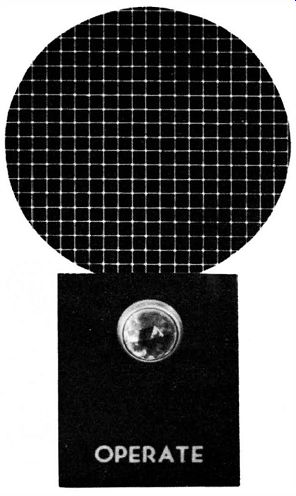
Fig. 2-2. Some scopes have illuminated graticules; most have simple pilot
lamps.
CENTERING-CONTROL ADJUSTMENT
The action of the centering controls is seen in Fig. 2-3. The spot moves up and down as the vertical-centering control is rotated back and forth. Similarly, the spot moves left and right as the horizontal
centering control is rotated back and forth. In theory, any desired pattern could be traced out on the screen by turning the centering controls. This is a simple manual analogy to the pattern development which takes place automatically when the electronic circuits of a scope are energized.
In practice, of course, patterns are not traced out in this manner.
The centering controls are set to position the beam on the screen, and are not readjusted unless particular test conditions make this desirable. Some types of patterns may not appear centered on the screen unless the centering controls are readjusted, for reasons that will be explained later.
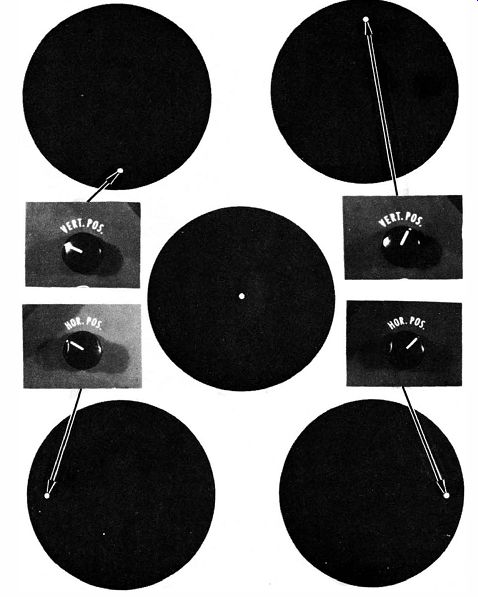
Fig. 2-3. Action of positioning (centering) controls.
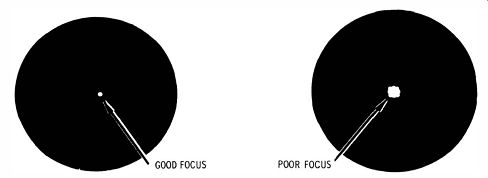
Fig. 2-4. Action of focus control.
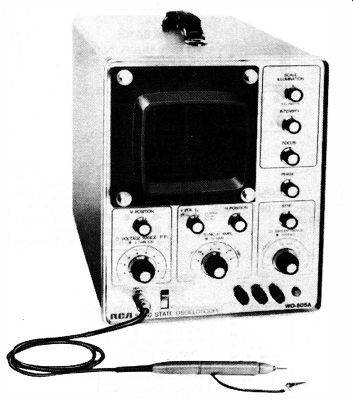
Fig. 2-5. A high-performance service-type oscilloscope.
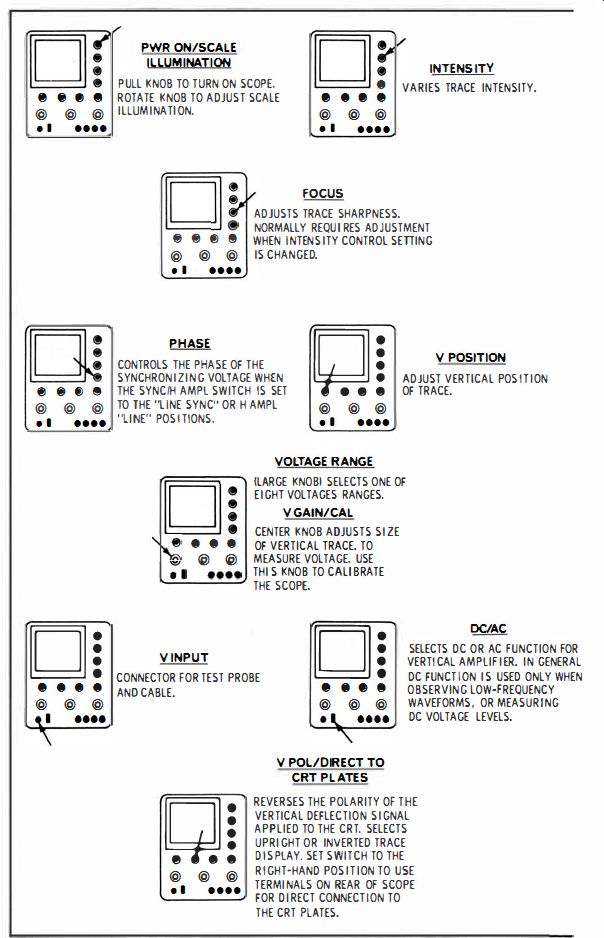
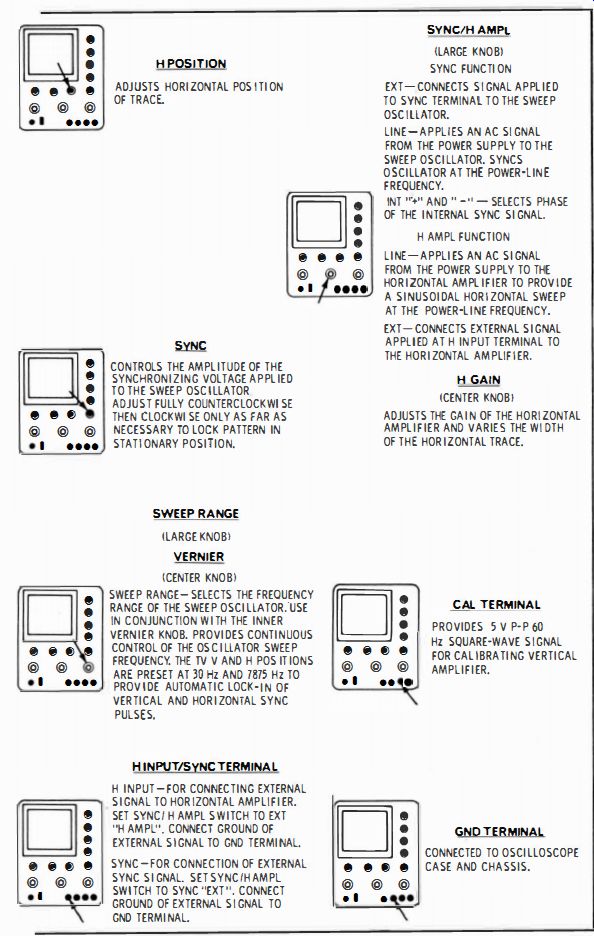
Table 2-1. Control Functions and Terminal Facilities
FOCUS-CONTROL ADJUSTMENT
Fig. 2-4 shows how the appearance of a spot changes on the scope screen as the focus control is turned. The focus control is adjusted for the smallest spot possible. In most scopes, the intensity and focus controls interact. Therefore, the focus control may need to be readjusted if the intensity-control setting is changed.
With this brief general introduction, it is helpful to observe the control functions and terminal facilities for a high-performance service-type oscilloscope, such as the one illustrated in Fig. 2-5. Fourteen controls are provided, three of which are concentric. Each control is identified in Table 2- 1, and its function is briefly explained. If you are unfamiliar with some of the technical terms, their meaning will become clear further along in this SECTION.
APPLICATION OF A 60·HERTZ AC TEST VOLTAGE
All scopes have some provision for the application of a vertical input signal. If a 60-Hz test voltage is applied to the vertical-input terminals, a sine-wave pattern can be displayed on the scope screen (See Fig. 2-1A.) A suitable test voltage can be obtained by connecting the vertical-input terminals between the heater line and ground in a radio or tv receiver. Many scopes have a 60-Hz test-voltage terminal on the front panel, as in Fig. 2-1A. A lead can be connected from the vertical-input terminal to the test-voltage terminal.
A sine-wave pattern may or may not appear when the test voltage is applied. This depends on the setting of certain operating controls.
For example, if the horizontal-deflection rate is incorrect, only a blur may be displayed, as in Fig. 2-6. Practically all scopes have a coarse and a fine (vernier) sawtooth frequency control. The coarse control is a rotary step switch; the vernier control is a potentiometer. The two are also called the sweep-range or horizontal control and the frequency-vernier control (Fig. 2-7).
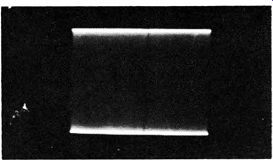
Fig. 2-6. Waveform appears as a blur on the screen when horizontal-sweep rate
is too high.
Set the step control to a position which includes 60 Hz (in Fig. 2-7 this is the 10-100 position). Adjustment of the continuous control "fills in" the step and permits the sawtooth oscillator to operate at 60 Hz. Rotate the control to see whether a single-cycle display appears on the screen. Possibly no other adjustments will be required, and a pattern as detailed in Fig. 2-8 may appear. Note that the displayed cycle is not quite complete. A small portion is "lost" on retrace because the sawtooth deflection voltage does not drop to zero instantly during retrace time. The lost portion of the display is often seen as a visible retrace line in the pattern (Fig. 2-8). At this point, the required adjustment of the vernier sawtooth control may be quite critical. Perhaps the single-cycle display can be stopped only for an instant. Then it "breaks sync," and a blurred pattern reappears. On the other hand, the pattern may lock tightly, but appear broken into fragments. The first difficulty is due to the sync control being set too low. The second difficulty is caused by the sync control being set too high (Fig. 2-9). In either case, the pattern is locked improperly by the sync control. The proper method for adjusting the sync control is to advance the control sufficiently to lock the pattern, but not so far that operation of the sawtooth oscillator is disturbed. Note that scopes such as depicted in Fig. 2-7 provide automatic sync action.
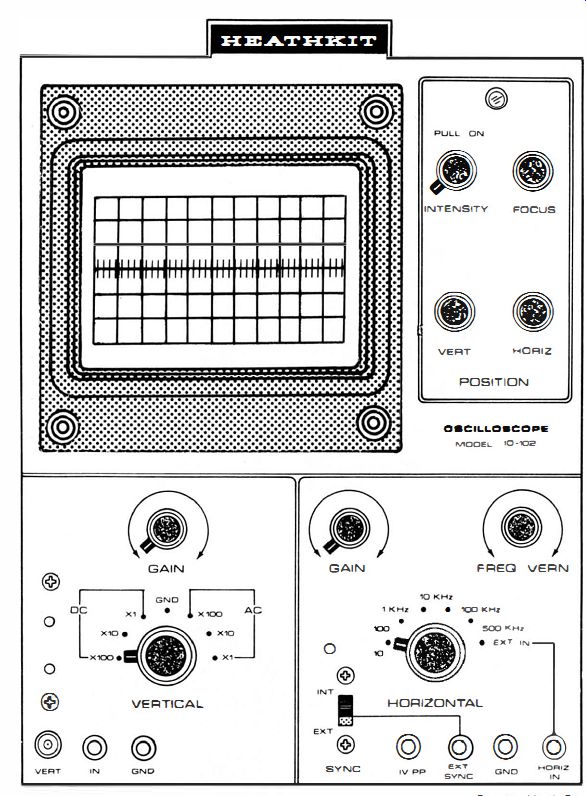
Fig. 2-7. Operating controls.
A pattern like the one illustrated in Fig. 2-10 is sometimes confusing. Such a pattern is displayed when the sweep frequency is set to twice the signal frequency. For example, if the signal frequency is 60 Hz, the pattern shown in Fig. 2-10 is obtained when the sweep frequency is set to 120 Hz. On the other hand, when the sweep frequency is set to one-half of the signal frequency, two cycles of the signal will be displayed, minus a small portion of the waveform that is lost on retrace. (See Fig. 2-11.)
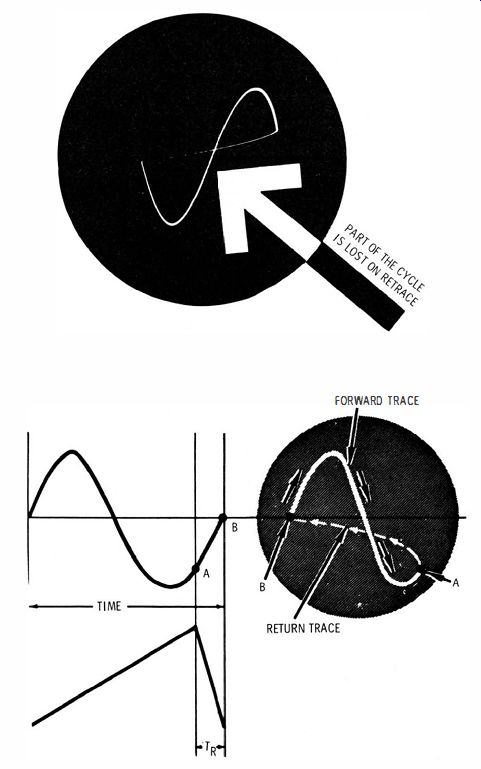
Fig. 2-8. Detail of a single-cycle display.
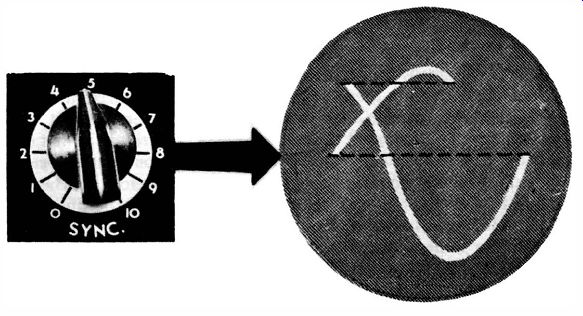
Fig. 2-9. Sync control is advanced too far.
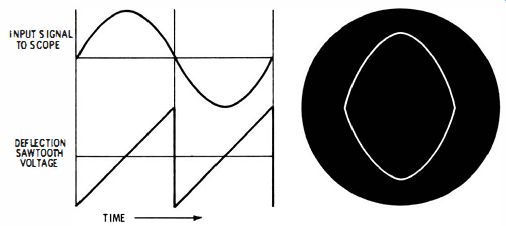
Fig. 2-10. Display of sine wave when the sweep frequency is double the signal
frequency.
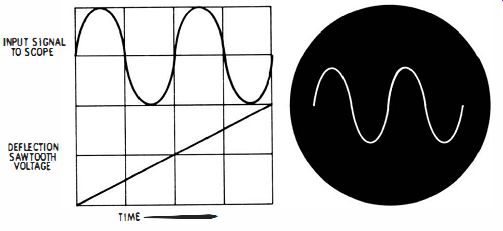
Fig. 2-11. Display of sine wave when the sweep frequency is one-half the signal
frequency.
PATTERN SIZE VERSUS INTENSITY CONTROL SETTING
Now that a sine-wave pattern is displayed on the screen, the trace appears much dimmer than the former small spot or horizontal line.
If the sine-wave pattern fills most of the screen vertically, it will appear quite dim compared with a simple spot. The reason is that the electron beam has a much longer path to trace out; consequently, each point along the trace receives much less energy. Therefore, it is necessary to turn up the intensity control in order to make the sine-wave pattern more clearly visible. However, this usually changes the focus also, and in some scopes, the pattern tends to "bloom." This is the same reaction that occurs in many tv pictures when the brightness control is turned too high.
If the brightness of the pattern is not satisfactory, check the ambient light in the shop. High-level illumination from a window may be "washing out" the display. Move the scope, or place a light hood around the scope screen.
Some scopes have brighter patterns (in good focus) than other scopes do. Pattern brightness depends on the amount of voltage applied to the accelerating anode. For example, if the accelerating voltage is increased from 1 kV to 2 kV the available pattern brightness will be greatly increased. However, increasing the accelerating voltage also increases the energy content of the electron beam. Thus, more energy is required in the scope's vertical- and horizontal-deflection systems in order to move the beam a given distance on the face of the crt. The net result of increasing the accelerating voltage, then, is increased pattern brightness along with an apparent reduction in the scope's vertical and horizontal gain (sensitivity). In most service scopes, therefore, a compromise has to be made between pattern brightness, deflection sensitivity, and cost.
A sine-wave pattern (or any other pattern) can be shifted vertically and horizontally on the screen by adjusting the centering controls, as was discussed previously in the cases of the spot and the line. As the scope warms up, the sine-wave pattern may drift vertically, horizontally, or both. In that case, readjust the centering controls as required.
GAIN CONTROLS
Vertical
Another difficulty may arise at this point. Perhaps the pattern locks satisfactorily, but vertical deflection is insufficient or excessive (Fig. 2- 12). The vertical-gain control no doubt is set incorrectly. It is adjusted normally for a pattern height of approximately three-fourths of full screen.
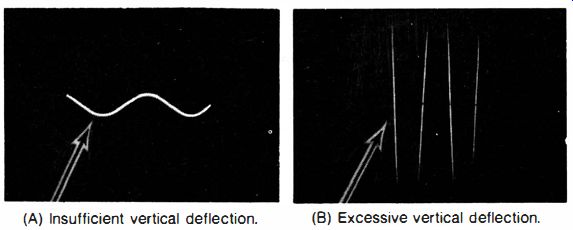
Fig. 2- 12. Vertical-gain control effect. (A) Insufficient vertical deflection.
(B) Excessive vertical deflection.
Although the simplest scopes have a single vertical-gain control, most scopes have both step and vernier controls. The step control shown in Fig. 2-7 has three positions. If the input voltage is comparatively high, the step control is set to a lower position, and vice versa.
Other step gain controls may have four or more positions. They permit application of a wide range of input voltages, without overloading the vertical amplifier in the scope.
All oscilloscopes have vertical amplifiers. An amplifier is necessary because a cathode-ray tube is comparatively insensitive, and requires approximately 300 volts for adequate deflection. Because it is often necessary to investigate signal voltages as low as .02 volt, a high-gain vertical amplifier is required in practical work.
In the simplest scopes, the vertical-gain control is a potentiometer.
This type of control is satisfactory only for low-frequency operation.
A simple potentiometer control distorts a high-frequency waveform because of its stray capacitances. These are indicated in Fig. 2-13.
Stray capacitance C1 is not of practical concern here, for high frequency response is limited by stray capacitances C2, C3, C4, and CS. These act as small bypass capacitors within and around the gain control, and have more or less of a shunting action on high-frequency input signals.
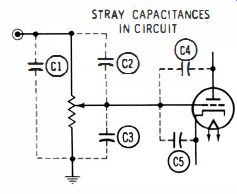
Fig. 2-13. Potentiometer gain control.
This difficulty could be avoided if a low-resistance potentiometer such as 10 ohms) could be used. This is not practical, however, because an input resistance of 10 ohms would cause serious loading in most electronic circuits under test. Ohm's law applies to ac voltages just as it does to dc voltages. If the input resistance is low, the scope connection will draw a heavy current from the circuit under test, resulting in disturbed circuit action and, in turn, distorted waveforms.
For these reasons, the input resistance of a scope must be high. A typical value is 1 megohm. Suppose, however, that a simple potentiometer gain control (as in Fig. 2-13) had a resistance of 1 megohm.
In that case, stray capacitances C2, C3, C4, and C5 would have excessive bypassing action at high frequencies.
Undistorted waveforms would be passed only if the gain control were set to maximum.
At a reduced setting, more or less bypassing action would take place and cause progressive distortion of the waveform. Therefore, a more elaborate gain-control configuration is required for controlling signal voltages at frequencies other than the power frequency.
Step Gain
An interesting principle of circuit action makes possible a gain control configuration having both high input resistance and distortionless attenuation. At low frequencies, these requirements are met by a resistive voltage divider, and at high frequencies, by a capacitive voltage divider (Fig. 2-14). The resistive divider distorts high frequencies, and the capacitive divider distorts low frequencies. However, when the two configurations are combined, as in Fig. 2-15, all frequencies are passed without distortion. Trimmer capacitors C2 and C3 are used to balance the high- and low-frequency response. These capacitors are maintenance adjustments, and are located inside the scope case.

Fig. 2-14. Voltage dividers for low and high frequencies.
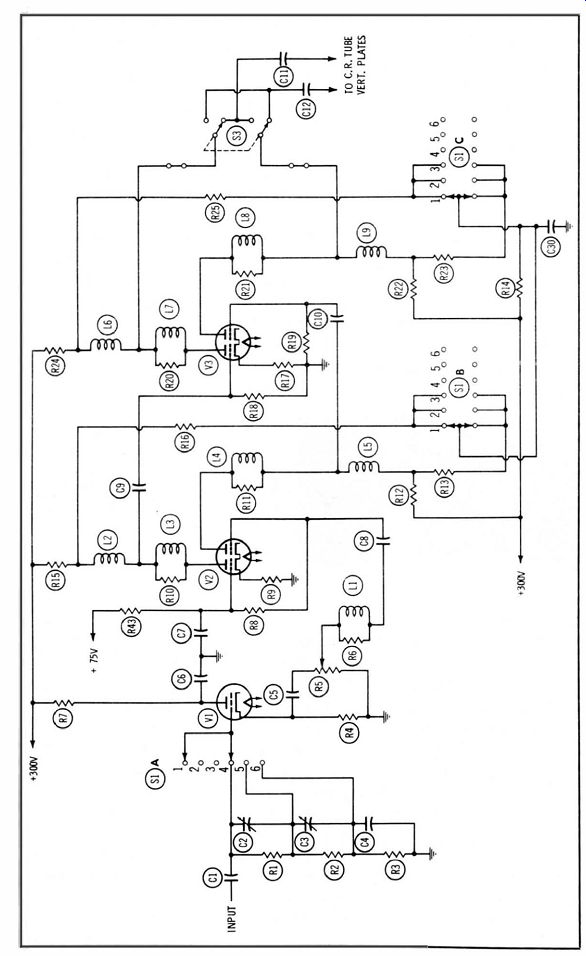
Fig. 2-15. Typical vertical-amplifier circuit.
The step attenuator in Fig. 2-15 has three positions. The input signal is applied across series resistors R1, R2, and R3 (Fig. 2-15). The input resistance is 1.5 megohms for any of the three steps. When the step attenuator is set to a tap on the divider network, the output signal is reduced. Thus, cathode follower V1 is not overloaded, even though the input signal may be quite high. The step attenuator is merely set to a lower position.
The continuous (vernier) vertical-gain control (R5) is in the cathode circuit of V1. Because of its comparatively low resistance, good high-frequency response is obtained for all positions of the control.
Furthermore, a cathode follower is an electronic impedance transformer. It matches a high input impedance to a low output impedance. To summarize, the overall action of the input system provides high input resistance, accommodates a wide range of input signals, and permits the pat tern to be adjusted to any desired height on the scope screen.
The vertical amplifier, V2 and V3, is a push-pull configuration.
Here, the proper settings of step- and vernier-gain controls are of prime importance. In many scopes which have both of these controls, incorrect gain settings will overload the cathode follower and cause the waveform to be clipped (Fig. 2- 16). This means that the step attenuator has been set too high, and the vernier attenuator too low.
Distort ion is corrected by lowering the setting of the step control, and advancing the setting of the vernier control. Clipping is a distortion which can be quite confusing if it is not understood.
Horizontal
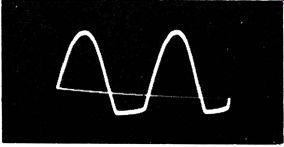
Fig. 2-16. Sine wave clipped by overloading.
Although vertical deflection is satisfactory, the pattern may be excessively compressed or expanded horizontally (Fig. 2-17). The horizontal-gain control must be adjusted. Less elaborate scopes have a simple potentiometer-type horizontal-gain control only; others have both step- and continuous-gain controls. In most cases, the horizontal-step control is merely a resistive divider network. However, a few service scopes have the same type of compensated step control used in the vertical section. These scopes are somewhat more expensive.
For most test work, good high-frequency response in the horizontal section is not needed. Therefore, the horizontal amplifier circuit is often simpler than the vertical. A typical horizontal-input and -amplifier circuit is shown in Fig. 2-18. The horizontal-input step attenuator has two positions. A vernier horizontal-gain control is in the cathode circuit of the cathode follower. The output of the cathode follower is coupled to a paraphase amplifier, which changes a single-ended input into a double-ended output.
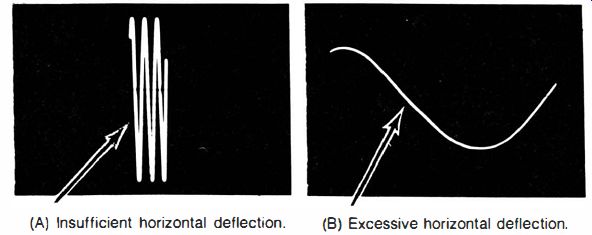
Fig. 2-17. Horizontal-gain control effect. (A) Insufficient horizontal deflection.
(B) Excessive horizontal deflection.
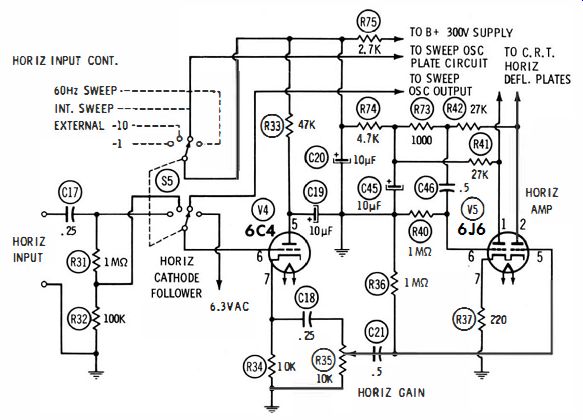
Fig. 2-18. Typical horizontal-amplifier circuit.
FREQUENCY CONTROL
When using the oscilloscope, it is customary to display two cycles of the signal on the cathode-ray tube screen. This is done by adjustment of the sawtooth-frequency control. Consider, for example, a 6O-Hz signal. When the sawtooth-frequency control is adjusted to 30 Hz, the signal goes through two excursions during one trace interval, and two cycles of the signal are displayed. Similarly, when the sawtooth frequency is adjusted to 20 Hz, three cycles of the signal are displayed.
A typical sawtooth oscillator is shown in Fig. 2-19. This is a free running oscillator which feeds a sawtooth voltage to the horizontal amplifier. The step frequency control is used to select a pair of capacitors ranging in value from 80 pF to 0.25 uF. Higher values of capacitance provide a lower sawtooth frequency. The vernier frequency control is a pair of ganged potentiometers. Higher values of resistance provide a lower sawtooth frequency. The vernier control is used to "fill in" between the various positions of the step control. The sawtooth frequency can be adjusted from 10 Hz to 100 kHz.
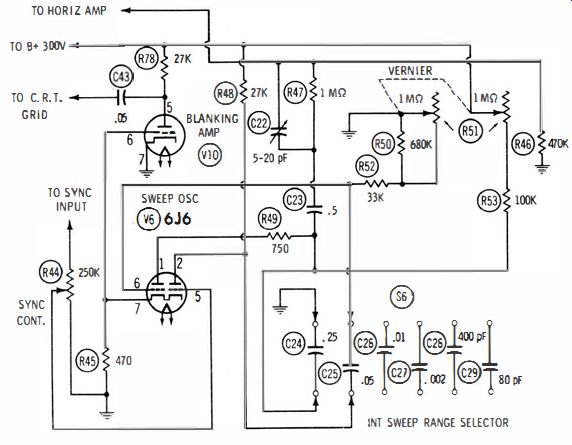
Fig. 2-19. Typical sawtooth-sweep oscillator and blanking amplifier.
RETRACE BLANKING
Blanking amplifier V10 in Fig. 2- 19 eliminates the retrace line in pattern displays. During retrace time, a positive pulse voltage is generated across resistor R45. This pulse voltage is fed to the grid of the blanking-amplifier tube, amplified, and reversed in polarity. This negative impulse is applied to the grid of the cathode-ray tube, cutting the tube off during the retrace interval. For example, the pattern shown in Fig. 2-16 has a visible retrace, while the pattern in Fig. 2-12 does not.
HORIZONTAL NONLINEARITY
Sometimes horizontal deflection is nonlinear. The pattern appears cramped at one end and expanded at the other end (Fig. 2-20A). This trouble can be caused by a weak tube in the horizontal-amplifier or the sawtooth-oscillator section, by low plate-supply voltage to either section, or by defective capacitors, particularly coupling capacitors.
In Fig. 2-19, C22 is a maintenance control which is set for best horizontal linearity.
Amplifier linearity can be checked by applying a 60-Hz voltage to both the horizontal- and vertical-input terminals of the scope. The horizontal-function switch is then set to a horizontal-input position either "low" or "high" as required to accommodate the input voltage level. The vertical- and horizontal-gain controls are then adjusted to obtain about three-fourths of full-screen deflection. In the ideal situation, a perfectly straight diagonal line appears on the screen. However, nonlinearity in either the vertical or horizontal amplifier, or both, results in a curved diagonal trace. (Fig. 2-20B).
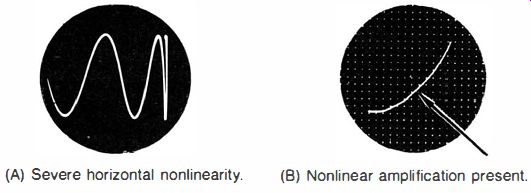
Fig. 2-20. Horizontal nonlinearity. (A) Severe horizontal nonlinearity. (B)
Nonlinear amplification present.
CALIBRATION AND PEAK-TO-PEAK VOLTAGE MEASUREMENTS
An oscilloscope is a voltmeter which displays instantaneous, peak, and peak-to-peak voltages. It also displays the rms values of some waveforms. The meaning of instantaneous values is evident in Fig. 2-2 1. Each dot in the sine-wave pattern represents a particular instantaneous voltage. This is, in practice, a form of time calibration, which will be explained in more detail later. It is pertinent to note here, however, that certain instantaneous voltages have the specific designations of positive peak voltage, negative peak voltage, and peak-to peak voltage. (Fig. 2-22). Peak-to-peak voltages are specified in receiver service data. They are usually measured on the scope screen, although a peak-to-peak vtvm can be used if the impedance of the circuit under test is not too high. (A vtvm loads a circuit more than a scope does.) To calibrate a scope for peak-to-peak voltage measurements, its sensitivity for the chosen setting of the vertical-gain controls is determined. A known peak-to-peak voltage is applied to the vertical-input terminals of the scope, and the resulting number of divisions is noted for deflection along the vertical axis. Thus, if a 1-volt peak-to-peak signal is applied to the scope and 10 divisions of vertical deflection are observed, the vertical-gain controls are set for a sensitivity of 0.1 volt peak to peak per division.
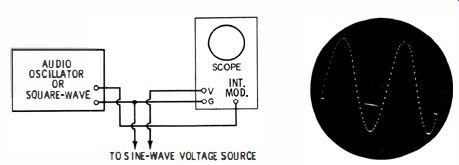
Fig. 2-21. Instantaneous voltages "marked" and timed by intensity
modulation of the scope.
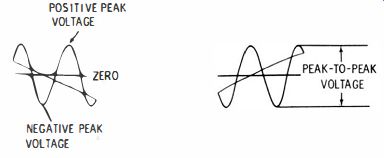
Fig. 2-22. Meaning of positive-peak, negative-peak, and peak-to-peak voltages.
Many scopes have provision for applying a known peak-to-peak voltage to the vertical amplifier. Three examples were illustrated in Fig. 2- 1A, Table 2- 1, and Fig. 2-7. In Fig. 2- 1A, a binding post provides a I-volt peak-to-peak source. In Table 2- 1, the last entry depicts a calibration terminal which provides a s-volt Pop square wave for calibrating the vertical amplifier. In Fig. 2-7, a calibration terminal is provided which supplies a 1-volt Pop sine wave. There is no basic distinction between a square-wave and a sine-wave p-p calibrating voltage. It may be noted that the more elaborate scopes generally provide a square-wave calibrating voltage.
Consider the voltage from an ordinary heater string. It has an rms value of 6.3 volts. Because it is a sine-wave voltage, its peak-to-peak value is found by multiplying 6.3 by 2.83. Therefore, 6.3 volts rms has an amplitude of 17.8 volts peak to peak, which is usually rounded off to 18 volts peak to peak in practical work. Thus, if the vertical input of the scope is connected to a heater line, an 18-volt peak-to peak voltage is being applied to the vertical amplifier.
Consider an arbitrary calibration voltage, such as 12 volts peak to peak, being applied to the vertical-input terminals. If the vertical-gain controls are adjusted to make the voltage waveform extend over 12 divisions vertically (Fig. 2-23), the scope will be calibrated for I volt peak to peak per division. In turn, each major division on the graticule marks off 5 volts peak to peak. In this manner, a scope is calibrated easily for any convenient source of peak-to-peak voltage. Note carefully, however, that a service-type vom reads the rms voltage of sine waves. The peak-to-peak voltage of a sine wave is 2.83 times the rms reading.
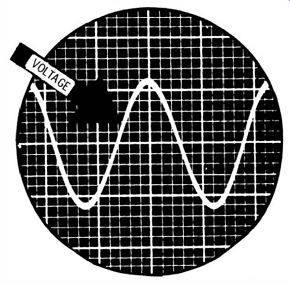
Fig. 2-23. A vertical excursion of 12 divisions.
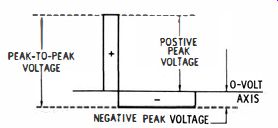
Fig. 2-24. Pulse-waveform voltages.

Fig. 2-25. These waveforms have the same peak-to-peak voltages, but their
rms values are different.
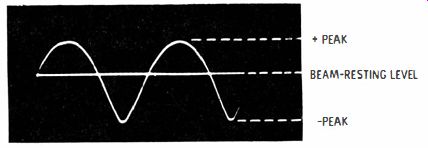
Fig. 2-26. The beam-resting level of a scope shows the positive and negative
portions of a waveform.
COMPLEX WAVEFORMS
Although a sine wave is symmetrical, most waveforms encountered in electronic test work are unsymmetrical. A pulse waveform, such as the one shown in Fig. 2-24 is unsymmetrical and, in turn, has a positive peak voltage which is not the same as its negative peak voltage. Nevertheless, once a scope has been calibrated with a sine wave, peak-to-peak voltages of complex waveforms can also be measured on the screen.
A square waveform is a complex symmetrical waveform, and its voltage is measured in peak-to-peak values. Fig. 2-25 shows a square wave which has the same peak-to-peak voltage as the sine wave illustrated; however, the rms voltage of the square wave is different from that of the sine wave. Note carefully that service-type vom's respond differently to these two waveforms, even though they have the same peak-to-peak voltage. A vom indicates the true rms voltage of the sine wave, but does not indicate correctly when a square wave is measured.
A peak-to-peak reading vtvm indicates, of course, the true peak-to peak voltage of any type of waveform.
Once the sensitivity of a scope is adjusted for a certain number of volts per division, peak voltages can be measured as easily as peak-to peak voltages. An example is seen in Fig. 2-26. With no input signal, the scope displays only a horizontal trace. This is the beam-resting, or zero-volt, level. When a complex waveform is displayed, it appears partly above the zero-volt level and partly below. The number of divisions from the zero-volt level to the positive peak of the waveform indicates its positive peak voltage. Likewise, the number of divisions from the zero-volt level to the negative peak indicates its negative peak voltage. Peak voltages are measured in the same units as peak-to-peak voltages.
STEP ATTENUATORS
Step attenuators are usually decade devices. They attenuate a signal voltage by 0.1, 0.01, or 0.001. Conventional step markings are X1, X10, X100, and X1000. Decade attenuation facilitates measurement of peak-to-peak voltages. For example, suppose that the vertical step attenuator is set to the X10 position and the vernier attenuator is adjusted to provide a sensitivity of 1 volt peak to peak per division.
If a waveform voltage is applied to the vertical-input terminals and the pattern is off-screen at top and bottom, it is a simple matter to turn the step attenuator to the X100 position. This brings the pattern within screen limits, and changes the sensitivity to 10 volts peak to peak per division.
If the applied waveform voltage does not produce sufficient vertical deflection, the step attenuator can be turned to the X1 position. This increases the pattern height ten times, and changes the sensitivity to 0.1 volt peak to peak per division. In summary, adjustment of the vertical step attenuator does not change the basic calibration of the scope. However, such adjustment makes possible quick measurement of peak-to-peak voltages over a wide range from a single calibration.
A triggered-sweep oscilloscope generally has an inherently calibrated vertical amplifier with a vertical step attenuator which indicates peak-to-peak voltages per division. Fig. 2-27 shows a typical vertical step attenuator for this kind of scope. Thirteen steps are provided in this example, with peak-to-peak voltage range from 0.05 to 500 volts per division. Note that these values usually apply to waveforms obtained with a direct probe. On the other hand, some scopes indicate peak-to-peak voltages of waveforms obtained with a low-capacitance probe. If a scope is calibrated for use with a direct probe, the indicated values must be multiplied by 10 when the scope is used with a standard low-capacitance probe (with a 10-to-1 attenuation factor). Low capacitance probes are explained in greater detail in SECTION 3.
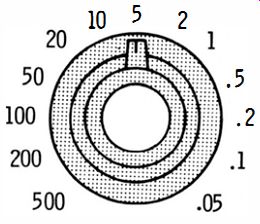
Fig. 2-27. Example of a step attenuator that indicates peak·to·peak voltages.
DC VERSUS PEAK·TO·PEAK VOLTS
Many technicians use dc scopes. A dc scope has a low-frequency response down to zero frequency, or dc. On the other hand, an ac scope has some definite low-frequency limit, such as 20 Hz. The typical response of a dc scope is illustrated in Fig. 2-28. If a 10-volt battery, for example, is connected to the vertical-input terminals, a positive polarity deflects the beam upward, and it remains deflected until the dc voltage is removed. Similarly, when the terminal polarity is reversed, the beam is deflected downward from its resting position by the same amount it was deflected upward.
What is the relationship between dc deflection and peak-to-peak ac deflection? The two deflections are the same. In other words, if the beam deflects by the amount shown in Fig. 2-28 for an input of + 10 volts dc, it will deflect by the same amount for a 10-volt peak-to-peak ac input. Hence, a dc scope can be calibrated either with a dc or an ac voltage source.
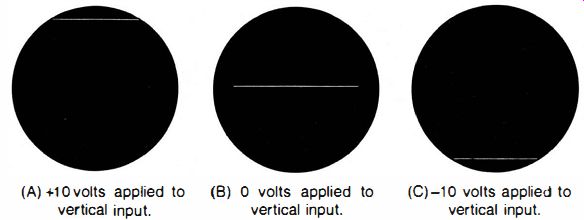
Fig. 2-28. Response of a dc scope. (A) +10 volts applied to (B) 0 volts
applied to vertical input. vertical input. (C)-10 volts applied to vertical
input.
Many waveforms in electronic circuits consist of an ac voltage with a dc voltage component. The output from a video detector, the signal across a cathode resistor, and the signal at the collector of a transistor are examples. When such voltages are applied to a dc scope, the response takes place as shown in Fig. 2-29. The beam level rises (or falls) from its resting position in correspondence with the dc component. The ac waveform is displayed on the dc level.
All dc scopes have switching facilities for changing from dc to ac response. Thus, in Fig. 2-29, if the scope is switched to ac response, the ac waveform is unchanged, but it drops and is centered on the zero-volt level. In other words. the dc component is removed during ac operation. Changeover from dc to ac response is accomplished by switching a series blocking capacitor into the vertical-input circuit.
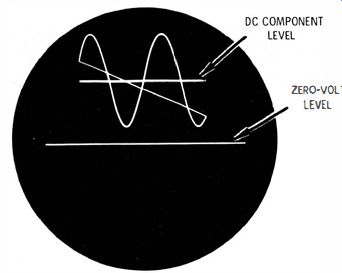
Fig. 2-29. Response of a dc scope to ac voltage with a dc component.
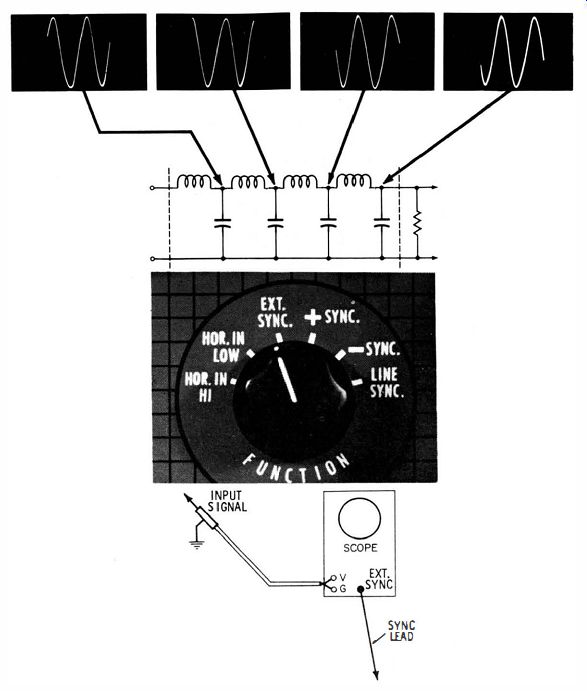
Fig. 2-30. External sync is used when checking out a generator delay line.
SYNC Function
External
Most scope tests are made with the pattern locked by internal sync.
That is, the synchronizing voltage is obtained internally from the input signal voltage. For some tests, a sync voltage separate from the signal voltage is required. The signal voltage characteristics may be unsuitable for locking the pattern, or circuit phases may be of interest.
For example, when the composite video signal is displayed on 60- or 30-Hz deflection, it is often found difficult (and sometimes impossible) to lock the pattern on internal sync. This occurs because the horizontal sync pulses are as large as the vertical sync pulses, and the scope's sync circuits are not able to separate the vertical from the horizontal pulses.
In this situation, the pattern can be locked tightly by setting the selector switch to the "Ext. Sync" position and connecting a lead from the external sync terminal to a 60-Hz source, such as the vertical blocking-oscillator circuit. Another often satisfactory solution is to set the selector switch to the "Line Sync" position. This locks the sync circuits to the 60-Hz power-line frequency.
An example of phase investigation is illustrated in Fig. 2-30. Here, the signal progression is being checked along an artificial delay line, such as is found in pattern generators. Each section of the delay line changes the signal phase by a specified time interval, as required for normal generator operation. In order to test these time intervals with a scope, the function control is set to the "Ext. Sync." position. A test lead is run from the "Ext. Sync" terminal to the input (or output) end of the delay line. Then, as the vertical-input lead is moved progressively from one line section to the next, the exact phase delay in each case is displayed on the scope screen.
Phase investigations are occasionally of great concern when checking audio amplifiers which have feedback networks. Incorrect phase shift can cause distortion or unstable operation, sometimes with violent oscillation. A conventional amplifier stage steps up the signal voltage and reverses its phase. Any sync function can be used when measuring stage gain, merely by comparing the heights of the input and output patterns of the amplifier. The phase shift from input to output, however, can be checked only by utilizing the external sync function of the scope.
Another method of making phase-shift tests is to utilize a dual-trace scope, such as that illustrated in Fig. 2-31. This type of scope contains a built-in electronic switch, so that two vertical channels (Channel A and Channel B) are provided. In turn, two vertical-input signals can be applied to the scope, and the corresponding waveforms are displayed on the crt screen as shown in Fig. 2-32. Note that the phase difference between the two waveforms is directly shown on the screen.
Another example of a dual-trace test is seen in Fig. 2-33. Here, the timing of the burst keying pulse with respect to the color burst is displayed. Note that timing tests of complex waveforms are essentially the same as phase-shift tests of sine waves.
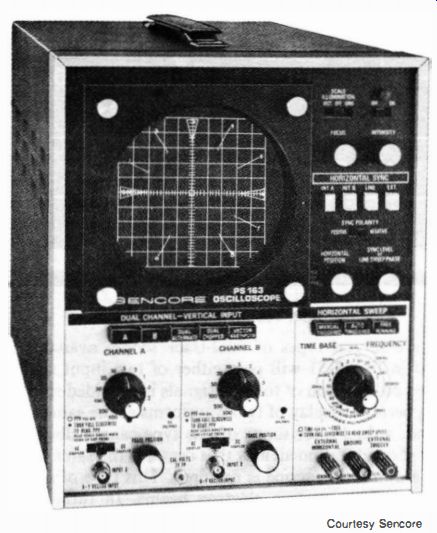
Fig. 2-31. A dual-channel dual-trace triggered sweep oscilloscope.
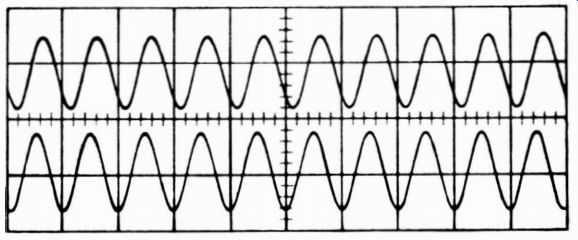
Fig. 2-32. Phase measurement with a dual-trace scope.
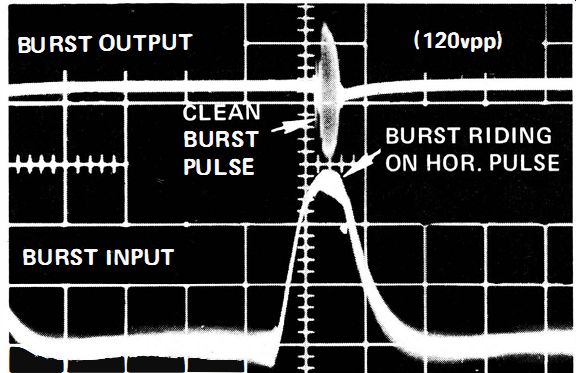
Fig. 2-33. Test of color-burst timing.
There are several types of dual-trace scopes available. The type illustrated in Fig. 2-31 will pass either of two input signals, one at a time, and comparison of the two signals is provided since electronic switching permits display of two waveforms at the same time. On the other hand, a dual-trace scope of this type cannot display two non-recurrent short-duration signals that occur at the same time. For this purpose, a dual-beam scope is required. This type of scope employs a special crt that has two electron beams. In turn, two different waveforms can be traced on the screen at the same time. Also, an elaborate dual-beam scope can display the upper waveform on one time base and can display the lower waveform on another time base.
Electronic switches used in dual-trace scopes may be capable of switching in either of two modes. In the first mode, the two signals are alternately sampled in rapid succession during the sweeps so that the waveforms are displayed as a series of closely spaced dots instead of a continuous line. This is called the chopped mode. Next, in the second mode, recurring signals are displayed synchronously with the sweep repetition rate and are traced out alternately on the screen. The switching occurs during the sawtooth retrace interval. This is called the alternate mode, and it is the preferred method when using high-speed sweeps.
Triggered Time Bases
The oscilloscope illustrated in Fig. 2-31 provides a choice of free
running and triggered time bases. A time base is a sawtooth horizontal-deflection (sweep) system. A free-running time base is self-oscillatory and generates a sawtooth output whether or not a signal is applied to the vertical amplifier. On the other hand, a triggered time base is not self-oscillatory; it generates a sawtooth output only when a signal is applied to the vertical amplifier. A single sawtooth waveform is generated at the instant that the vertical-input signal passes through a certain voltage level with a chosen polarity. An oscilloscope that provides a choice of free-running (recurrent) sweep and triggered sweep is called a dual-mode oscilloscope.
As noted previously, the chief advantage of a triggered-sweep scope is that a small portion of a waveform can be selected and greatly expanded horizontally. Most triggered time bases are also calibrated, and the sweep speed is indicated by the setting of the time-base control. As an illustration, the time-base control shown in Fig. 2-34 has a triggered-sweep range from 0.1 microsecond per division to 100 milliseconds per division. This facility permits the operator to measure frequency, pulse widths, rise time, and various other waveform characteristics that involve time. A concentric time-base control is shown in Fig. 2-34. The inner control knob is a vernier adjustment of sweep speed and is uncalibrated. Therefore, when reading sweep speed values from the scale, it is necessary to turn the vernier control off (fully clockwise in this example). Additional controls are associated with a calibrated triggered-sweep time base, as explained in the next topic.
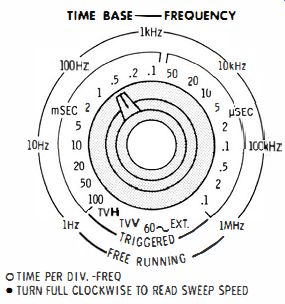
Fig. 2-34. A calibrated time-base control for a triggered-sweep oscilloscope.
Action of TRIGGERED-SWEEP CONTROLS
The time-base controls for a typical triggered-sweep scope are illustrated in Fig. 2-35. In usual operation, the "Horizontal-Display" switch is set to its "Int." (internal) position; the horizontal amplifier is then driven by the sawtooth time base. Note that the "Time-Base" control is calibrated in microsecond, millisecond, and 1-second steps.
A "Var." (variable) setting is also provided-the sweep is uncalibrated when operating in the "Var." position. In general, we operate the time base on one of its calibrated settings so that we can measure rise time, delay time, elapsed time, etc.
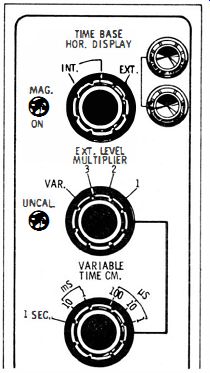
Fig. 2-35. Time-base controls of a triggered-sweep scope.
Let us observe how a waveform can be expanded for analysis of detail by operating the time base at high speed. In Fig. 2-36A, a combination sawtooth and stairstep waveform is shown as it appears when displayed at slow sweep speed. The steps in the waveform are invisible. However, when the vertical gain is advanced 500 times and the sweep speed is likewise increased 500 times, the waveform detail appears clearly, as illustrated in Fig. 2-36. Similarly, a pulse, square-wave, or video signal can be expanded for analysis of detail.
The trigger controls of a triggered-sweep scope are shown in Fig. 2-37. Switches permit triggering to occur on either the positive or negative portion of a waveform. Most waveforms are displayed in the ac trigger position. To the beginner, the dc trigger position might be misleading-actually, the term "dc" in this case denotes that only the low frequencies of the signal are permitted to pass into the trigger section. This is a useful function for proving stable display and expansion of the color burst, for example. In the "Auto." (automatic) position, triggering occurs in a manner similar to the operation of a free-running scope. However, there is a basic difference in that synchronization is essentially automatic and no sync-amplitude control is utilized.
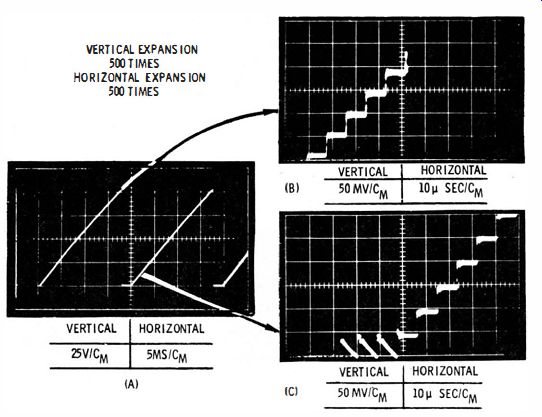
Fig. 2-36. "Stair step" voltage waveform expanded 500 times.
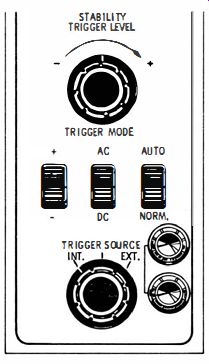
Fig. 2-37. Trigger controls of a triggered-sweep scope.

Fig. 2-38. Stability-control action. (A) Horizontal trace. (B) Desired pattern.
(C) Blank screen.
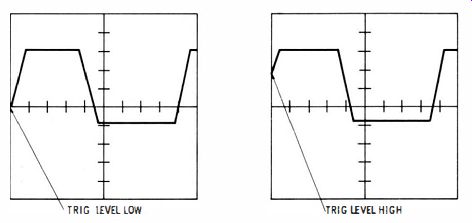
Fig. 2-39. This waveform is being triggered along its positive slope (rising
interval).
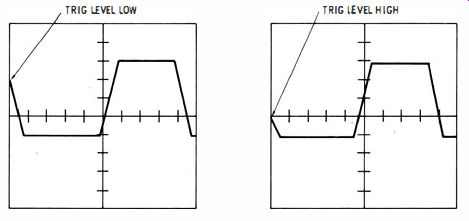
Fig. 2-40. This waveform is being triggered along its negative slope (falling
interval).
When the trigger section is set to its "Norm." (normal) position, the "Stability" and "Trigger-Level" controls are operative. The "Stability" control must be operated over the correct part of its range, as illustrated in Fig. 2-38. At one extreme end of its range, we obtain only a horizontal trace On the scope screen (Fig. 2-38A). Over the correct portion of its range, the desired pattern is displayed (Fig. 2-38B). At the other extreme end of its range, the screen becomes blank (Fig. 2-38C). Suppose that positive triggering is in use; the displayed waveform starts on its rising interval as shown in Fig. 2-39.
On the other hand, suppose that negative triggering is in use; the waveform starts on its falling interval, as illustrated in Fig. 2-40. By adjusting the "Trigger-Level" control, we can progressively shift the trigger point from the zero level to the peak, and start the waveform at any intermediate point. This is a useful feature that permits the operator to select a small interval anywhere along a waveform, and expand this small interval to occupy the entire screen.
The beginner is advised to become familiar with a triggered-sweep scope utilizing the "Auto." function. Although a small interval cannot be selected along a waveform when the "Auto." function is used, operation is comparatively simple-the "Stability" and "Trigger Level" controls are inoperative. After familiarity is gained with the time-base controls, the beginner may proceed to operate the scope in its "Norm." trigger mode.
LISSAJOUS PATTERNS
Lissajous patterns are displayed by feeding sine-wave voltages to both the vertical and horizontal amplifiers. Because many scopes have a 60-Hz sweep position on the function switch, such tests can be made readily by utilizing this function. When any 60-Hz sine-wave voltage is applied to the vertical-input terminals, a Lissajous pattern then appears on the scope screen.
The pattern shows the phase of the vertical signal with respect to the horizontal signal. Progressive phases are illustrated in Fig. 2-41.
Scopes which have internal 60-Hz sine-wave deflection often have a "Sweep-Phasing" control. As it is turned, the Lissajous pattern goes through the various shapes shown in Fig. 2-41. A circular pattern provides a good check for sine-wave purity. Furthermore, if there are harmonics in the 60-Hz voltage to the vertical or horizontal amplifier, or both, a perfect circle cannot be obtained. Irregularities are seen instead.

Fig. 2-41. Lissajous patterns show phase difference between two sine waves.·
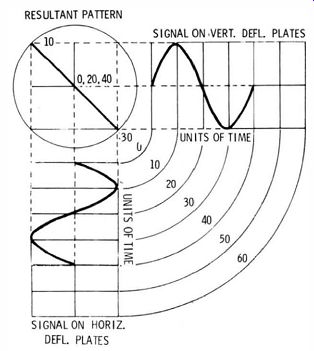
Fig. 2-42. In-phase sine waves form a straight-line Lissajous pattern.
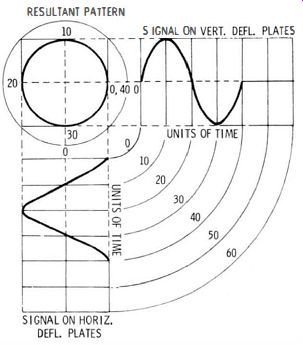
Fig. 2-43. Sine waves 90 degrees out of phase form a circular Lissajous pattern.
Lissajous patterns can be obtained, of course, at any frequency within the response range of the scope. The principle of pattern development is the same, regardless of frequency. Fig. 2-42 illustrates how in-phase deflection voltages on the vertical and horizontal crt plates produce a straight line. Similarly, Fig. 2-43 shows how a 90° phase difference produces a circular pattern. When one of the frequencies is double, triple, or quadruple the other frequency, crossover patterns result. If the two frequencies are not integrally related, the pattern is not fixed, but moves through successive phase sequences.
DISPLAY OF NARROW PULSES
As seen in Fig. 2-30, function switches provide a choice of positive or negative internal sync. When a sine wave or square wave is being displayed, the pattern locks equally well on either positive or negative sync. If a narrow pulse is being displayed, however, sync lock will be much tighter when the appropriate sync polarity is used. Positive pulses lock best on positive sync, and negative pulses lock best on negative sync. The reason for this is that a very narrow positive pulse has a very small negative peak voltage (and vice versa). Hence, if negative sync is used when a narrow positive pulse is displayed, there is very little voltage available for locking.
Any complex waveform distributes itself above and below the zero volt level to make the positive area equal the negative area. This is a direct consequence of the fact that the average value of an ac waveform is zero, or there is just as much current in the positive direction as in the negative direction. Thus, the area of the positive half-cycle is equal to the area of the negative half-cycle, although the peak voltages are different. A scope displays voltage along the vertical axis, and time along the horizontal axis (when sawtooth deflection is used). Voltage multiplied by time gives electrical quantity, and the product is an area. Therefore, positive and negative areas of the waveform are necessarily equal.
DISPLA Y OF SQUARE WAVES
The square wave is one of the basic complex waveforms. For the purpose of circuit testing, there are two ways to analyze a square wave. One way is to consider that the waveform is a rapid change of voltage followed, after a certain interval, by a similar but opposite voltage change. The other way is to consider the waveform as the algebraic sum of a large number of sine waves that have different frequencies and amplitudes. The fundamental sine-wave component has a frequency equal to the repetition rate of the square wave. The other sine-wave components are odd harmonics of the fundamental.
(In theory, an infinite number of odd harmonics is required to obtain a perfect square wave.) Square waves are quite useful in circuit testing because a single test suffices to show how a circuit responds to a wide range of frequencies, with regard to both voltage and phase. Some examples of reproduced square waves are shown in Fig. 2-44.
All square waves, when carefully inspected, are found to depart more or less from an ideal square wave having perfectly square corners with zero rise and fall times. It is impossible to generate a perfect square wave, because the higher harmonics are weakened. However, a good generator provides a square-wave output which can be considered as ideal for most applications.
Differentiation and integration occur in RC circuits, as shown in Fig. 2-45. It is a basic law that if differentiation takes place in one part of a circuit, integration must take place in another part. This is the case because the sum of the waveforms around the circuit must add up to cancel the applied square-wave voltage. This is called Kirchhoff's law, which is almost as fundamental as Ohm's law in analysis of circuit action.
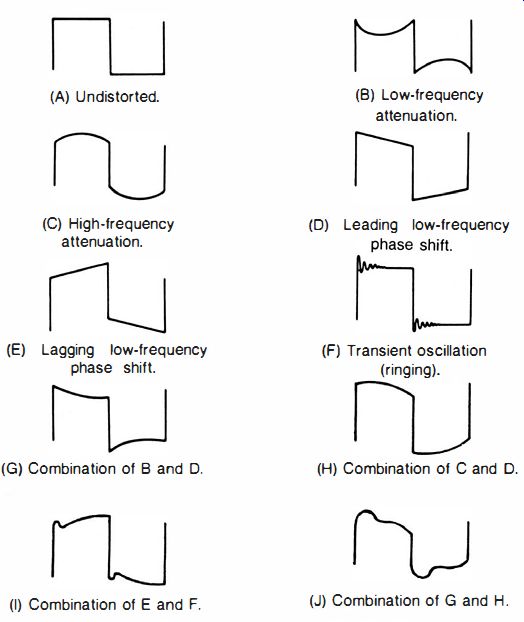
Fig. 2-44. Key square-wave reproductions. (A) Undistorted. (C) High-frequency
attenuation. (E) Lagging low-frequency phase shift. (G) Combination of B and
O. (I) Combination of E and F. (B) Low-frequency attenuation. (D) Leading low-frequency.
(F) Transient oscillation (ringing). (H) Combination of C and O. (J) Combination
of G and H.
The result of a typical square-wave test is seen in Fig. 2-46. Here the input and output voltages of the unit under test are shown superimposed. There is a substantial loss in square-wave voltage through the unit under test. Integration is prominent, with a slight differentiation evidenced by the small downhill tilt of the top in the reproduced square wave. When both integration and differentiation occur, they do so in successive circuit sections. It is possible for the integration in one section to cancel the differentiation in a following section in order to obtain an undistorted output. Vertical-sweep circuits in tv receivers afford a practical example of this circuit action.
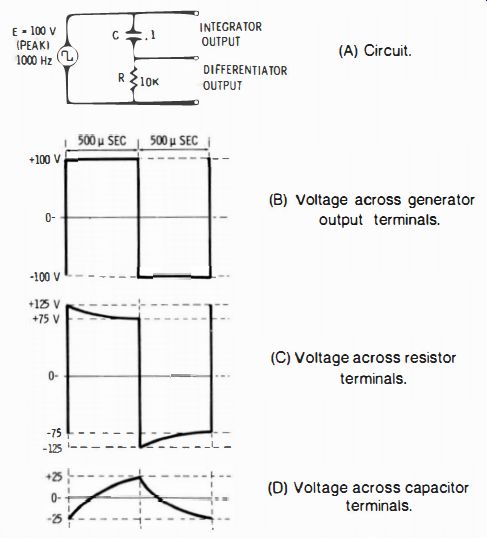
Fig. 2-45. RC differentiating and integrating action on a square wave. (A)
Circuit. (B) Voltage across generator output terminals. (C) Voltage across
resistor terminals. (D) Voltage across capacitor terminals.
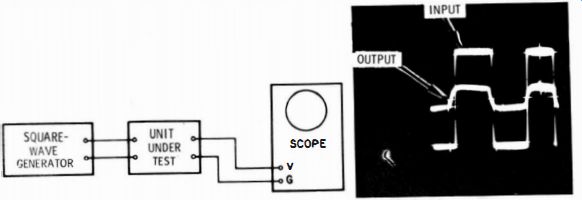
Fig. 2-46. Result of a typical square-wave test.
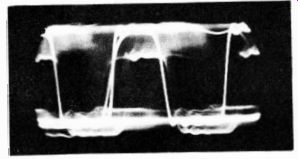
Fig. 2-47. Pattern jumping caused by fluctuating line voltage.
FLUCTUATING LINE VOLTAGE
Line-voltage fluctuation can be a problem in heavily industrialized or remote rural areas. Appreciable variation in line voltage can cause pattern jumping, as in Fig. 2-47. If that is the case, the voltage must be stabilized. The best method is to use an automatic line-voltage regulating transformer to power the scope and the equipment under test. Although such transformers do not completely smooth out rapid fluctuations, pattern stability is greatly improved.
In service scopes having regulated power supplies, the automatic line-voltage regulating transformer is required only to power the equipment under test.