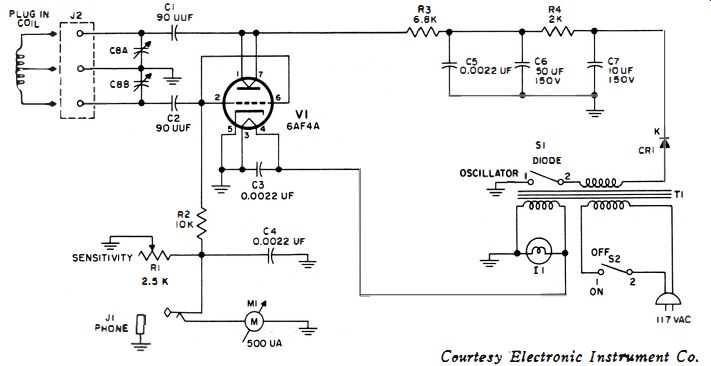
Fig. 6-1. Schematic for a typical grid-dip meter.
| Home | Audio mag. | Stereo Review mag. | High Fidelity mag. | AE/AA mag. |
Various signal sources used in electronic test work are basically specialized types of signal generators. Such instruments lack the general utility of a conventional signal generator. On the other hand, they provide maximum convenience for particular classes of applications. For example, a grid dip meter is basically a variable-frequency oscillator with an unshielded external tank. A d-c microammeter is provided in series with the grid-leak resistance of the oscillator to indicate grid-current flow (Fig. 6-1 ). When the tank coil is placed in the vicinity of a tuned circuit, such as an i-f coil in a radio or television receiver, an impedance is coupled into the tank coil. This coupled impedance has a resistive component which reduces the amplitude of oscillation in the grid-dip oscillator.
Fig. 6-1. Schematic for a typical grid-dip meter.
In turn, the grid-current flow becomes less, and the pointer drops back on the microammeter scale.
When the grid-dip meter is tuned to the resonant frequency of the tuned circuit under test, the coupled resistance reaches a maximum value, and the pointer dips to a minimum reading. It is this characteristic response of the grid-dip meter which gives the instrument its name. A GDM is provided with a tuning dial which is typically calibrated from 400 khz to 250 mhz. Instead of using a range switch, the tank coils are designed as plug-in units. Eight coils may be used to cover the complete frequency range noted above. It is desirable that the GDM generates a good sine wave on all ranges.
Why is a pure sine wave needed? It is needed because harmonics can cause false dip indications. For example, suppose that the GDM has a substantial second-harmonic output. Then, if you set the tuning dial to 1 mhz and couple the tank coil to a 2-mhz circuit, a dip indication occurs. It could be falsely concluded that the 2-mhz circuit has a resonant frequency of 1 mhz. Hence, most grid-dip meters are designed to minimize harmonic output insofar as is practical. This requires that the oscillating circuit have as high a Q as possible. Because the meter loads the grid circuit, a conflicting situation is imposed. In practice, a microammeter is utilized instead of a milliammeter. Accordingly, grid-current demand is minimized, and the Q of the tank circuit is maximized.
Observe the typical GDM circuit shown in Fig. 6-1. This configuration is operated either as a Colpitts oscillator or as a shunt-fed Hartley oscillator. Tank coils for the first three ranges (up to 2.9 mhz ) are tapped, and the tap point is connected to ground. This is a Hartley arrangement. On the other hand, coils for the five higher ranges are not tapped.
Hence, the GDM operates in a Colpitts configuration on these high-frequency ranges. Why is this circuit change made? It is because the amplitude of oscillation becomes weaker at lower frequencies in the Colpitts circuit. However, by going to a Hartley circuit at low frequencies, the amplitude of oscillation can be kept reasonably constant.
ACCURACY CONSIDERATIONS
Because the oscillator coil of a grid-dip meter is exposed, the basic accuracy of a GDM is less than that of an ordinary signal generator. If you move a GDM from a wooden bench to a metal bench, its oscillating frequency shifts 0.5% in a typical experiment. Next, when you place the tank coil near a tuned circuit, a frequency shift of 5% can occur. Minimum frequency shift takes place if the coupling is made as loose as possible so that only a slight dip indication is obtained.
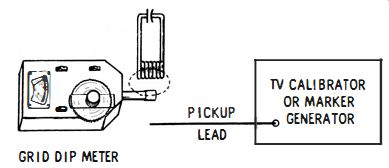
Fig. 6-2. The TV calibrator measures the frequency shift of the grid-dip meter.
Service-type grid-dip meters may have no accuracy rating. A lab-type GDM may have an accuracy rating of +2%. This compares with an accuracy rating of +1 % for a standard signal generator.
An accuracy rating of +2% for a GDM is based on the frequency indication when the tank coil is distant from any metal object. The rating does not apply if there is a metal object, surface, or tuned circuit in the field of the tank. On the other hand, the accuracy rating of a signal generator is applicable under all circumstances. How can we easily check the accuracy of a grid-dip meter under various experimental conditions ? Note the arrangement shown in Fig. 6-2. Some marker generators operate as heterodyne frequency meters and can indicate frequencies to high accuracy. As we bring a coil under test in the vicinity of the oscillator tank (Fig. 6-2) , the frequency shift that occurs is measured on the heterodyne frequency meter.
Frequency shift can occur in either direction when the coil is brought into the vicinity of the oscillator tank ; the oscillating frequency may become higher, or it may become lower. This depends on which side of resonance the coil is tuned. A tuned circuit has inductive reactance at frequencies above resonance, but it has capacitive reactance at frequencies below resonance. Thus, the impedance coupled into the tank can be either capacitive or inductive. We recall that it is the resistive component of the coupled impedance that causes a dip indication. In other words, the coupled inductance or capacitance produces no dip ; it only shifts the oscillator frequency.
OPERATION AS A HETERODYNE FREQUENCY METER
Within its accuracy limitations, a grip-dip meter also operates as a heterodyne frequency meter. A pair of headphones is plugged in in place of the indicating meter (Fig. 6-1) . When the GDM tank is coupled to a source of r-f energy, a beat note is heard as the oscillating frequency is tuned to the source frequency or to one of its harmonics. You should advance the sensitivity control of the GDM to maximum in this application. The r-f source must supply energy to energize the earphones after overcoming the losses in the grid circuit of the GDM. Since the grid circuit operates as a simple diode and provides no amplification, and because R1 and R2 (Fig. 6-1) form a 5-to-1 voltage divider, the GDM cannot approach the sensitivity of a conventional heterodyne frequency meter.
OPERATION AS A WAVEMETER
When S1 is set to its open position (Fig. 6-1) , plate voltage is removed from V1 ; in turn, the triode operates as a diode. If the tank is coupled to a source of r-f energy, the GDM operates as a wavemeter. V1 rectifies the incoming r-f voltage and causes a deflection of M1 when the tank is tuned to the frequency of the r-f source. Inasmuch as the micro-ammeter is less sensitive than a pair of earphones, more r-f energy than is needed for operation as a heterodyne frequency meter must be coupled into the tank. Note, however, that if the r-f source happens to be modulated at an audio frequency, earphones can be used for indication ; in such case, the sensitivity of the wavemeter is considerably greater.
OPERATION AS AN AUXILIARY SIGNAL GENERATOR
Fig. 6-3 . A loop couples r-f energy from the grid-dip meter to a coaxial
cable.
A grid-dip meter can be used as an emergency substitute for a signal generator. To feed the r-f output from the GDM to a desired point of amplification, a coaxial cable can be coupled to the tank coil, as shown in Fig. 6-3. R-f energy is induced in the one-turn loop. The other end of the coax cable should be terminated with a resistor that has the same value as the characteristic impedance of the cable. This avoids large output variations due to standing waves. The far end of the cable may also be provided with alligator clips, in the same manner as a signal-generator output cable.
Since a grid-dip meter has c-w Output only, it produces no audible Output from a radio' receiver. A d-c voltmeter connected at the Output Of the second detector is the most convenient signal-level indicator. Another method’s is to' connect a vtvm to' the AVe line. Alignment is customarily checked at near-maximum sensitivity Of the receiver. Accordingly, the coupling IO'O'P in Fig. 6-3 is moved away from the tank Coil to' a distance at which the voltmeter reads a small value. AI
though this is an emergency-type attenuator arrangement and must be applied with care, it can be very useful when a conventional signal generator’s is not available.
Suppose you’d feed the Output from the coaxial cable in Fig. 6-3 to' an O'scillO'scO'pe. The GDM waveform is then displayed On the scope screen (Fig. 6-4) . A very good sine wave will probably be Observed at the higher r-f frequencies, such as 5 mhz. On the Other hand, at Lower r-f frequencies, such as 465 khz, you will probably Observe a noticeably distorted sine wave.
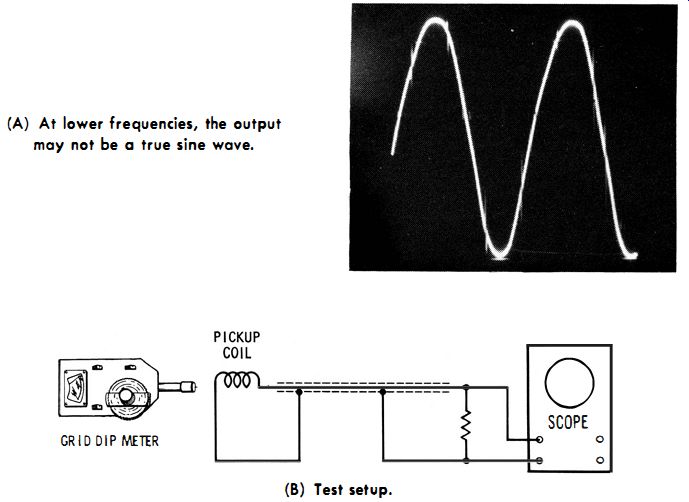
Fig. 6-4. Output of a grid-dip meter displayed on a scope screen. (A) At lower
frequencies, the output may not be a true sine wave. GRID DIP METER (b) Test
setup.
This happens because a grid-dip meter is primarily designed for operation’s at fairly high r-f frequencies. It is comparatively Costly to' elaborate the circuitry to generate a pure sine wave at all frequencies. For the majority Of application’s, the additional Co’s is no’s justified.
MODULATION OF A GRID-DIP METER
It might be supposed that the r-f output from a grid-dip meter could be modulated by applying the output from an audio oscillator to the phone jack (Fig. 6-1) . This would be expected to provide grid modulation, and it does. However, we find that the percentage of modulation that can be obtained is comparatively small. For example, if it is attempted to modulate the GDM at 30%, the modulation envelope suddenly jumps to 100% and becomes highly distorted. What happens is that the grid-dip oscillator stops operating on the downward excursion of the modulating voltage. Then, as the modulating voltage rises toward its upward excursion, the oscillator starts operating again.
Although the percentage modulation is limited to a rather low value when sine-wave modulation is used, you can obtain very good square-wave modulation. In other words, if you apply the output from a square-wave generator to the phone jack (Fig. 6-1) , the grid-dip oscillator is switched on and off as the square wave rises and falls. The modulation percentage is 100%, and the modulation envelope has a very good square waveform.
HARMONIC RESPONSE OF STUBS
Although a grid-dip meter might have a very good sine-wave output at the higher r-f frequencies, beginners are often confused by its apparent harmonic output when checking the resonant frequency of a stub. For example, Fig. 6-5 shows a 300-ohm line stub, short-circuited at one end by a copper plate-this makes a very effective r-f short. The tank coil of the GDM is placed near the end of the stub. When the tuning dial is varied over a wide range of frequencies, it is found that numerous dips are obtained. These dip frequencies are harmonically related.
Note carefully that dip indications at harmonic frequencies are not caused by harmonic output from the grid-dip oscillator, but result from the multiple resonances of the stub itself.
As seen from Fig. 6-5, the lowest resonant frequency occurs at %, wavelength. The r-f voltage is always zero at the shorted end of the stub, and the r-f current is greatest at the shorted end. Conversely, the r-f voltage is always greatest at the open end of the stub, and the r-f current is zero at the open end.
At any odd multiple of the lowest resonant frequency, these conditions are again satisfied. Hence, the stub has multiple resonances.
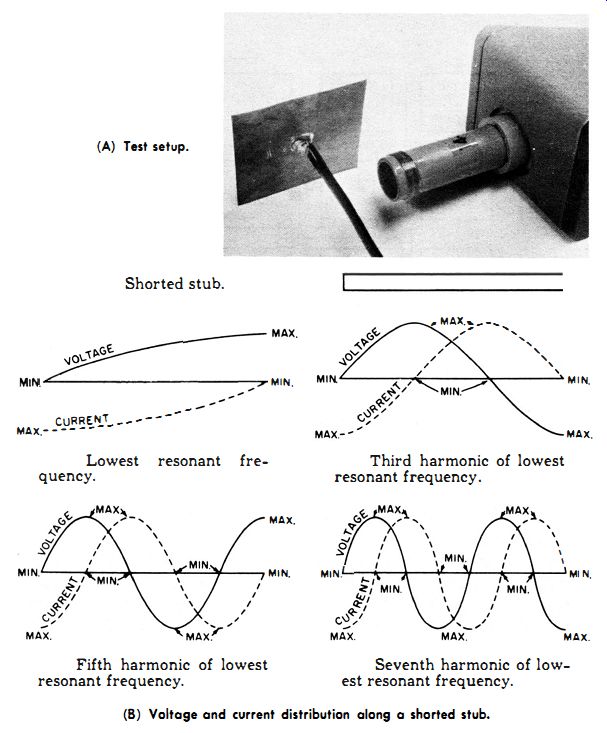
Fig. 6-5. Checking the harmonic response of a stub. (A) Test setup. Shorted stub.
(b) Voltage and current distribution along a shorted stub.
ANALYZER TYPE OF GENERATOR
Another important specialized signal generator is called an analyzer. Fig. 6-6 shows a block diagram for a typical TV analyzer. Signal outputs are : modulated r-f output on the low vhf band, with harmonic outputs on channels 6, 7, 8, 12, and 13 ; modulated i-f output from 20 to 48 mhz ; video output over a 4-mhz bandwidth ; intercarrier-sound output at 4.5 mhz, modulated with a 400-cycle sine wave at 25-khz deviation ; 400 cycle audio output ; pulse output at 60 cycles and at 15,750 cycles ; composite vertical and horizontal sync pulses ; 3.56-mhz chroma signal output ; yoke test signal ; AGe keying pulse, and a wide variety of video signals generated by a flying spot scanner.
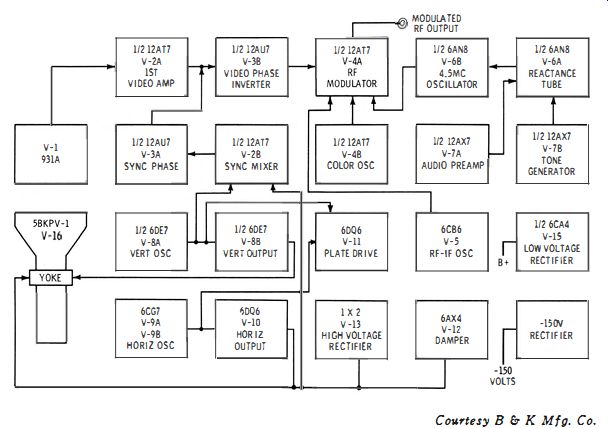
Fig. 6-6. Block diagram of TV analyst.
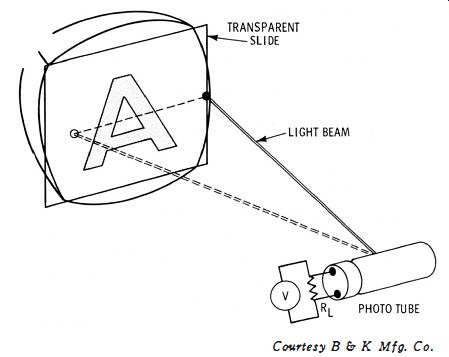
Fig. 6-7. Changing video to an electrical signal.
The flying-spot scanner utilizes a small spot of light from a cathode-ray tube which sweeps across (scans) a slide transparency. As seen in Fig. 6-7, when the spot passes behind parts of the opaque "A" on the transparency, the light beam is blocked. Output from the phototube occurs only when the light beam is passed. In turn, a video-signal voltage appears across load resistance RL. As shown in Fig. 6-8, the light beam scans from left to right ; it also scans from top to bottom of the transparency, just as a TV picture-tube screen is scanned.
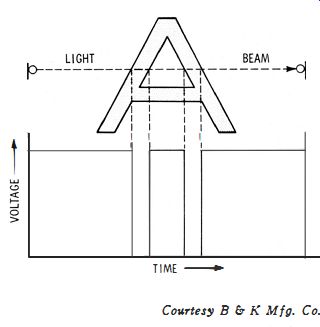
Fig. 6-8. Light beam causes a voltage across the load resistor.
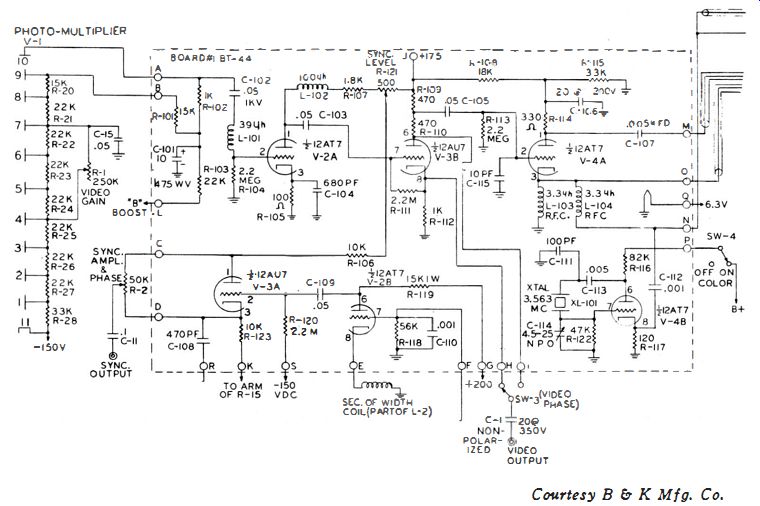
Fig. 6-9. Schematic of the scanner section.
Load resistor RL in Fig. 6-7 corresponds to R102 in Fig. 6-9.
In turn, the video signal is coupled to the grid of V2A, the first video-amplifier tube. To maintain good high-frequency response, a peaking coil is used in the plate circuit, and cathode resistor R105 is partially bypassed. Note the 500-ohm potentiometer in the plate circuit of V2A ; this pot is part of the plate-load resistance for V3A. It provides resistive coupling between these two stages which mix the sync signal with the video signal to form a composite signal. Thus, the composite video signal appears at the plate of V2A. In turn, the composite video is coupled to the grid of V3B. Outputs are taken from both the plate and the cathode of V3B, and they are available at a front-panel terminal as either positive-going or negative-going composite video. The plate load resistance for V3B comprises two 470-ohm resistors. The signal at the junction of these two resistances is coupled to V 4A, the r-f modulator. Output from the r-f oscillator (not shown in Fig. 6-9 ) is fed to the cathode of V4A. The 4.5-mhz sound signal, or the 3.56-mhz chroma signal may also be switched into the cathode of V 4A. A quartz-crystal oscillator provides a highly stable 3.56-mhz output from the V 4B stage. This oscillator is switched on or off, as desired, by means of SW 4. Output from V 4B is fed to a front-panel terminal, and also to the cathode of V 4A. Thus, the chroma signal is made available either at the video frequency or at the modulated r-f frequency. The r-f carrier is generated by V5 (Fig. 6-10) . This is a Colpitts configuration that can be operated at preset channel frequencies, or at a variable i-f frequency. The i-f range is tunable from 20 to 48 mhz by means of C17. Attenuation is controlled by both R28A and R29B ; thus, the attenuation provided by R29A is supplemented by varying the screen voltage of V5. Output from V5 is fed to. the cathode of V4A (Fig. 6-9) . R29A in Fig. 6-10 obtains a modulated r-f signal from the plate of V4A (Fig. 6-9) .
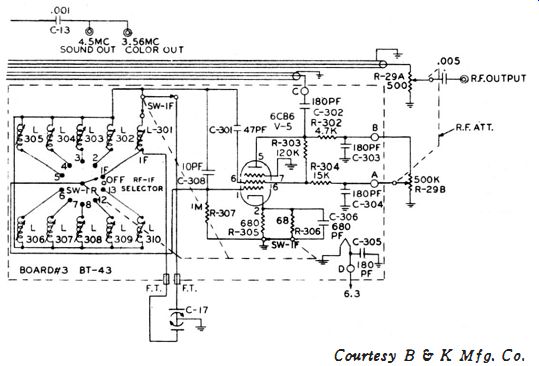
Fig. 6-10. R-f and i-f oscillator section.
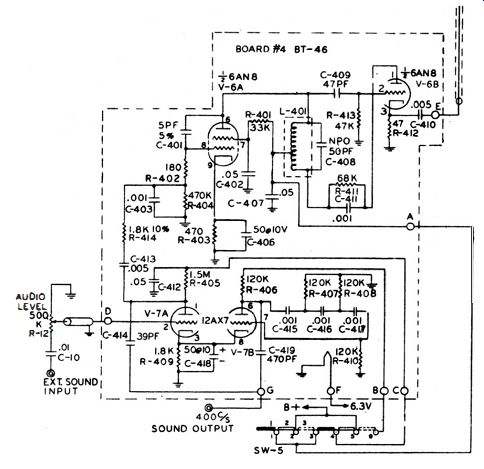
Fig. 6- 11. Schematic of the sound section.
Next, the sound system (Fig. 6-11) utilizes a 4.5-mhz oscillator, which is one-half of a 6AN8 ; the 4.5-mhz output is taken from the cathode of V6B. Note that V6A is a reactance tube which provides frequency modulation of the 4.5-mhz carrier generated by V6B. This reactance tube can be driven from two sources. One source is V7B, which is one-half of a 12AX7 ; it is a phase-shift oscillator that generates a 400-cycle tone signal. This 400-cycle source is also made externally available.
The second section of the 12AX7 (V7 A) is an audio. amplifier which can be driven from an external signal source. Thus, V6B can be externally modulated for special test procedures.
The sync signal (Fig. 6-6) is obtained by mixing vertical pulses with horizontal pulses in V2B. Horizontal pulses are obtained from a width Coil in the horizontal-output section ; vertical pulses are generated by the vertical oscillator. These circuits are basically the same as those used in the scanning sections of a television receiver. Control R2 in Fig. 6-9 provides a choice of sync Polarity. A few turns of wire, which form the secondary of width Coil L2, provide the cathode return of V2B. The vertical pulse is fed to. the grid of V2B.
Mixing is accomplished in the plate circuit ; thus, at pin 6 of V2B we find both horizontal and vertical sync pulses.
This complete sync signal is coupled to the grid of V3A, which is a clipper-amplifier. Part of the load resistance for V3A is common to V2A, as previously noted. Thus, R121 operates as a sync-level control. We see that R2 is fed at each end with oppositely-polarized sync signals. It follows that when R2 is set to its center position, the two signals cancel out, and there is no output from the slider arm. But, as R2 is turned either clockwise or counterclockwise, we obtain either the plate or the cathode signal . In turn, either positive-going or negative-going sync is made available at the sync-output terminal.
Finally, let us consider the shorted-turns test configuration.
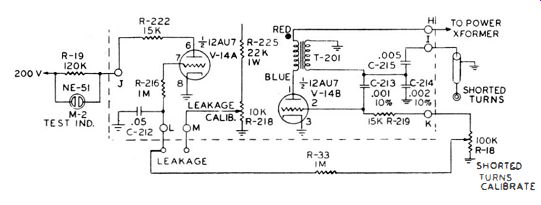
Fig. 6-12. Shorted-turns oscillator and indicator circuit.
The circuit arrangement is seen in Fig. 6-12. V14B is a simple pulse-oscillator tube. Its grid is coupled to a coax cable that is connected across a yoke or flyback transformer which is to be tested for shorted turns. T201 has a fairly high Q and is sensitive to the loading applied via the coax cable. Signal-developed bias at the grid of V14B is fed to V14A, which is a d-c amplifier tube. Evidently, the plate current drawn by V14A depends upon its grid bias. In turn, the voltage drop across R19 depends upon this grid bias. When V14A draws more than a certain current (the level of which is set by R18) , the neon lamp M2 will glow.
Suppose that the coax cable is connected across a good yoke or flyback transformer. The Q of the winding under test will then be relatively high, and little power will be absorbe3 from T201. Hence, the grid bias developed by V14B is not changed appreciably, and the neon lamp does not glow. On the other hand, consider what happens when there is a shorted turn or two in the yoke or flyback winding under test. In such case, power is absorbed by the short circuit. T201 is loaded appreciably, and the amplitude of oscillation is reduced. Consequently, the grid bias developed by V14B falls to a low value ; V14A draws more plate current, and the neon bulb M2 glows. Different types of yokes and flyback transformers can be accommodated by setting R18 to a suitable calibration point.
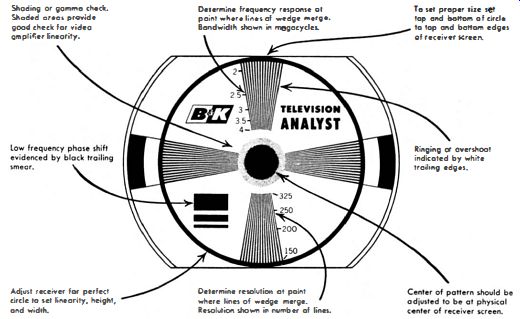
Fig. 6-13. Test pattern.
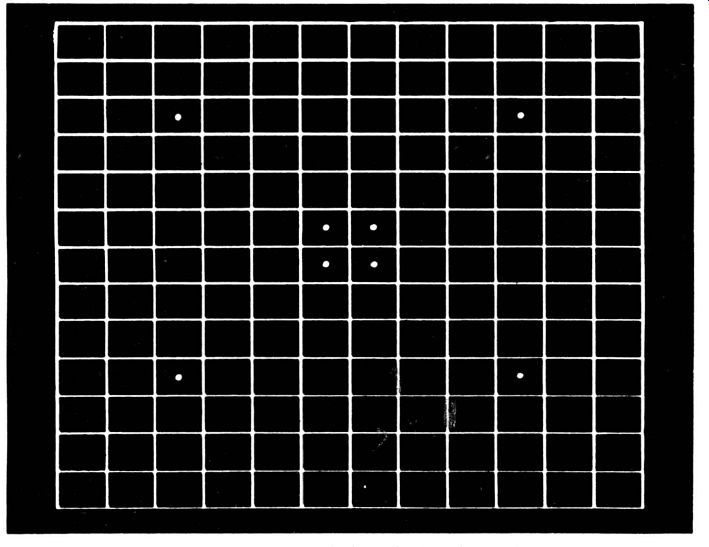
Fig. 6-14. Crosshatch pattern with dots, displayed by a flying-spot scanner.
Any desired type of pattern signal can be generated by a scanner. The most basic is a test pattern (Fig. 6-13) . Beginners may be surprised at the large amount of information conveyed by a test-pattern signal . Another basic pattern is illustrated in Fig. 6-14. Crosshatch patterns are used both to ...
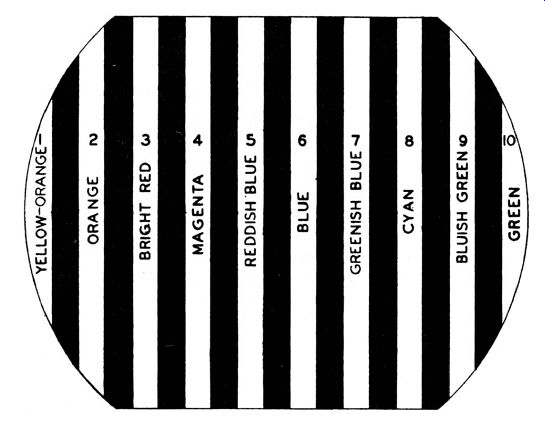
Fig. 6-15.
Color bar pattern.
... check linearity adjustments and convergence adjustments in color-TV receivers. Still another pattern is shown in Fig. 6-15.
This color-bar pattern is obtained by inserting a white-and black bar transparency in the scanner, with V4B (Fig. 6-9) operating. This combination provides a keyed-rainbow pattern.
TRANSISTOR RADIO ANALYZER
Another specialized type of signal generator is used for troubleshooting transistor radios. The circuit for a typical instrument is shown in Fig. 6-16. It comprises a self-modulated oscillator combined with a signal tracer. A transistor tester is also provided. Note that the signal source is a transistorized blocking oscillator which consists of transistor X3 and tank circuit L1 and C4. The oscillator has a fundamental frequency of 400 hz. Since the blocking action is abrupt, an extensive spectrum of harmonics is generated. Fig. 6-17 illustrates the output waveform. Maximum output is 10 volts peak-to-peak. Harmonics are useful up to 30 mhz.
How does the blocking oscillator work? Transistor X3 in Fig. 6-16 operates in a Hartley configuration. Coil L1 is tapped at a point which provides a large amount of feedback. In turn,
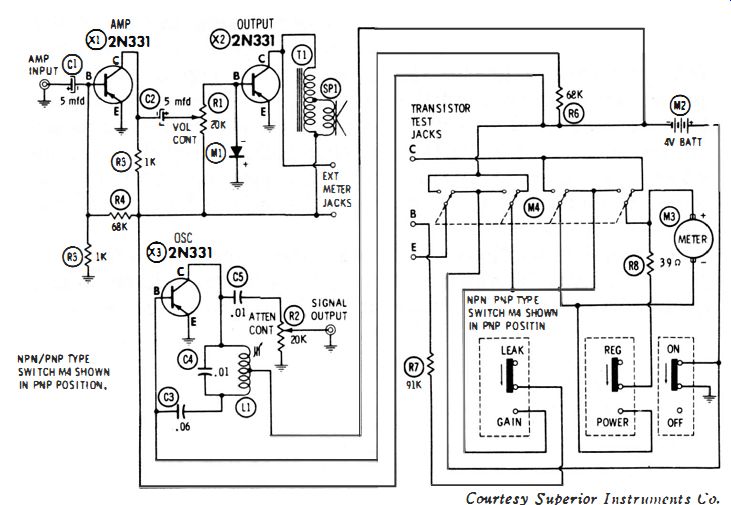
Fig. 6-16. Circuit of a harmonic generator.
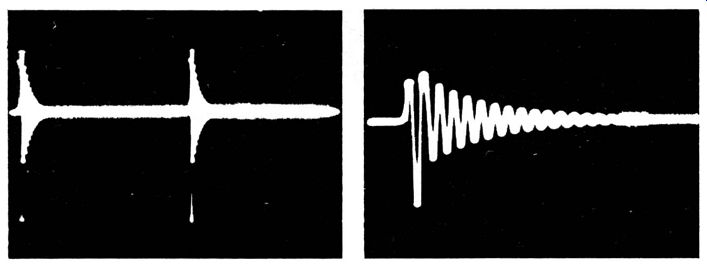
Fig. 6-17. Output waveform of the harmonic generator.
the base is strongly overdriven. The base draws considerable current on the peak of the drive, and this base current cannot flow to ground immediately. Instead, C3 charges to the peak voltage and then discharges at a comparatively slow rate through R6. After the peak of the drive signal passes, transistor X3 is biased beyond cutoff by the charge on C3.
During this cutoff interval, the generator circuit rings at the resonant frequency of L1 and C6. This ringing waveform is seen in Fig. 6-17.
Thus, the r-f ringing frequency is a damped sine wave which recurs 400 times a second. Because the damped sine wave is unsymmetrical, this 400-cycle recurrence frequency is directly audible. In other words, if the waveform of Fig. 6-17 is applied to an audio amplifier or to a pair of earphones, a 400-hz tone is heard. Hence, the output signal may be injected into audio-amplifier circuits for signal-substitution tests. The damped sine wave has a fairly low radio frequency.
However, since it consists of a pulse followed by damped sine waves, multiples or harmonics of the ringing frequency are present. Thus, the signal may also be injected into r-f or i-f circuits of radio receivers.
A pulse has particularly strong harmonics if it is a narrow pulse. The way in which a pulse is built up from harmonics is depicted in Fig. 6-18. Harmonic voltages become weaker at higher frequencies. However, even the higher harmonics have appreciable voltage if the pulse is quite narrow. This is because the width of the pulse is inversely proportional to the strength of the higher harmonics. The buildup shown in Fig. 6-18 is for a comparatively wide pulse. If harmonics up to the 30th were added, the resultant waveform would be as narrow as the initial pulse seen in Fig. 6-17.
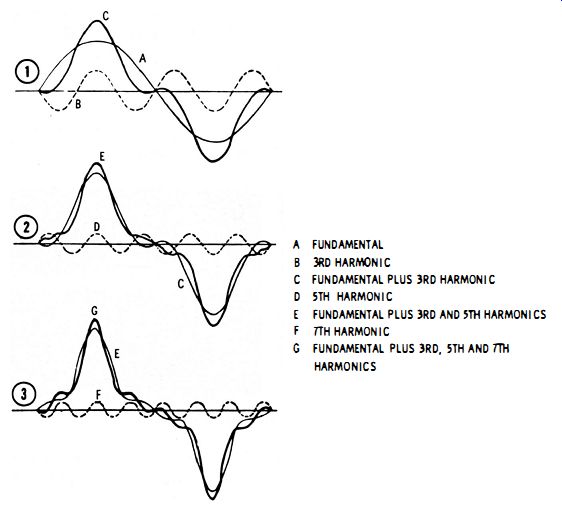
Fig. 6-18. Partial build-up of a pulse from sine-wave voltages.
RADIO TEST SETS
Still another type of specialized signal generator is termed a two-way radio test set. The circuit for a typical instrument is shown in Fig. 6-19. It comprises two transistorized oscillator sections, and a germanium diode which operates as a mixer-modulator and an instrument rectifier. T1814 utilizes a ...
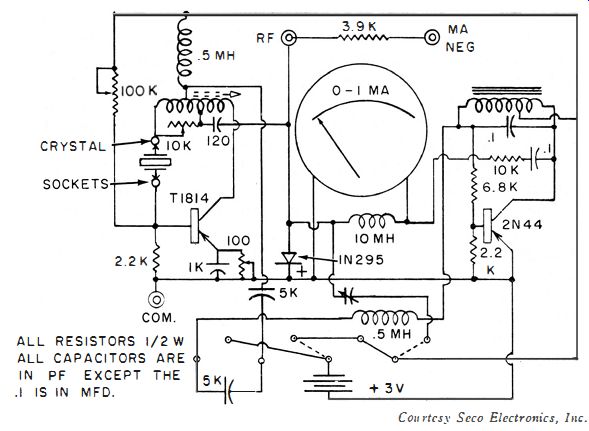
Fig. 6-1 9. A two-way radio test set is a specialized signal generator.
... high-frequency type of transistor which operates in one of two modes, depending on the setting of the selector switch. The 2N44 transistor operates as an audio oscillator. Its output amplitude-modulates the r-f oscillator. The carrier frequency depends on the quartz crystal which is plugged into the crystal socket. This amplitude-modulated signal can be used for injection tests. When the modulating signal is switched off, the r-f signal can be used for calibration of signal generators.
A milliammeter is provided to test quartz crystals for activity. The high-frequency transistor operates as a third overtone (third harmonic) generator, in the same manner as tube oscillators used in most CB transmitter circuitry. Meter readings are proportional to the Q of the crystal which is plugged into the crystal socket. In other words, the higher the reading, the more active is the crystal . In this mode of operation, the tank circuit is broadly tuned for operation in the 26 to 28 mhz range. When the circuit is switched to operate as an untuned oscillator. operation is possible with crystals over a range of 1 to 20 mhz. The output has a considerable harmonic spectrum, which is useful in calibration of signal generators, as explained previously.
It is interesting to note some basic facts concerning quartz crystals used in generators. The thickness of a crystal determines its oscillating frequency. One of the most popular crystals is the He 6/U, in which the crystal plate is ground to a thickness of about 0.006 inch. Its fundamental frequency is 9 mhz, which provides 27 -mhz third-overtone operation. However, the output also varies with the type of cut and the plate area. Larger crystals provide more output and can dissipate more power. The He 6/U is either gold or silver plated. Plated surfaces serve as electrodes, to which leads are connected.
To insure maximum accuracy of the generated frequency, a fundamental type of crystal is customarily utilized. Harmonics can be used for checks at higher frequencies, and the percentage of accuracy of the harmonics will be the same as the percentage of accuracy of the fundamental. This accuracy is a function of the generator circuitry even when the crystal oscillates in its fundamental mode. Hence, when the highest possible accuracy is desired, a crystal that has been specially ground for operation in the generator circuit should be utilized.