by WEYSEL OMER
As far as we know this is the only implementation of multidimensional signal processing concepts on a microcomputer of BBC proportions.
above: DISCRETE TRANSFORMS: The image g(x,y) is a function whose instantaneous
amplitude is related to the brightness at the point x,y as on a monochrome
Appending the discussion on computing Fourier transforms, this article describes a means for the transformation of two-dimensional data for the BBC microcomputer, based on the FFT implementation detailed in the June and July issues of this journal. Applications relate extensively to image processing and to 2D systems frequency domain analysis.
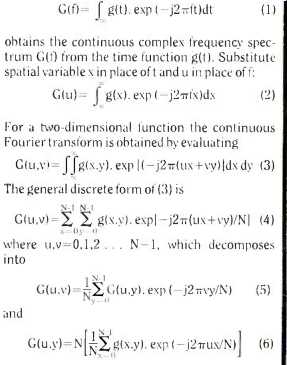
To process multidimensional signals using the Fourier transform, the general interpretation of the classical equations expressing it has to be modified somewhat. Consider the substitution of a spatial variable, x in place of t, and the substitution of a spatial frequency variable, u in place of f. In the expression for the continuous complete frequency spectrum (equations 1&2). The perspective of the analysis is altered from a signal varying in time to a signal varying in space.
An image is an example of a two-dimensional function which varies in the planes of two spatial variables: its continuous Fourier transform is obtained by evaluating equation display. For all but the very simplest of images (e.g. a white square on black background), the solution of equation 3 is impossible. As in the case with the one-dimensional Fourier transform, the function can be sampled and quantized at discrete values of x and y (as shown in Fig.1 for N=8), and a general discrete form equation 3 applied--the two-dimensional discrete Fourier transform (2DFT), equation 4. It can easily be shown that it decomposes into two successive applications of 1DFTs as equations 5 & 6. Hence, the solution of the discrete form (4) first requires the computation of G(u,y) corresponding to the 1DFTs of N rows in the image, g(x,y). The overall results are obtained from the solution of equation 5 i.e. the DFTs of the columns of G(u,y).
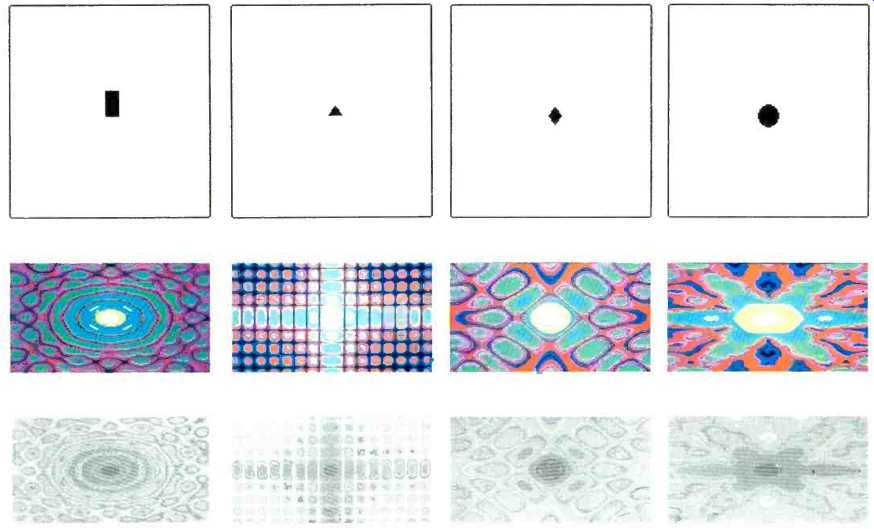
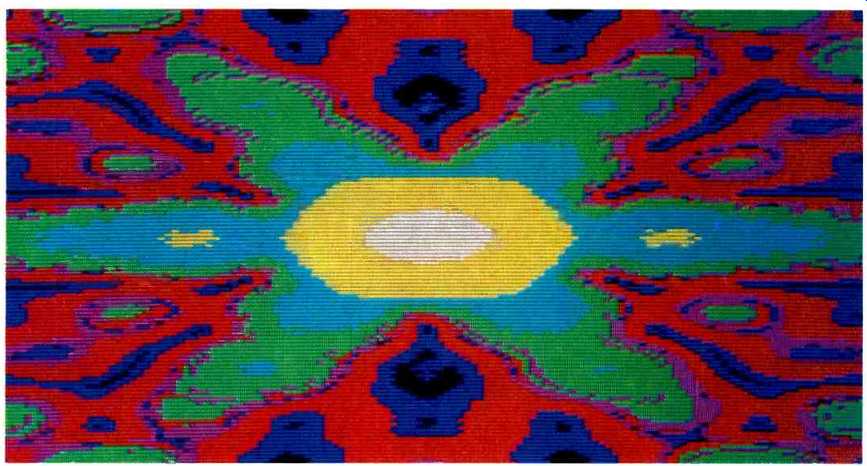
above: Two-dimensional Fourier transformations obtain the spectral content
of image scenes. Transformations of simple shapes shown in pseudo-color form
give the grey-scale effect shown when viewed on a black and white monitor.
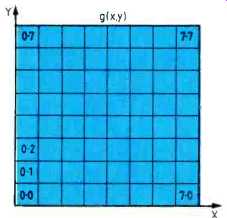
Fig.1. Representation of a digital image in matrix form with each picture element
defined as a coordinate in the matrix.
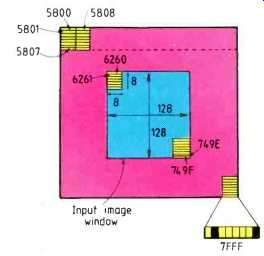
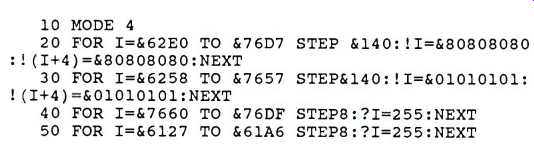
Fig. 2. Boundaries of the window within which an input image must be positioned
in the BBC mode 4 screen memory.
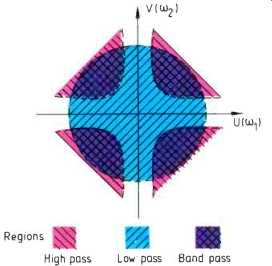
Fig.3. Low-pass, high-pass and bandpass regions in a frequency domain transformation,
with the mean brightness level of the original image given by the amplitude
for the central ( d.c.) component.
IMPLEMENTATION
The FFT algorithm was incorporated to compute equations 5 & 6 for N=128 i.e. an image of 128 by 128 picture elements. The form of g(x,y) was that of a binary image (black and white only), placed in a defined window in the BBC mode 4 screen. Row transforms are computed and the results stored in a file on disc. Due to inherent data transfer problems in obtaining column elements on disc-based systems, it is necessary to transpose the matrix corresponding to G(u,y) so that the file is stored column-wise.
Results of the DFTs of the columns (using the FFT) are then stored back in the original files as G(u,v). The form of the 2D results are complex and therefore a choice of representations is available. This implementation uses the energy function, defined as
E(u,v)=Re2(u,v)+ Im2(u,v).
This is computed for each row of G(u,v) and stored in the same disc file as E(u,v). To analyze visually the 2D Fourier transform results which appear themselves as 3D, the mode 2 color screen of the BBC was utilized. A window of 128 by 128 color elements allows the representation of E(u,v)
as a 'plan view', where each element corresponds to a frequency harmonic whose amplitude is color coded. The code is chosen so that the relative amplitudes appear on a grey scale when viewed on a monochrome display: highest amplitudes appear white, lowest black, and mid values, a relative grey.
Examples of transformed images are shown.
USING THE ROUTINE
-------------
LISTING
-------------
Firstly, the input routine to the program presented was arranged to process binary (mode 4) images: significant alterations would be necessary to transform grey-scaled images. The routine, although written entirely in machine language, executes in around 45 minutes and necessitates a disc arrangement able to accommodate a 128K data file.
The 2DFT is loaded with 'LOAD F’ which is an assembled 4K object file which must be loaded prior to each image transformation.
The following should then be carried out to perform a transform.
Initialize the mode 4 screen and establish a binary image (by a high-level language program or via a vision system) within the bounds of the spatial domain window defined in Fig. 2. The listing above generates a frame defining the window and if the image is software generated, the relevant program steps could be included in the same program.
Load (formatted) disc capable of holding a file of 128K. 'FFT.DAT' as this is the generated transform filename and would thus overwrite previously stored data. It follows that the results of only one transform can be stored on one disc.
Begin transformation by typing CALL,&1c3E
After approximately 45 minutes, a file containing the 21) Fourier coefficients has been created. The color encoding display routine executes automatically, plotting a white screen since threshold registers are initially cleared. These may be set using a program as follows:
10 !&2200=150000000
20 !&2204= 10000000
30 !&2208= 1000000
40 !&220C=100000
50 !&2210=55000
60 !&2214=8000
70 !&2218=300
This may be saved on the same disc as the image transform file. The levels, which initiate amplitudes of the grey-level scaling, may be varied appropriately to obtain the required color definition in the frequency domain image. After execution of the above threshold initialization, the display routine may be called with CALL &ICCA. The register contents may be altered and the display routine executed until a satisfactory result is obtained whereupon the frequency domain image may be screen-dumped or saved on disc.
APPLICATION
The interpretation of transforms in terms of the 21:1 frequency spectrum is given in Fig.3.
The presence of sharp points or corners in the input image manifests itself as significant high frequency components in the Fourier domain. Any periodicity which may not be discernible in the original image, is easily detected once transformed. Statistics relating to an image may also be readily obtained, i.e. average intensity. Removal of blurring in an image of enhancement of certain features may be achieved via filtering and reconstruction using the inverse transform. Current uses of 2DFTs are in such areas as Landsat image analysis, magnetic resonance imaging, Fourier optics and filter design. However, real-time image analysis (pattern recognition) for use in such applications as robotic vision systems is served by 11) transforms on edge-detected boundaries of objects in view. Such classification is obtained by the use of Fourier descriptors and Hough transforms (see Pratt) besides others.
Equations
The equation G(f)= f g(t). exp (-j2irft)dt obtains the continuous complex frequency spectrum G(f) from the time function g(t). Substitute spatial variable x in place oft and u in place of f: G(u)= f g(x). exp (-j2’rrfx)dx (2)
Further reading
Digital Image Processing, by R.C. Gonzalez and P. Wintz, Addison-Wesley.
Digital Image Processing, by W.K. Pratt, Wiley.
Multidimensional Digital Signal Processing, by D.E. Dudgeon and R.M. Mersereau. Prentice Hall.
----
Digital Signal Processing, edited by N.B. Jones, Peter Peregrinus.
Weysel Omer graduated from Brighton Polytechnic earlier this year and is engaged on a PhD program in the 'engineering applied to medicine' group at Imperial College, London University. This article, along with his previous ones in the June, July 1986 issues, constitutes part of his final year undergraduate project supervised by Graeme Awcock.
------------
Also see: A series of remarks on Fourier
==========
(adapted from: Wireless World , Dec. 1986)