The ear's hearing organ is too small to model mechanically. But an electrical equivalent mimics its behavior well enough to provide a useful study tool.
R.W. GUELKE, J.P. RAMACKERS AND A.E. BUNN
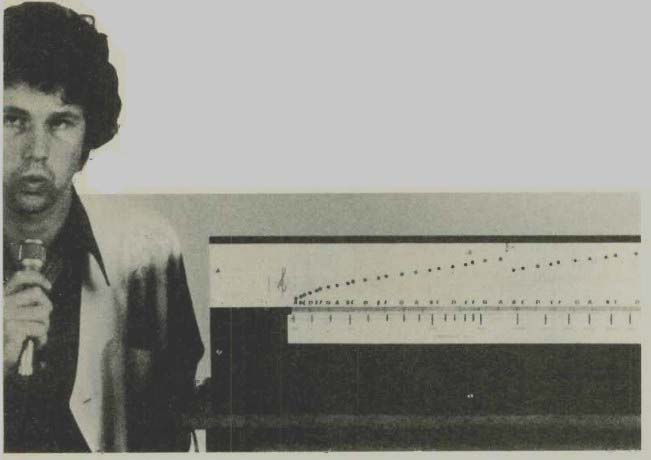
------- Using the model: leds reveal the excitation at each stage.
Our sense of hearing can distinguish between sounds of different frequencies with a high degree of accuracy. The mechanism responsible for this frequency discrimination is understood to be the shell like structure known as the cochlea.
It consists of two galleries or tubes -- the scala vestibuli and the scala tympani-separated by an elastic membrane known as the basilar membrane. Incoming sounds vibrate the tympanic membrane (eardrum) and the ossicles (malleus, incus and stapes) and these in turn excite vibrations at the oval window of the cochlea. These sound waves then proceed towards the helicotrema, the opening between the two galleries at the end of the cochlea (Fig.1). It has been established that high audio frequencies excite the basilar membrane close to the stapes end of the cochlea whereas low audio frequencies excite the membrane near the helicotrema.
Recently the pattern of vibrations along the cochlea has been determined and demonstrated on a mechanical model. The mathematical treatment involves the use of electrical-acoustical analogies, transmission line theory and the idea of transverse resonance.
This mechanical model was larger than the cochlea and so its frequency range was correspondingly lower. A mechanical model to cover the same range as the cochlea would have to be approximately the same size as the cochlea itself. This would present problems that would be difficult if not impossible to solve.
However, the action of the cochlea can also be demonstrated by a model in which the mechanical and hydraulic quantities are replaced by their electrical equivalents. Such a model can be designed to cover the range of frequencies perceived by the ear yet does not need to be the size of the cochlea.
To cover the audible range it is necessary to replace the continuous line by a number of lumped impedances. This can be done by dividing the cochlea into a number of sections and replacing each section by an electrical circuit which corresponds to the mechanical or hydraulic system of that particular section.
ELECTRICAL-ACOUSTICAL EQUIVALENTS
Before developing an electrical model it is necessary to choose the equivalents that are to be used and to establish a numerical relationship between them.
Equivalents for an element delta_x (Fig.2) are given on the initial assumption that we are dealing with a continuous system. The element can then approach the infinitesimally small element dx and the usual methods of the calculus apply. Figure 2 also shows differential equations applicable to both systems, from which the correspondence between the quantities chosen is obvious.
If lumped impedances are to be used the element ix will be finite and each section will be represented by a number of individual capacitors, inductors and resistors, forming a circuit which can be dealt with using normal circuit theory. Each section will consist of:
1. An inductor L1 to represent the series inertance of the galleries. Using the definition of inertance as:
mass/area
this will be […]
… where p is the density of the liquid in the galleries (endolymph and perilymph); A1 and A2 are the cross section of the scala vestibuli and the scala tympani at the point in question.
2. A capacitor C to represent the compliance of the basilar membrane equal to C delta x. C is the volume compliance per unit length and according to Bekesy can be represented approximately by the expression C=5.1 x 10^-11 exp 0.01355x where x is the distance from the stapes end of the cochlea (meters).
3. An inductor L2 to represent the transverse inertance proportional to 1/delta x and given by the following expression:
pn 2ar(r22 x21)2{r241nri-4x24+r22r12-4r14
The same expression calculated using r2 corresponding to A2:
r1 2- r2- V R-+r2 n=29
0 is the angle subtended by equivalent sector (radians) W the width of basilar membrane, and A1, A2 the cross section of each gallery.
4. Resistance associated with each inertance (neglected).
5. A conductance to represent losses in the compliant element (hysteresis losses).
TABLE 1: hydraulic quantities and their electrical equivalents.
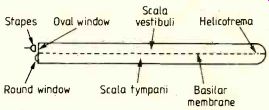
Fig.1. Diagrammatic representation of the unwound cochlea.
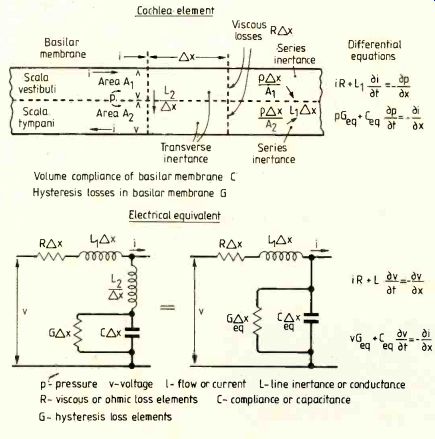
Fig.2. Elements of a section of the cochlea and their electrical equivalent.
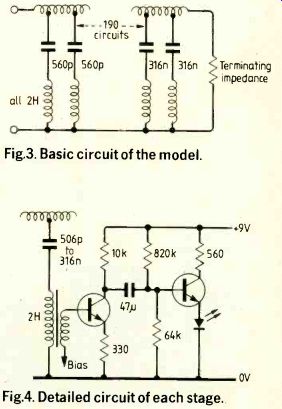
Fig.3. Basic circuit of the model.
Fig.4. Detailed circuit of each stage.
DESIGN OF THE ELECTRICAL MODEL
The larger the number of sections in the design, the closer it will be to conditions in the cochlea itself. The structure of the cochlea involves over 4000 sections if the arches of Corti represent discrete elements.
A compromise has to be reached so that the essential behavior of the model is comparable to the cochlea.
Previous models have used 40 to 65 sections 1.6 and have recorded the distribution of voltages in accordance with the place theory, i.e. high frequencies exciting the sections at the stapes end and low frequencies towards the helicotrema end. If, however, this circuit is examined more closely it will be seen that the individual sections act as low pass filters, producing an analysis of the incoming signal which is not related to the way in which the cochlea works.
It can be estimated that to avoid any effect due to low pass filter action for frequencies up to 5000Hz, at least 100 sections should be used. A model similar to the one described here used 175 sections. Details of the magnitude of the individual components were not given, however, and so no comparisons can be made.
For the model described in this article 190 sections were used; this number also provides for adequate resolving power. If the range chosen is from 200 to 5000Hz, or 4.6 octaves, we have about 3.4 stages for every semitone.
CHOOSING THE ELECTRICAL COMPONENTS
Deciding the number of stages establishes the equivalent electrical components for each stage. It has been shown that all the elements in the cochlea vary from the stapes end to the helicotrema end. However, the main variation is provided by the variation in volume compliance due to the varying width of the basilar membrane.
For simplicity we ignored the variations in series inertance and transverse inertance and chose a mean value of these two parameters. Only the equivalent of the volume compliance was varied. Bekesy measured a ratio of about 100:1 for the volume compliance from the stapes to the helicotrema.
In the model a larger ratio of 575:1 was used for the corresponding capacitors, to extend the response down to about 200Hz.
Having chosen the number of stages to be used and the ratio of capacitors over the range there is one more arbitrary choice to be made concerning the electrical equivalents. If the chosen range of frequencies is to be covered, the ratio of the capacitors to the inductors is determined. An arbitrary choice has still to be made of either a capacitor chosen to be the equivalent of a particular compliance or an inductor to be the equivalent of a particular inertance. Table 2 indicates the actual values selected. Parameters for the cochlea are taken from measurements on the geometry of the cochlea and from Bekesy's measurements of the volume elastically of the basilar membrane. No measurements of the losses in the cochlea are available. It was assumed that the resonances were associated with a Q factor of about 20. This factor was easily achieved for the inductances representing the transverse inertance. Figure 3 gives the basic circuit used in the model and Fig. 4 shows the detailed circuit.
The choice of a particular equivalent inductance for the transverse inertance and the consequent choice of capacitors to provide resonance corresponding to the audio range then determines the characteristic resistance of the line. To avoid reflections the line was terminated by a resistor equal to the characteristic resistance of the last section, given by L1 If resonance occurs before the end of the line, the attenuation after the point of resonance is so great that reflections are of no consequence and the termination of the line is unimportant.
TRANSVERSE RESONANCE
In previous models the transmission line representing the cochlea consisted of series inductances and shunt capacitances only. An inductance in the shunt arm was omitted altogether.
Calculation of shunt inductors to simulate the shunt inertance at any particular point has shown that these shunt inertances are due mainly to liquid loading: combined with the volume compliance at the point of question, this produces a resonance which explains the function of the cochlea as a frequency analyzer.
In addition to this liquid loading the mass of the basilar membrane will also contribute to the transverse inertance. This mass, however, contributes much less than the liquid loading and for this model it is neglected.
Note that this inertance is inversely proportional to delta_x whereas the volume compliance is proportional to Ax. The frequency of resonance is therefore independent of the element of length that is being considered but will vary along the cochlea depending on the variation of the volume compliance from one end to the other. Bekesy, as mentioned previously, found a variation of 100 to 1 in the volume compliance when processing from the stapes to the helicotrema. It is quite possible that even larger variations exist because Bekesy carried out his measurements on cadaver specimens and during life there may be differences.
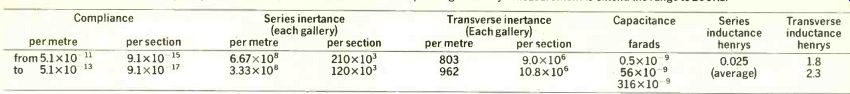
---------TABLE 2: parameters of the cochlea and (right) electrical equivalents
used in 190-section model. Note that the values of inertances per section
are double the values for each gallery. Capacitance at the low frequency
end was increased above the value corresponding to Bekesy's measurement
to extend the range to 200Hz.
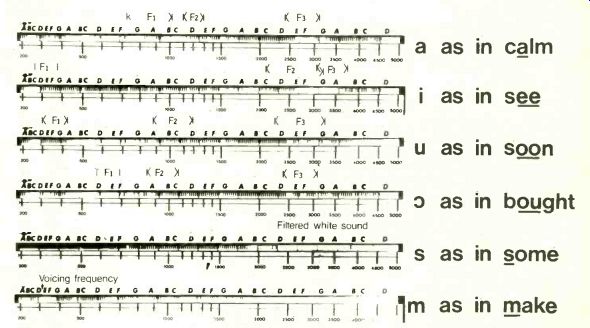
Fig. 5. Speech sounds recorded on the model. Formant regions F1, F2
and F3 indicated for the vowels concerned. Although these regions are
not precisely coincident with the observed patterns, the general agreement
is clear.
Other investigators have suggested, however, that this ratio should be increased. There is therefore some justification for the increase which has been chosen for the model.
PRACTICAL DESIGN
In this electrical model a light-emitting diode display indicates the response at each section to the incoming excitation. It was found necessary to incorporate an amplifier so that the inductors did not have to carry currents which would run into the non linear region of their magnetic cores.
The 190 sections (Fig.4) were accommodated on 12 printed circuit boards. The leds were placed in line so that a frequency analysis of any complex sound could be observed.
RESULTS
The model demonstrates effectively the various patterns of excitation which are to be expected from different sounds. Figure 5 illustrates these patterns: the formant pat terns of the various vowels are clearly indicated and the filtered white noise from the sibilants is also clear. It is interesting to follow the pattern produced by a soprano voice from a recording. The vibrato which is normally used plainly visible.
An instrument of this type could probably be used effectively in voice training, particularly for the hard-of-hearing.
Professor Guelke and colleagues are in the ear, nose and throat department, Faculty of Medicine, at the University of Stellenbosch, Tygerberg, South Africa.
1. Bauch, H. (1956) Die Schwingungsform der Basilarmembran bei Erregung durch Impulse and Geráusche, gemessen an einem elektrischen Modell des Innesnohres. Frequenz, 222-234
2. Bekesy, G.von: (1941) Uber die Elastizitát der Schneckentrennwand des Ohres Akust. Zeits.6; 265-278 (1948) On the elasticity of the cochlear partition J. Acoust. Soc. Amer. 20; 227-241 (1960) Experiments in Hearing. McGraw Hill.
3. Bogert, B.P. (1951) Determination of the effects of dissipation in the cochlear partition by means of a network representing the basilar membrane. J. Acoust. Soc. Amer. 23; 151-154.
4. Bunn, A.E. and Guelke, R.W. (1983) Mechanics of a cochlea model. Acustica 53; 237-249.
5. Guelke, R.W. and Guelke, C.B. (1960) An electrical model of the cochlea. Third International Conference on Medical Electronics, 368-369.
6. Guelke, R.W. and Bunn, A.E. (1981) Resonance in the travelling wave theory of hearing. Acustica 48; 260-264.
7. Lighthill, J. (1981) Energy flow in the cochlea. J. Fluid. Mech. 106; 149-213.
8. Peterson, L.C. and Bogert, B.P. (1950) A dynamical theory of the cochlea. J. Acoust. Soc. Amer. 22; 369-381.
9. Steele, C.R. (1976) Cochlear mechanics: in Handbook of Sensory Physiology (ed. W.D. Keidel and W.D. Neff-Springer) vol.3, 443-478.
---------
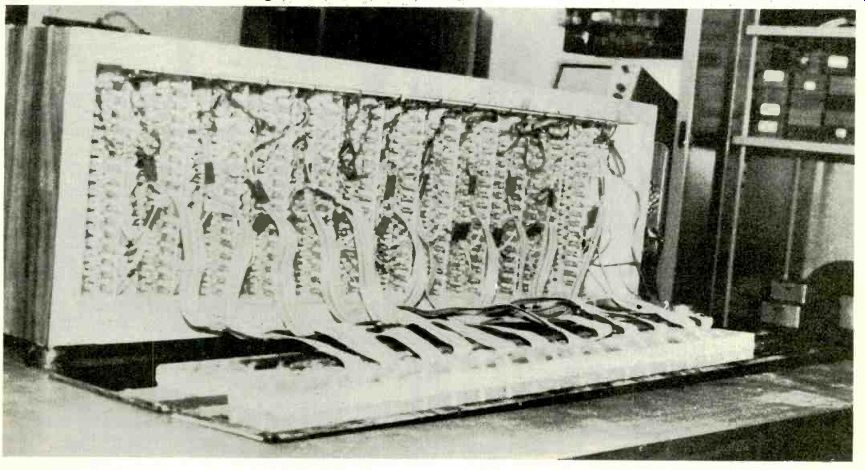
Behind the panel: 190 sections over a range of 4 1/2 octaves,
200-5,000Hz.
------------
Also see: Video frame store
==========
(adapted from: Wireless World , Jan. 1987)