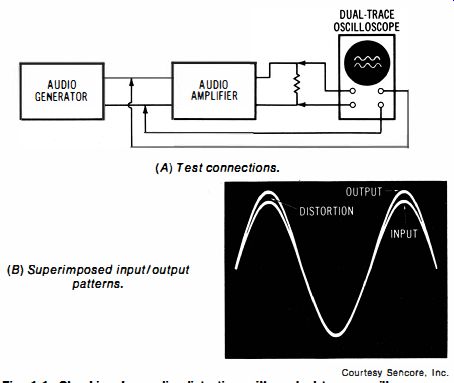
Fig. 1-1. Checking for audio distortion with a dual-trace oscilloscope.
| Home | Audio mag. | Stereo Review mag. | High Fidelity mag. | AE/AA mag. |
1-1. To Check for Amplifier Distortion With a Dual-Trace Oscilloscope
Equipment: Audio Oscillator.
Connections Required: Connect audio oscillator output cable to input terminals of amplifier. Connect power resistor of suitable value across amplifier output terminals. Connect oscilloscope "A" channel across amplifier input terminals, and connect oscilloscope "B" channel across amplifier output terminals, as shown in Fig. 1-1 . Procedure: Advance output level from audio oscillator to obtain maximum rated power output from the amplifier. A basic distortion test is made at a frequency of 1 kHz. Adjust channel A and B gain controls to obtain patterns of equal height. Adjust the positioning controls to superimpose the two waveforms.
Evaluation of Results: If the two waveforms superimpose perfectly, the amplifier is practically distortionless. On the other hand, when there is a discrepancy between the two patterns, as shown in the diagram, the amplifier is distorting. If the output pattern "writhes" when the audio oscillator is set to 59 Hz or 119 Hz, hum voltage is present.

Fig. 1-1. Checking for audio distortion with a dual-trace oscilloscope.
(A) Test connections. (B) Superimposed input / output patterns. Courtesy Sencore, Inc.
NOTE 1-1 Basic Controls of Dual-Trace Oscilloscope
A dual-trace oscilloscope uses triggered sweep, with the basic controls shown in Fig. 1-2. Some dual-trace scopes have separate time bases for the vertical channels. The foregoing distortion test must be made with both traces swept at the same speed. This distortion test can be made, if desired, with a conventional oscilloscope supplemented by an electronic switch.
-----------
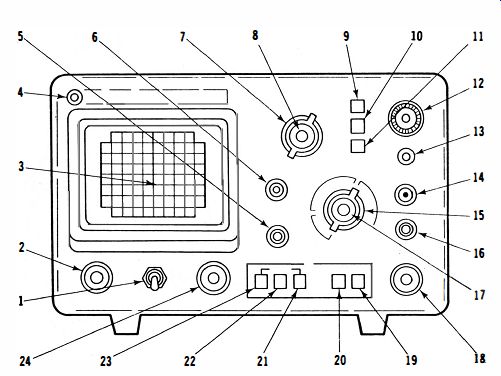
Fig. 1-2. Basic controls of a dual-trace oscilloscope.
-------------
1. POWER ON-OFF toggle switch.
1- VOLTS/DIV switch. Vertical attenuator. Coarse adjustment of vertical sensitivity. Vertical sensitivity is
Applies power to oscilloscope.
2_ INTENSITY control. Adjusts bright- calibrated in
11 steps from 0.01 to ness of trace.
20 volts per division when VARIABLE
8 is set to the CAL position.
3. Graticule. Provides calibration marks for voltage and time measurements.
8_ VARIABLE control. Vertical attenuator adjustment. Fine control of
4_ Pilot lamp. Lights when power is vertical sensitivity. In the extreme applied to oscilloscope. clockwise ( CAL) position. the vertical attenuator is calibrated
5_ .? POSITION control. Rotation adjusts horizontal position of trace.
9_ AC vertical input selector switch.
Push-pull switch selects 5X magnifi-
When this button is pushed in the cation when pulled out; normal when dc component of the input signal pushed in . is eliminated.
6_ .. POSITION control. Rotation • 3adjusts vertical position of trace.
10. GND vertical input selector switch.
17. VAR/HOR GAIN control. Fine When this button is pushed in the sweep time adjustment (horizontal input signal path is opened and the gain adjustment when SWEEP vertical amplifier input is grounded. TIME/DIV switch
15 is in EXT This provides a zero-signal base line. position). In the extreme clockwise the position of which can be used as position ( CAL) the sweep time is a reference when performing dc calibrated.
measurements.
18. TRIG LEVEL control. Sync level
11. DC vertical input selector switch. adjustment determines point on When this button is pushed in the ac waveform slope where sweep starts.
and dc components of the input
In fully counterclockwise (AUTO) signal are applied to vertical amplifier. position. sweep is automatically synchronized to the average level
12. V INPUT jack. Vertical input. of the waveform.
13. f terminal. Chassis ground.
19. TRIGGERING SLOPE switch.
Selects sync polarity (+). Button
14. CAL SL jack. Provides calibrated pushed in. or (-). button out.
0.8 V pop square wave output at the line frequency for calibration of the
20. TRIGGERING SOURCE switch.
vertical amplifier. When the button is pushed in. INT. the waveform being observed is used
15. SWEEP TlME/DIV switch. Horizon-
as the sync trigger. When the button
tal coarse sweep time selector. is out. EXT. the signal applied to Selects calibrated sweep times of the EXT SYNC/HOR jack
16 is used
0.5 p. SEC/DIV to 0.5 SEC/DIV in as the sync trigger.
19 steps when VAR/HOR GAIN control
17 is set to CAL. Selects
21. TVV SYNC switch. When button is proper sweep time for television pushed in the scope syncs on the composite video waveforms in TVH vertical component of composite (television horizontal) and TVV video.
(television vertical) positions. Disables internal sweep generator and
22. TVH SYNC switch. When button is displays external horizontal input in pushed in the scope syncs on the EXT position. horizontal component of composite video.
16. EXT SYNC/HOR jack. Input terminal for external sync or external
23. NOR SYNC switch. When button is horizontal input. pushed in the scope syncs on a portion of the input waveform. Normal mode of operation.
24. FOCUS control. Adjusts sharpness of trace.
Courtesy B&K·Precision
Products 01 Dynascan
(A) Input waveform.
(c) A-B waveform.
(D) Vertically expanded A-B waveform.
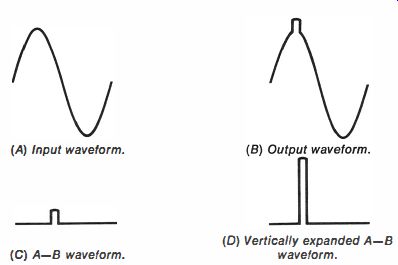
Fig. 1-3. Difference waveform consists of distortion products.
-------------
1-2. To Check for Amplifier Distortion With a Differential-Input Scope
Equipment: Audio oscillator.
Connections Required: Same as in Fig. 1-1.
Procedure: Drive the amplifier to maximum rated power output at 1 kHz. Adjust channel A and. B gain controls to obtain patterns with the same height. Then switch the oscilloscope for A-B display.
Evaluation of Results: If a straight horizontal line is displayed on the scope screen, the amplifier is practically distortion-less. On the other hand, if any waveform is displayed, the amplifier is distorting, as exemplified in Fig. 1-3.
NOTE 1-2
Vertical Expansion of Distortion Pattern
Small values of distortion are difficult to "see" unless the distortion waveform is expanded vertically on the scope screen. To do so, supplement the foregoing procedure by advancing the gain of both channels to maximum. Then, adjust the vernier gain control of one channel to Fig. 1-4. A modem oscilloscope that provides dual-channel displays and a choice of A -B or A + B patterns.
minimize the amplitude of the expanded pattern. Any residual waveform that cannot be cancelled by adjustment of the vernier gain control is a distortion waveform.
NOTE 1-3 Input/Output Phase Relations
In the foregoing example, the amplifier input and output waveforms have the same phase reference. However, an amplifier is equally likely to have an output waveform that is 180· out of phase with the input waveform. In such a case, check the distortion products by switching the oscilloscope for A+B display. In other words, when -B is added to +A, the result is the same as subtracting +8 from +A. 1-3. To Check for Amplifier Distortion With Lissajous Patterns
Equipment: Audio oscillator.
Connections Required: Connect output from audio oscillator to the input of the amplifier and to the horizontal-Input terminals of the oscilloscope. Connect a suitable power-type resistor across the amplifier output terminals and to the vertical-input terminals of the oscilloscope, as shown in Fig. 1-5.
Procedure: Drive the audio amplifier to maximum rated output at 1 kHz, and adjust scope controls to display a diagonal line on the screen.
Evaluation of Results: If the displayed diagonal line is precisely straight, the amplifier is practically distortionless. On the other hand, a curved line indicates the presence of amplitude distortion.
NOTE 1-4 Amplifier Test Frequencies
It is standard practice to make audio amplifier tests at a frequency of kHz. However, more complete data can be obtained by repeating a test at a low frequency such as 20 Hz, and at a high frequency such as 20 kHz. To measure the power output from an amplifier, use the formula: where, E is the rms output voltage, E' Watts = If R is the ohmic value of the resistor connected across the amplifier output terminals.
(A) Test setup.
(B) Curved Lissajous line indicates amplifier nonlinearity.
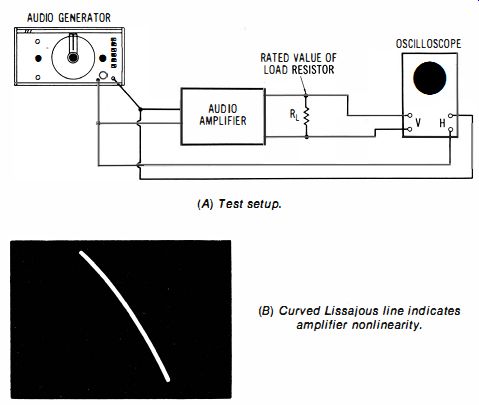
Fig. 1-5. Distortion test.
The rms output voltage is equal to the peak-to-peak output voltage multiplied by 0.354 (scopes are generally calibrated to read peak-to-peak values). Note that the oscilloscope amplifiers should have better characteristics than the amplifier under test. On the other hand, the audio oscillator can have more distortion than the amplifier under test, and the Lissajous pattern will still be precisely straight if the amplifier is distortionless.
1-4. To Check Amplifier Phase Shift With Lissajous Patterns
Equipment: Audio oscillator.
Connections Required: Connect output from audio oscillator to input of amplifier and to horizontal-input channel of oscilloscope. Connect output of amplifier to a suitable load resistor and to the vertical-input terminals of the scope, as shown in Fig. 1-6.
Procedure: Operate generator near the low-frequency cutoff point of the amplifier; adjust scope controls to obtain a centered Lissajous figure, as exemplified in the diagram. Then tune generator near the high-frequency cutoff point of the amplifier, and observe the resulting Lissajous figure.
(A) Test setup.
Note that if an inductive impedance causes the eIlipse to lean to the left, a capacitive impedance will cause the ellipse to lean· to the right.
(B) Phase-angle shift is equal to arc-sin MI N.
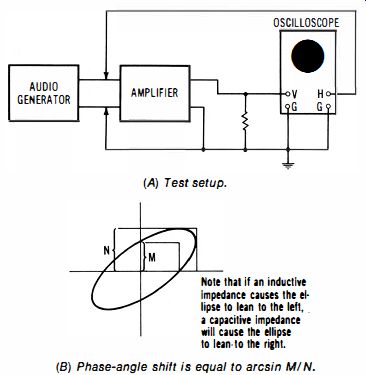
Fig. 1-6. Phase measurement of amplifier input/output relation.
Evaluation of Results: The phase-shift angle is equal to the angle whose sine (arc-sin) has the value MIN, where M and N are the pattern excursions indicated in the diagram.
NOTE 1-5
Phase Shift Versus Test Frequency
An audio amplifier generally exhibits increasing phase shift from input to output as the test frequency approaches a cutoff value (-3 dB point). The amplifier will normally have zero phase shift at midband.
If the amplifier is completely dc coupled, it will normally have zero phase shift at low frequencies, and will not exhibit a low-frequency cutoff point.
Excessive phase shift at the band limits can lead to positive feedback via negative feedback loop(s) , and thereby contribute to amplifier instability.
When excessive phase shift occurs, look for defective capacitors; a faulty transistor can also introduce excessive phase shift. Note that this method of phase measurement assumes that the pattern is a true ellipse (that both of the input waveforms to the scope are pure sine waves). If waveform distortion is present, the accuracy of phase measurement will be impaired.
1-5. To Display Amplifier Distortion Products With a Conventional Scope
Equipment: Audio oscillator and harmonic distortion meter.

Fig. 1-7. Display of amplifier distortion products with a conventional scope.
Connections Required: Connect equipment as shown in Fig. 1-7.
Procedure: Tune audio oscillator for 1-kHz output, and drive amplifier to maximum rated power output. Tune harmonic distortion meter to reject the test frequency. Adjust scope controls to display the distortion products from the amplifier on the crt screen.
Evaluation of Results: The distortion pattern will show whether the distortion products consist chiefly of second-harmonic or third-harmonic, 60-Hz or 120-Hz hum, noise, or sum-and-difference voltages. In turn, the scope pattern provides helpful clues concerning the nature of the fault that is causing an abnormally high percentage of distortion. Note that this test method requires that the audio oscillator output have less distortion than the amplifier under test. Otherwise, the distortion in the audio-oscillator waveform will be falsely charged to the amplifier under test.
1-6. To Check an Amplifier for Music-Power Capability
Equipment: Pulse generator.
Connections Required: Connect output of pulse generator to input of amplifier. Connect a load resistor of suitable value across the amplifier output terminals and to the vertical-input channel of an oscilloscope, as shown in Fig. 1-8.
Procedure: Set the pulse generator for a pulse width of 1 millisecond and a repetition rate of 100 pulses per second. Advance the output from the generator until the top of the displayed pulse begins to show evidence of tilt. Then, back off slightly on the generator output amplitude.
Evaluation of Results: The music-power capability of the amplifier is equal to:
(A) Test setup. (B) Undistorted output pulse. (C) Distorted output pulse.
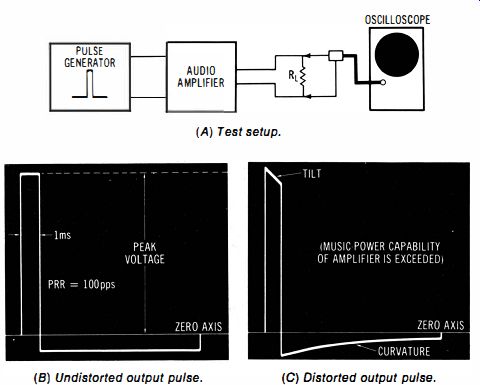
Fig. 1-8. Pulse test of hi-fi amplifier for determination of music-power capability.
where, Ep is the peak voltage of the displayed pulse, RL is the value of the load resistor.
NOTE 1-6 Basis of Music-Power Capability
The music-power capability of an amplifier relates to its ability to reproduce sudden tonal surges or transient peaks that exceed the sine-wave (rms) capability of the amplifier's power output. The music-power capability of an amplifier is always greater than its rated power output value. The music-power value is primarily dependent upon the amount of dc power that is stored in the filter-output capacitors. In other words, a high-amplitude pulse demands a power surge that cannot be steadily maintained by the rectifier-filter system.
1-7. To Check the Square-Wave Response of an Amplifier
Equipment: Square-wave generator.
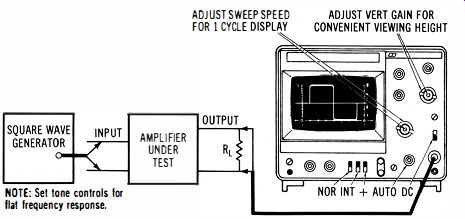
Fig. 1-9. Test setup for square-wave response.
Connections Required: Terminate amplifier in the rated load resistance and connect instruments as shown in Fig. 1-9.
Procedure: Drive amplifier to maximum rated power output at 1-kHz repetition rate. Note that the power output from the amplifier is equal to: where, Ep is the peak voltage of the square wave, RL is the value of the load resistance.
Observe the displayed waveform.
Evaluation of Results: An amplifier normally displays a virtually undistorted square-wave response at 1 kHz. Some manufacturers also rate their amplifiers for square-wave distortion at 20 Hz, and at 20 kHz. In typical designs, more or less tilt becomes evident at 20 Hz, and noticeable corner rounding appears at 20 kHz. Significant departure from rated square-wave response indicates a component or device defect in the amplifier network (Fig. 1-10).
NOTE 1-7: Significance of a Ringing Frequency
The ringing frequency in a reproduced square wave identifies the section or branch of an amplifier which has the highest Q value in the system, and which has Land C values that correspond to the ringing frequency. A circuit or section will ring if its associated resistance is sufficiently small that the configuration is underdamped. The ringing frequency in a reproduced square wave can be measured with a triggered-sweep scope. If the frequency-response curve of an amplifier has a hump or peak, a reproduced square wave will ring at the peak frequency. The extent of ringing depends on how pronounced the peak excursion may be.
1-8. To Check the Power Bandwidth of an Amplifier
Equipment: Audio oscillator and harmonic distortion meter.
---------
INPUT SQUARE WAVE PHASE IS LEADING AT LOW FREQUENCIES FUNDAMENTAL FREQUENCY ATTENUATED A COMBINATION OF LOW-FREQUENCY ATTENUATION AND LEADING PHASE SHIFT FUNDAMENTAL FREQUENCY BOOSTED AN EXAMPLE OF CORNER ROUND-OFF AN EXAMPLE OF DIAGONAL CORNER ROUNDING IN SQUARE WAVE COMBINATION OF EXTENSIVE LOW-FREQUENCY ATTENUATION AND LEADING LOW-FREQUENCY PHASE SHIFT (DIFFERENTIATION) RINGING (WITH OVERSHOOT) OVERSHOOT COMBINATION OF EXTENSIVE HIGH-FREQUENCY ATTENUATION AND LAGGING LOW-FREQUENCY PHASE SHIFT (integration)
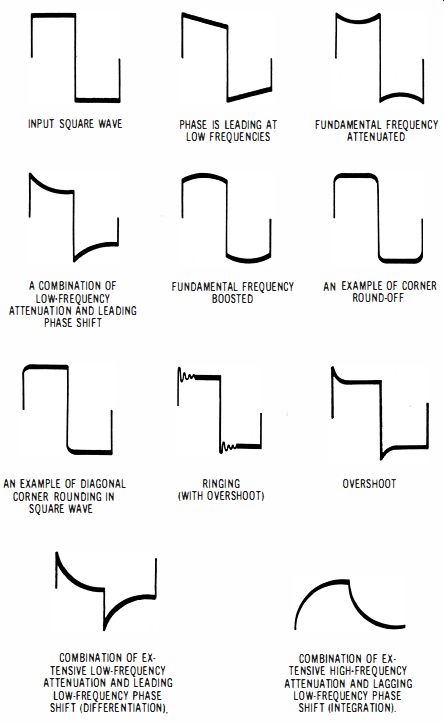
Fig. 1-10. Basic types of square-wave distortion.
-----------
Connections Required: Connect output from audio oscillator to input of amplifier under test. Terminate amplifier in its rated value of load resistance, and connect harmonic distortion meter across the load resistor. Connect oscilloscope at input of distortion meter, as shown in Fig. 1-11.
AUDIO OSCIUATOR OSCILLOSCOPE
• AUDIO AMPLIFIER
HARMONIC DISTORTION METER
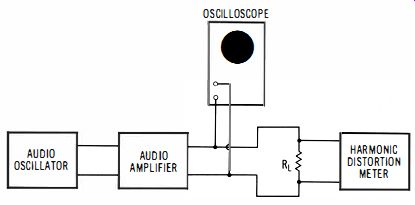
Fig. 1-11. Test setup for checking power bandwidth.
Procedure: Set audio oscillator to 1 kHz, and advance the input signal level to obtain maximum rated power output from the amplifier. Observe the percentage distort ion reading indicated by the harmonic distortion meter. Then, reduce the output from the audio oscillator until the scope shows 84 percent of the output voltage for maximum rated power output.
(This corresponds to three-quarters of maximum rated power output.) Vary the audio-oscillator frequency to determine the lower frequency and the upper frequency at which the amplifier now develops the same value of harmonic distortion as it did at 1 kHz when operating at maximum rated power output.
Evaluation of Results: The difference between the lower frequency and the upper frequency in the foregoing procedure is equal to the power bandwidth of the amplifier.
NOTE 1-8 Fidelity Versus Bandwidth
An amplifier generally has less distortion as its power output is decreased. At any output level, the distortion will increase as the test frequency approaches the high-frequency or the low-frequency cutoff point.
This is just another way of saying that the high-fidelity bandwidth of an amplifier (power bandwidth) increases as the power output is decreased.
As noted above, the standard power-bandwidth rating of an amplifier is specified at three-quarters of maximum rated power output. Crossover distortion is basically different from overload distortion, in that when crossover distortion is present, the corresponding percentage of distortion will increase as the amplifier's power output is decreased.
1-9. To Make a Stereo Separation Test
Equipment: Stereo signal generator.
Connections Required: Apply output from stereo generator to decoder (or to input of fm receiver). Connect the vertical input lead from the oscilloscope to the Land R channel outputs, in turn.
Procedure: Apply R signal to decoder, and check the outputs from the L and R channels. Then apolv an L signal to the decoder, and check the outputs from the Land R channels (Fig. 1-12). Evaluation of Results: Ideally, there would be zero output from the L channel when an R signal is applied, and vice versa.
In practice, separation is never perfect. A separation of 30 dB (a voltage ratio of approximately 32 times) is typical of high-quality stereo equipment.
1-10. To Measure the Output Resistance of an Amplifier
Equipment: Audio oscillator and two 8-ohm power-type resistors.
AUDIO COMPOSITE SIGNAL OR RF OUTPUT OSCILLOSCOPE
LEFT " , CHANNEL r- STEREO GENERATOR DECODER OR I STEREO I RECEIVER LEFT AUDIO AMP LEFT SPEAKER RIGHT CHANNEL (R TEST SIGNAL IS BEING APPLIED IN THIS EXAMPLE) RIGHT AUDIO AMP (A)
Equipment connections.
RIGHT SPEAKER MBB (B) Display of R (C) Ideal L channel (D) Display of channel output. output. incomplete separation.
AUDIO GENERATOR
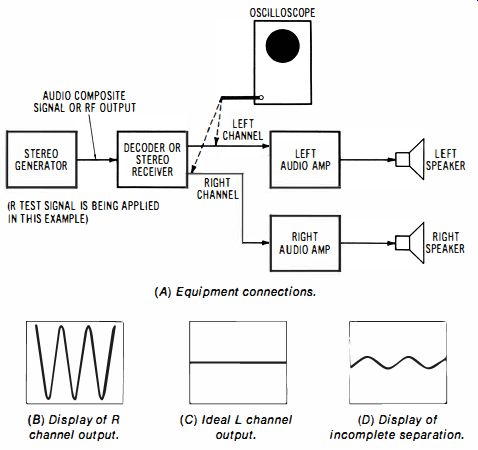
Fig. 1-12. Stereo separation test.
AMPLIFIER OSCILLOSCOPE

Fig. 1-13. Measurement of amplifier output resistance.
Connections Required: Connect the output from the audio oscillator to the input of the amplifier. Connect one 8-ohm resistor to the amplifier output terminals, and connect the scope across the load resistor (Fig. 1-13). (The other 8-ohm resistor will be shunted across the load in the second part of the test).
Procedure: Drive the amplifier to approximately half of its maximum rated power output at 1 kHz, and note the peak-to-peak output voltage. Then connect the second a-ohm resistor in parallel with the first resistor, and again note the peak-to-peak output voltage.
Evaluation of Results: Almost al l audio amplifiers can work into an a-ohm or a 4-ohm load. (A pair of a-ohm resistors in parallel provides a 4-ohm load.) Multi ply the foregoing peak-to-peak voltages by 0.354 to obtain the rms output voltages.
Then. if the rms voltage across the a-ohm load is El• and the rms voltage across the 4-ohm load is E2 and Ro is the amplifier output resistance, calculate:
For example, if EJ = 6 V rms, and E2 = 5 V rms, then Ro = 2 ohms .
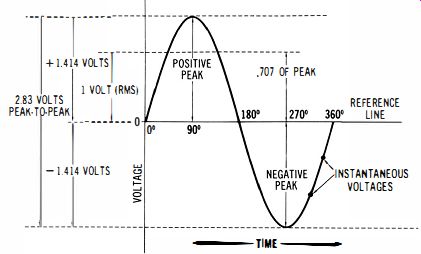
Fig. 1-14. Voltage values in a sine wave.
NOTE 1-9 Maximum Power Transfer
Maximum power is transferred from an amplifier to a load when the load resistance is equal to the amplifier's output resistance. On the other hand, high-fidelity speaker operation generally requires that the amplifier output resistance be 1/4 (or less) of the speaker impedance. The ratio of speaker impedance to amplifier output impedance (resistance) is cal led the damping factor of the system. Unless the speaker is adequately damped, its acoustic output will be distorted with respect to the audio output waveform from the amplifier. Although an ohm is based on rms voltage units, it is permissible to use peak-to-peak voltage values in calculation of Ro because the 0.707 conversion factor will automatically cancel out.
1-11. To Measure the Input Resistance of an Amplifier
Equipment: Audio oscillator and potentiometer with a range at least as high as the anticipated value of input resistance; load resistor; ohmmeter.
(A) Output voltage is measured at 1 kHz.
OSCILLOSCOPE
AMPLIFIER AUDIO OSCILLATOR
(B) Potentiometer resistance inserted to reduce output voltage to one-half.
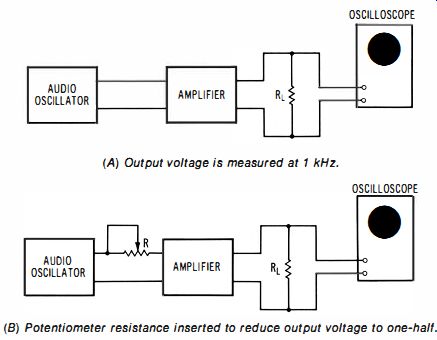
Fig. 1-15. Measurement of amplifier input resistance.
Connections Required: With reference to Fig. 1-15, connect the output from the audio oscillator to the input of the amplifier.
Connect the load resistor (typically rated at 10K) to the output of a preamplifier, or a power-type load resistor (typically rated at 8 ohms) to the output of a power amplifier.
Connect scope across the load resistor. In the second part of the test, connect the potentiometer in series with the input to the amplifier.
Procedure: Advance the output from the audio oscillator to obtain rated maximum power output from amplifier at 1 kHz.
Then, insert the potentiometer and adjust its resistance to obtain one-half the output voltage noted in the first part of the test.
Evaluation of Results: Measure the potentiometer resistance with an ohmmeter. The value of potentiometer resistance equals the input resistance of the amplifier.
NOTE 1-10 Audio Oscillator Output Resistance
The foregoing test procedure assumes that the output resistance of the audio oscillator can be disregarded with respect to the input resistance of the amplifier. In the majority of cases, this is permissible. However, for a precise measurement, the output resistance of the audio oscillator should be subtracted from the potentiometer resistance to calculate the amplifier input resistance.
Thus:
R'n = R - R...
.... where, R'n is the amplifier input resistance, R is the potentiometer resistance measured by the ohmmeter, R. is the source (output) resistance of the audio oscillator.
1-12. To Measure the Output Resistance of a Generator
Equipment: Potentiometer within the range of anticipated output resistance value; ohmmeter.
Connections Required: With reference to Fig. 1-1 6, connect the output terminals of the generator to the input terminals of a scope. Then, connect the potentiometer across the output terminals of the generator. A 1-kHz test frequency is used.
Procedure: Note initial output-voltage reading. Then, note the reduced reading obtained when the potentiometer is connected to the output terminals of the generator. Adjust the potentiometer to obtain one-half the initial output-voltage reading.
Evaluation of Results: Remove the potentiometer and measure its resistance with an ohmmeter. The potentiometer resistance value is equal to the generator output resistance.
AUDIO GENERATOR (A) Open-circuit output voltage is measured.
OSCILLOSCOPE
AUDIO GENERATOR
(B) Potentiometer is adjusted to reduce the initial reading to one-half.

Fig. 1-16. Measurement of generator output resistance.
1-13. To Check the Damping of a Speaker
Equipment: Square-wave generator and 7S-ohm, 2-watt potentiometer.
ANECHOIC ROOM OR "OPEN AIR LOCATION" SQUARE WAVE GENERATOR
TEST SETUP OVERSHOOT RINGING
INADEQUATE DAMPING OSCILLOSCOPE
ADEQUATE DAMPING
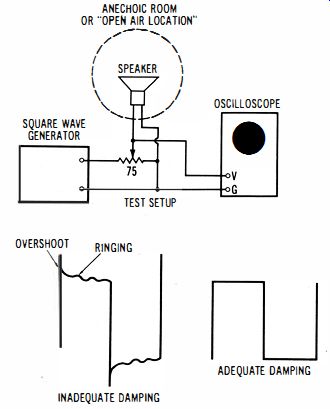
Fig. 1-17. Checking the optimum value of speaker damping resistance.
Connections Required: Connect output from square-wave generator to potentiometer. Connect output from potentiometer to speaker and to the vertical-input channel of the scope (Fig. 1-17). Procedure: Operate speaker in an "open-air location" or anechoic room to avoid interference from echoes. Observe the pattern on the scope screen at various square-wave repetition rates, and with comparatively low values of resistance across the speaker terminals.
Evaluation of Results: When the resistance shunting the speaker terminals is comparatively low, such as 1 or 2 ohms, over-shoot and ringing will normally be minimized. In practice, the damping resistance is often chosen to provide a small amount of overshoot. This corresponds to the most rapid feasible rise (attack). Note that the optimum value of damping resistance determined in this test corresponds to the optimum value of output impedance for the amplifier with which the speaker is to be used.
NOTE 1-11 Speaker Sound Output Waveform
A speaker cone and cabinet arrangement acoustically couple the electrical energy in the voice coi l to the surrounding air. The sound wave produced in the air by a square-wave voltage applied to the voice coil usually shows appreciable distortion. To check the sound waveform, operate the speaker in an anechoic room with a good-quality microphone, such as a condenser microphone with a preamplifier (as in a sound-level meter). Feed the output from the microphone preamplifier into a scope to display the acoustic output waveform from the speaker.
1-14. To Determine the Ringing Frequencies (Resonances) in a Listening Area
Equipment: Audio oscillator and good-quality microphone.
Connections Required: As depicted in Fig. 1- 18, connect microphone to scope; connect audio oscillator to L speaker for test, then to R speaker. (Use microphone preamplifier, if necessary.)
L SPEAKER TO AUDIO OSC. MIC. T TO SCOPE LISTENing AREA R SPEAKER TO AUDIO OSC.
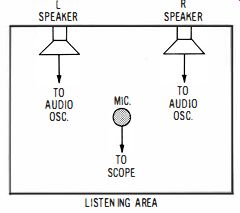
Fig. 1-18. Check of ringing frequencies (acoustic standing waves) in a listening
area.
Procedure: With the microphone placed in the preferred listening position, vary the test frequency from the audio oscillator from 20 Hz to 20 kHz and observe the sound level from the L speaker on the scope screen. Then repeat the test for the R speaker.
Evaluation of Results: Every room (except an anechoic room) will exhibit standing waves (resonances) at various audio frequencies. In some types of rooms, these ringing frequencies are very prominent and impair the fidelity of sound reproduction. The frequency characteristic of a listening area can be improved by installation of drapes, curtains, and rugs in strategic areas. Speaker placement has a marked effect on standing-wave patterns; it is occasionally advantageous to locate the speakers in the corners of the room. As the test frequency is varied and a room resonance is approached, the amplitude of the waveform displayed on the scope screen increases rapidly and then passes through a peak. The principal resonant frequency of a room corresponds to the frequency that produces the greatest pattern amplitude.