BUILD AN A-WEIGHTING FILTER
I HAD BEEN thinking for some time about building a meter preamp to make measurements at very low signal levels (Photo 1). Both my H-P meters (400H and 403B) go down to 1-mV full scale, making reliable readings be low 100uV difficult. I wanted to mea sure the noise and signal levels of CD players down low in the microvolt range. Having a low-noise, wideband 40dB amp with a built-in A-weighting filter would give the H-P meters a sensitivity of 10uV full scale, sufficient to measure A-weighted signal-to-noise ratios of at least 110dB referred to 1V, perhaps even more (Photo 2). 40dB gain is handy because the meter scale to be read matches the first digit of the range knob setting, eliminating confusion.
The Curve
Then I received a demo copy of some software for circuit analysis, ECA from Tatum Labs (1478 Mark Twain Court, Ann Arbor, MI 48103). I thought, I'll just try it out with the A-weighting filter. My copy of the National Association of Broadcasters (NAB) Weighting Curve for Weighted Noise Measurements was given to me years ago by that prince of audio, Howard Roberson, who kept voluminous files of such vital oddments.
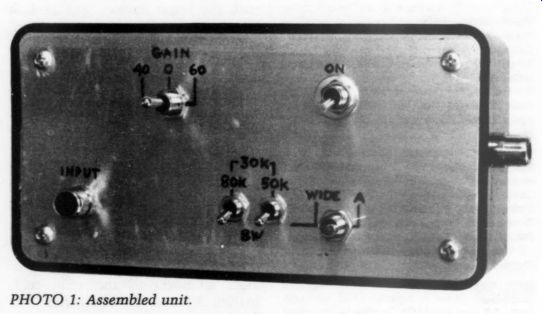
PHOTO 1: Assembled unit.
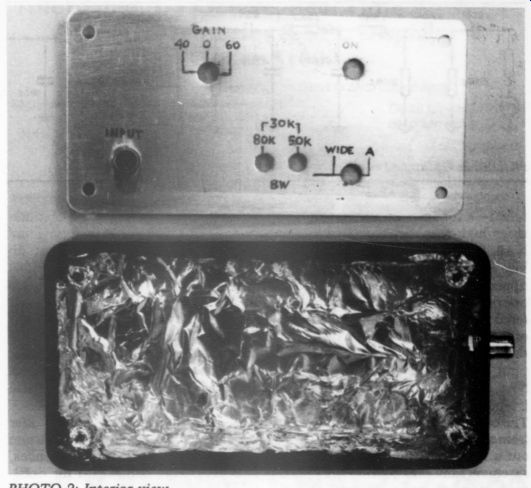
Photo 2 : Interior view.
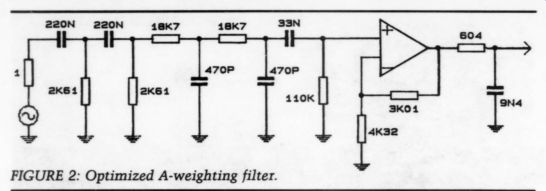
FIGURE 2: Optimized A-weighting filter.
Now yellowed with age, the thermo fax paper displayed the venerable curve as I've redrawn it in Fig. 1.
Along with the curve, the NAB provided a Suggested Schematic with Approximate Values as shown in Fig. 1.
You see, rather than defining a circuit, the NAB (like the RIAA) defined a curve, leaving it up to the wiles of circuit designers to meet it. Note that the suggested schematic has two identical high-pass sections (330nF and 1.8 k-Ohm) which provide the main low frequency rolloff. These are followed by a single low-pass section (10k and TO VTVM 200K OR GREATER 2.2nF) which provides the high-frequency rolloff. This in turn is followed by a single high-pass section (47nF and 100k) with a very low frequency breakpoint to finish the rolloff below 100Hz. Naturally just as in the various RIAA compensation circuits, these sections all interact with one another to affect the shape of the curve.
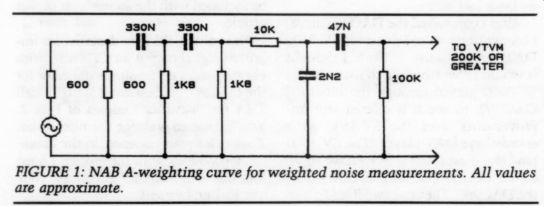
FIGURE 1: NAB A-weighting curve for weighted noise measurements. All values are approximate.
I always assumed that the NAB's suggested schematic would result in the defined curve; ECA shows that it almost does. At first I thought the demo program had a glitch, so I laboriously Thevenin-ized the whole net work at two frequencies and con firmed that ECA indeed was correct.
The first data column of Table 1 shows the values to the nearest 0.1dB (with the exception of a couple that are smack on a 0.05dB increment) for the standard A-weighting curve, followed by the specified error-band limits. I read these with a magnifying glass from my ancient copy, interpolating with the help of a tiny scale. The NAB curve was defined from 25Hz-15kHz.
I don't know if the Acoustical Society of America (ASA), which uses this curve for “A-weighted ” measurements, has extended the range to 20Hz and 20kHz (or beyond); if you know the ASA specs, please drop me a note and tell me what they are. If you have a copy of an official curve that would be helpful too.
Much Ado About Nothing?
Why not just use the 'suggested schematic’ circuit and get on with it? Two reasons, both shown by data in Table 1's third column, which is the computed response of the “suggested schematic.”
1. The circuit's low frequency fit really is not good, which means that low frequency noise will be over estimated. At the least, the curve points ought to fit within the originally-defined error band!
2. The circuit's fit from 1kHz up, where the most measurement effect will be found due to the curve shape, also is not very good and it's not too hard to make it better.
I believe the defined error bands resulted from an assumption of using readily-available standard tolerance components; after all, 10% is 1dB.
Since more accurate parts are now easy to obtain, doing better is certainly desirable and easily possible.
The Magic of Computers Table 1's third column values were computed by the ECA program for the NAB's suggested schematic, showing the problems mentioned above. I have rounded the 0.001dB resolution of the program to the nearest 0.1dB. I con figured the circuit for the 30 0-Ohm source impedance as shown (600 generator Z-in parallel with a 60 0-Ohm load) and had only the output load of 100k as shown in the schematic. ECA allows you to 'probe’ the output without loading.
Since most AC voltmeters in the early days of the NAB curve had very high input impedance, typically >1 M-OHM, the assumption seems reasonable. Together with the 47nF architrave capacitor, the 100k shunt resistor (and any subsequent meter input Z-loading in parallel) provides a curve breakpoint at 34Hz. By the way, a simulation run with a 200k meter load brought the 25 and 50Hz data points just inside the upper error limit, but didn't help from 100Hz-400Hz.
Just for comparison, Table 1's fourth column shows the A-curve values which I found in a manual for a Bruel & Kjaer (B&K) measuring amp; I think it was a 2606, but neglected to write it down. You'll note that the NAB curve values and those of B&K (which seem to be IEC values) don't agree at high frequencies. Did the IEC change the NAB curve? Or are B&K's values the result of its particular solution? Those perfectionistic Danes don't kid around about this stuff, so they're probably IEC values. I decided to stick with the NAB curve.
-----------
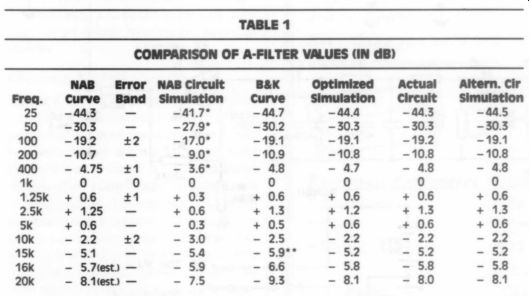
TABLE 1 COMPARISON OF A-FILTER VALUES (IN dB)
Values outside of error band limit.
B&K points are on 1/3-octave intervals, so there is no data point at 15kHz; -5.9 value estimated by interpolation.
(est) 6k and 20k points of NAB curve estimated by curve-fitting extrapolation.
--------------
It Was Supposed To Be Easy...
I set out to match the NAB curve using the ECA program. It ended up taking a few evenings and what seemed like a million keystrokes, but a lot less time than breadboarding would have taken-a Jot less. In addition to the three high-pass sections used by the NAB, I ended up using a total of three low-pass sections to match the critical upper end of the curve closely, and one of those sections needed to be buffered from the other components in order to get the match. The results of the analysis are shown in Table 1, column five. I think the match to the NAB curve is pretty good. I'm not sure it's possible to match the NAB curve.
The original points were probably read from a voltmeter, point by point, with out a high-precision frequency measurement, and then plotted and joined using a french curve. Figure 2 shows the computer-optimized filter circuit with resistors set to the closest standard 1% values. This circuit assumes ...
FIGURE 2: Optimized A-weighting filter.
...a source impedance of zero, a condition approached when a high-gain/ high-feedback op amp's output directly drives the filter input.
Meter Preamp
Figure 3 shows the preamp filter as I built it. I included 0dB, 40dB, and 60dB gain options, yielding 1mV, 10uV, and 1uV, full-scale sensitivities with my meters. Its A-filter response is shown in column six of Table 1.
The 5534 op amps are cheap, offer very low equivalent input noise when driven from low source impedances, and have wide bandwidth for unfiltered measurements, even at +40dB gain or more. You can use a 5532, TL072, or another low-noise dual, but you'll almost certainly sacrifice a few dB of noise performance; you can also use ultra-low noise singles like the LT1115, but watch the stability-you may need to compensate to keep them from singing. Many of them won't work near unity gain without a lot of compensation, which you then don't want at 60dB gain, thereby eliminating the 0dB gain option. Stability can be a problem with the 5534, too, at 0dB. To keep the first amp from singing with large input signals, I had to move the 1000uF cap to the bottom of the board (as shown in Photo 2) from the top of the board near the A-filter components. On the other hand, the A-filter amp is stable, period, probably due to the output filter.
The low-pass filters at 80kHz and 30kHz let the measurement conditions match those of standard measurement conditions which you see in various publications. The 0dB/40dB/ 60dB gain switch means that the pre amp can work with a wide range of in put signal levels, from 1uV to more than 3V RMS. If you'll only be using the preamp to measure really low levels (<30mV) of signal and noise, you can choose one gain and do away with this switch. The noninverting input amp provides high input Z for low loading and drives the following filter circuitry from a nice low source Z. Battery operation means that the only AC noise you'll have to worry about is that associated with the Device Under Test (DUT) and the meter.
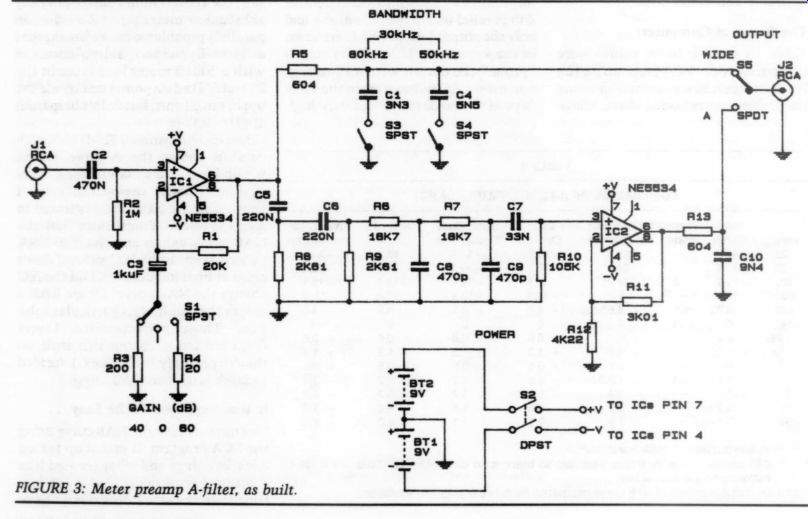
FIG. 3
The noninverting amp in the A filter circuit has three functions: it provides make-up gain for the filter's insertion loss of approximately 4.7dB @ 1kHz; it provides the buffering for the third low-pass section to make the curve correct; and it provides, through the third filter section, a 600 ohm output Z, just in case you need to drive some pro gear which requires this source Z (the output from the first amp drives the low-pass filter switches through 60 0-Ohm for the same reason). Another benefit is that the output signal has the same polarity as the input.
You may wonder why the optimized circuit and the actual circuit differ in two values-the 110k filter resistor and the 4.32k gain resistor. The 4.32k resistor shifts to 4.22k because of the reduction of the 110k resistor to 105k.
This causes more insertion loss, which requires more make-up gain.
As to why the 110k ended up 105k, the short answer is I just don't know, and I don't even have a theory, since the shift goes in the opposite direction of effects due to loading by the amp's high-but-finite input Z.
Table 2 presents the noise performance of the circuitry; in general, noise measurements of 6-10dB higher than the EIN (equivalent input noise) will be quite valid. On this basis, valid A-weighted S/N measurements of CD players can be made down to around -126dB referred to the standard 2.0V outputs of these machines. Not too shabby.
Alternate A-Filter Circuit
Figure 4 shows an alternative A-filter circuit which I discovered with ECA's help after most of the work was done.
It offers some advantages for only slightly worse curve fit. It uses three easy-to-find 100nF caps; it eliminates one RC section (LP) entirely; its values are essentially right-on standard 5% series parts. But it has slightly poorer fit by a tenth of a dB or two, as shown in Table 1, column seven. In either circuit, the HF response is somewhat sensitive to output cable-C loading- 500pF can make more than 0.1dB difference at 20kHz. You can allow for any output cable C/meter input C by correspondingly reducing the value of the output cap-but this is mouse milking. I breadboarded this circuit; I needed 13nF instead of 12nF and 26.7k instead of 28.7k to get an essentially exact fit to the simulated circuit data- although the amp's inverting leg R turned out to be 3.65k for unity gain at 1kHz.
About Parts and Values
The components shown in Figs. 3 and 4 are 1% metal film resistors and 5% caps selected to within 1%. When I didn't have a particular 1% resistor on hand, I used selected 5% carbon films.
Table 3 shows various combinations of 5% values to approximate the 1% values shown in the schematic, just to save you some computation. Selecting all Rs to within 1% with a DMM is a good idea; my experience with 5% carbon film resistors is that most are within 1 or 2% of the marked value, so you can usually trust them.
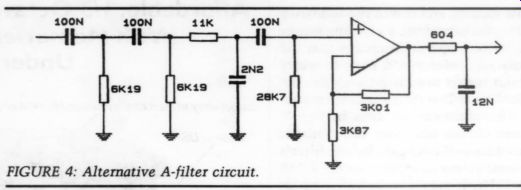
FIGURE 4: Alternative A-filter circuit.
Use polystyrene caps if possible for the 470pF units, since they tend to be very accurate in value, whereas disc caps are unusual if within 10%. The actual type of cap is not too important--you're not going to be listening to this preamp, are you? Any film caps will work well. My experience with film caps is that they will be anywhere within the tolerance band; I guess it's harder to make Cs than Rs.
The caps are mostly easy-to-get standard values. If you have access to an accurate capacitance meter or bridge, by all means use it. You can also check cap values with a generator, a frequency counter, a precision resistor, and your meter-make a low-pass filter and find the frequency at which the output is exactly - 3.0dB down from a much lower frequency (approximately 1/100 th); use the formula C = ½ pi Rf to calculate the capacitance.
This is tedious but very accurate if all the gear is accurate and stable, especially the frequency counter. Generator amplitude stability is not so important since you can monitor its output with the meter.
First Stage and LP Filter Tweaks
The gain adjustment is simple enough.
I don't like pots, so I used 1% resistors.
You may want a trimpot but I prefer to fiddle with the values (if needed) by adding a little in series or by paralleling. Since this is a meter preamp, feed in about 10mV of signal to set a convenient reference level at 1kHz (about -40dB at the input) and just use your meter to monitor input and output levels; fiddle with the 20k and/or 200 resistors to get exactly 40dB of gain.
Using stock 1% resistors will get you within 0.2dB without any fiddling; mine ended up correct for both 40dB and 60dB with no fiddling at all.
I chose the 20k/200/20 set of values in order to give the first stage a very low frequency rolloff, which is set by the 20 0-Ohm resistor and the 1,000uF cap: -3dB @ 0.8Hz. It would be better to use lower resistance in the feedback resistor for lower noise, but then the inverting leg values get too low for good LF response, especially at 60dB gain, requiring a huge capacitor. The 1,000 uF cap is needed at high gains to prevent a large DC offset at the amp output, which causes dynamic range limitation. Use metal film resistors for lowest noise.
I used a center-off switch from Radio Shack for the inverting leg gain resistors. This gives 0-dB at off, 40dB one way, and 60dB the other. For the filters, a pair of SPST toggle switches lets you have Wide 80k/50k/30k bandwidths and use only a few caps; that's what I did-the cap values are 3.3nF and 5.5nF.
Alternatively, a center-off toggle switch makes a good Wide 80k/30k bandwidth switch; then separate 3.3nF and 8.8nF caps make the two rolloffs.
-------------
TABLE 2
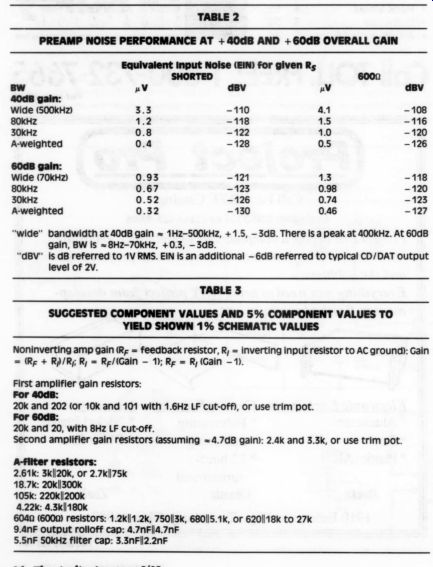
PREAMP NOISE PERFORMANCE AT OVERALL GAIN
TABLE 3 SUGGESTED COMPONENT VALUES AND 5% COMPONENT VALUES TO YIELD SHOWN 1% SCHEMATIC VALUES
Noninverting amp gain (Rg = feedback resistor, R, = inverting input resistor to AC ground): Gain
= (Rg + R)/R;; Ry = Re/(Gain - 1); Rg = R; (Gain -1).
First amplifier gain resistors:
For 40dB:
20k and 202 (or 10k and 101 with 1.6Hz LF cut-off), or use trim pot.
For 60dB:
20k and 20, with 8Hz LF cut-off.
Second amplifier gain resistors (assuming =4.7dB gain): 2.4k and 3.3k, or use trim pot.
---------------
---------------
Tip about Noise Levels and Calibration
Calibrate the gains as described for use with true RMS meters. If you are using an average-responding meter calibrated in the RMS of a sine wave (most are), then for random noise the meter will underestimate the noise level by about 1.1dB. You can set the A-filter amp gain to read + 1.1dB at 1kHz referred to the Wide setting gain, to then accurately read true noise levels. The A filter should be used only for noise measurements anyway, but I always just add the 1.1dB mentally. Your choice.
-------------
-------------
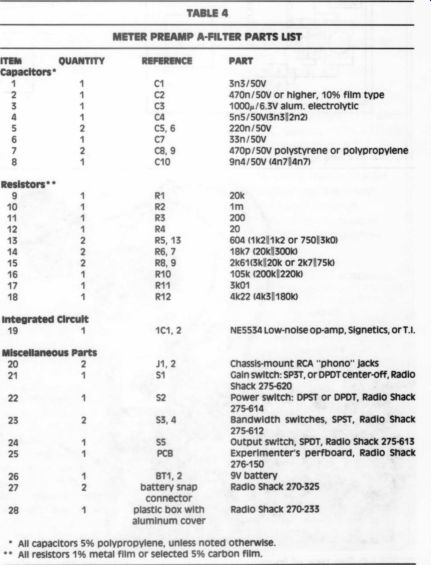
TABLE 4 METER PREAMP A-FILTER PARTS LIST
NES534 Low-noise op-amp, Signetics, or T.1.
Chassis-mount RCA “phono ” jacks Gain switch: SP3T, or DPDT center-off, Radio Shack 275-620 Power switch: DPST or DPDT, Radio Shack 275-614 Bandwidth switches, SPST, Radio Shack 275-612 Output switch, SPDT, Radio Shack 275-613 Experimenter's perfboard, Radio Shack 276-150 9vV battery Radio Shack 270-325 Radio Shack 270-233
All capacitors 5% polypropylene, unless noted otherwise.
All resistors 1% metal film or selected 5% carbon film.
-----------------
A-Filter Tweaks
In each filter section you can vary the R for a given C (or vice versa) which is close to the desired value, so as to obtain the correct time constant. For ex ample, the output filter calls for 604 ohm and 9.4nF; the Tau = RC = 5.68 x 10 u-sec. If you have 5900, C = Tau/R = 9.6nF.
Similarly, if your C is 210nF instead of 220nF, then your R will need to be 2.73k instead of 2.61k.
Once the filter is assembled, you can check the preamp/filter performance by setting the second amp's gain for an approximately correct value and then checking the filter's response referred to an output signal level of exactly 0dB at exactly 1kHz. Wait to trim the amp gain precisely until you are satisfied with the filter's characteristics-changing parts will change the filter's insertion loss.
The generator frequency has to be monitored with high precision when you check the filter's response; changes of a fraction of a hertz at low frequencies where the curve slope is steep can change the output level by several tenths of a decibel. I found out the hard way, by trying to use the frequency
----------------
Dick Moore is an audio engineer and technical writer with a strong interest in measurement and instrumentation. He currently telecommutes from Washington state for RDA International, Inc., a special interest advertising agency in New York with clients in the audio field. A liberal arts major, Dick was an enthusiastic hi-fi hobbyist in the fifties, attracted by the then-new technology of stereo. Working for Tektronix, Inc., provided Dick with his first exposure to serious technical stuff. He was a member of the design team that initiated Monsanto's brief but lively foray into electronic instrumentation. Dick also has been a speaker engineer with a/d/s/ and Klipsch & Associates, ran an instrumentation repair business, and managed the service and commercial-sound departments of Custom Audio in Little Rock.-------------
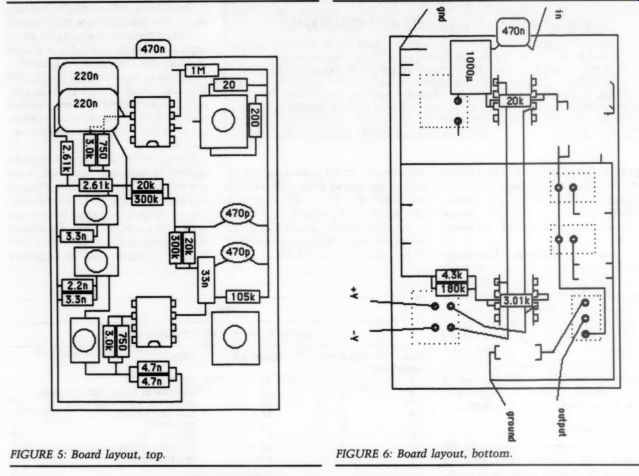
FIGURE 6: Board layout, bottom.
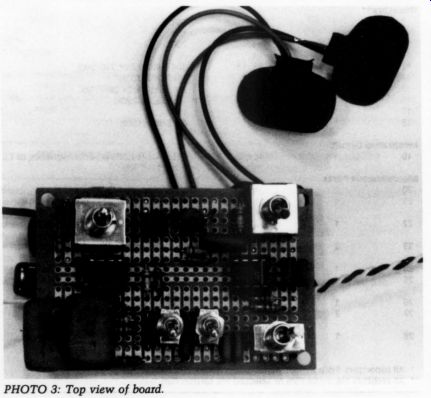
PHOTO 3: Top view of board.
counter built into my low-cost 4 -digit DMM. It was off by 2Hz at 50Hz, leading me to wonder why I couldn't get the right response from the bread board filter circuit! Hum and ground loops from AC-operated meters, generators, and so on, also can skew data at low frequencies where the filter's attenuation is high; if this is unavoidable, and you've used a 1kHz reference of 0dBm (0.775V), boost the generator out put by exactly 10dB (2.45V) and subtract the boost from the resulting output reading to get the correct value. Just be really careful not to overload the first amp.
The second amp stage doesn't really need an isolation cap in the inverting in put leg to prevent DC offset, due to its low gain. Once again, I set the gain of the second stage by fiddling with resistors. However, to repeat, if you in tend to fine-tune the A-filter values, wait until you're through tweaking the filter values before setting the amp gain precisely. Set the generator as precisely as possible to 1kHz, and switch between the flat and A positions of the output switch; fiddle with the gain resistors until there's no change in your meter reading as you switch.
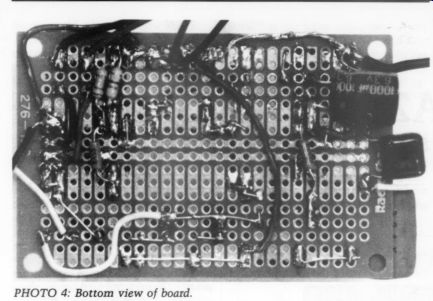
PHOTO 4: Bottom view of board.
I used a phono jack input since I mainly look at audio equipment. The output jack can be any type you would commonly use; I used a phono jack here, too. All grounds should be tied to the chassis at only one point: the input jack ground (Photo 3, Fig. 5). Float the out put jack's ground from the chassis and tie it back to the input. This 'star grounding will reduce noise. I used a plastic box (which I lined with foil for shielding) to hold everything (Photo 4, Fig. 6). The plastic box makes it easy to isolate the output jack from chassis ground-there isn't one! A small box, some switches, an experimenter's PC board, a couple of batteries, and some soldering. That's it, a piece of cake for accurate noise level and low-signal measurements on CD players, low-noise preamps and amps.
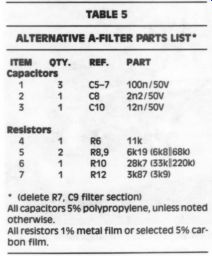
TABLE 5 ALTERNATIVE A-FILTER PARTS LIST
ITEM OTYV. REF. PART 3 C5-7 1
1 C10 100n/50V 2n2/50V 12n/50V R6 11k R89 6k19 (6k8l68K R10 28k7 (33kli220K) R12 3k87 (3k9)
(delete R7, C9 filter section)
All capacitors 5% polypropylene, unless noted otherwise.
All resistors 1% metal film or selected 5% carbon film.
---------------
Options and Other Uses
You may want to use + 50dB gain in stead of 40 and/or 60dB, yielding 3.16uV full-scale sensitivity with a 1mV full-scale meter. At 50dB gain, the 5534 will still have approximately 200kHz bandwidth, sufficient for most measurements. You have to be extremely careful that you read voltages from the correct scale on the meter- when the knob says “1 ” you read the 3 ” scale; decibel readings will be OK, but you just have to remember to include the amp gain.
The preamp and filter can be used with digital voltmeters, but be sure that | the DVM has sufficient bandwidth for | the measurement. My Fluke 8000A is good beyond 100kHz, but my low-cost 44 -digit machine rolls off above 50kHz.
Given the relatively low bandwidth of even good DVMs, you can use 60dB gain in the 5534 and still get approximately 70kHz bandwidth. Alternatively, for much wider bandwidth, you can cascade two amp stages, the first with 40dB gain and the second with 20dB. Of course this increases noise.
60dB of gain has the advantage of making the DVM’s display read directly in mV when set to the 2V range (some meters are labeled 1V for a range that goes to 1.9999). With most DVMs, the most sensitive range is 200mV, which will now read directly in pV. This is very handy.
And finally, this preamp is a blessing for use with a 'scope, especially one that's not very sensitive.
Also see: