Authorizations for fm stations involve certain FCC specifications as to power and antenna-height requirements. We will look briefly into these FCC regulations and explore the general characteristics of fm propagation before examining the details of conventional fm and stereo fm transmitters.
10-1. FUNDAMENTALS OF FM TRANSMISSION

Table 10-1. Maximum ERP vs Maximum Antenna Height
Except as provided below, the fm licensee is required to supply a mini mum effective radiated power (erp) as follows:
Class A Station: 100 watts (-10 dBk) Class B Station: 5 kW (7 dBk) Class C Station: 25 kW (14 dBk) NOTE: If you are not familiar with the term dBk, please review Figs. 2 17, 2-18, and 2-19 (and associated text) in Section 2.
No minimum antenna height above average terrain is specified by the FCC. However, maximum antenna height is correlated with maximum erp as listed in Table 10-1.
Antenna heights exceeding those specified in Table 10-1 may be used provided the erp is reduced an amount determined by use of the appropriate curve in Fig. 10-1. If use of this curve requires an erp reduction to an amount less than the normal minimum specified for the class of station involved, then the erp determined from Fig. 10-1 becomes the minimum for the station involved. That is, when such conditions exist, the station is authorized to operate at an erp lower than the minimum value normally specified by the FCC.
Determination of applicable rules depends on the zone in which an fm station is located, and the procedures are quite varied and complex. Current issues of the FCC Rules and Regulations should always be readily available to responsible station personnel.
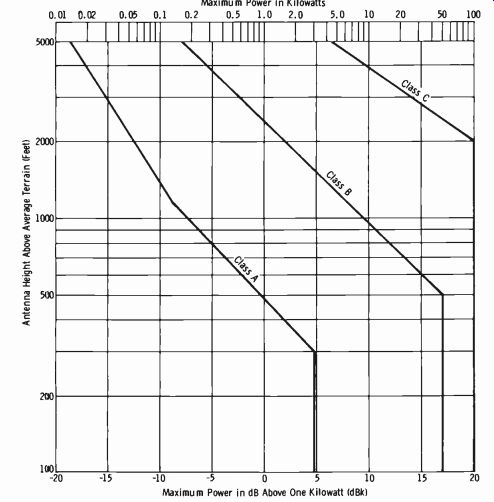
Fig. 10-1. Maximum power versus antenna height for fm stations.
FM Coverage
Signal propagation in the 88-108 MHz region differs radically from propagation at the standard broadcast frequencies studied in the preceding Section. A high power gain may be achieved by concentration of radiation in the horizontal plane at the expense of radiation in the vertical plane.
In the past, horizontal polarization was used exclusively by fm broadcasters.
With the rapid increase in the number of automobile fm receivers, the vertical component of a radiated wave assumed increasing importance, and combined horizontal and vertical polarization through the use of two individual sets of antennas became popular. The most recent development is the circularly polarized antenna. All systems are covered in Section 10-2.

Fig. 10-2. Calculation of line-of-sight distance.
The propagation of fm power, since it occurs in the vhf band, is based primarily on line-of-sight reception. Fig. 10-2 shows the optical path. The line-of-sight distance is:
D= 1.22 ( ht + h2)
... where, D is the line-of-sight distance in miles, h1 is the height of the transmitting antenna in feet, h2 is the height of the receiving antenna in feet.
It should be remembered that in practice tall steel structures must be considered when predicting field strengths of received signals. The height of the transmitting antenna is measured from the ground to the effective radiating center of the antenna elements.
When a high erp is used, the usable range of the fm signal is extended past the theoretical calculation of Fig. 10-2. As a practical example, the line-of-sight distance for a 500-foot transmitting antenna and a 50-foot receiving antenna is found as follows:
D = 1.22 ( \50-(7+ 5(7) = 1.22 (29.4) = 35.9 miles
Therefore, the optical path is 35.9 miles. In one case, a combination of a 10-kW transmitter and an antenna with a power gain of 12 at a height of 500 feet placed a 20-microvolt per meter signal at a distance of 88 miles.
This is sufficient signal strength for most modern fm receivers in rural or small-community locations.
The free-space field intensity is:
e=7 PR d
... where, e is the free-space field intensity in volts/meter, PR is the effective radiated power in watts, d is the distance in meters (1 mile = 1610 meters).
Assume that a half-wave dipole is radiating 1 kW of power. To find the free-space field intensity at 1 mile (1610 meters), perform the following calculation:
7 V1000e 1610 (7) (31.6) 1610
= 0.1374 volt/meter
= 137.4 mV/meter
All antenna gains (or losses) are related to this standard half-wave dipole which gives 137.4 millivolts/meter at one mile with 1000 watts of power. In free space, e is independent of the frequency (wavelength) of operation.
In practice, ground effects must be considered, and e becomes a function of frequency or wavelength. In this case, the approximate formula for e becomes:
3.2 ah PR e =
... where, e is the field intensity in microvolts per meter, a is the height of the transmitting antenna in feet, h is the height of the receiving antenna in feet, PR is the effective radiated power in watts, d is the distance in miles, A is the wavelength in meters.
Note that since A. is in the denominator, the shorter the wavelength (higher the frequency), the greater is the received field strength. This is directly offset by the effective antenna length which, for a half-wave dipole, varies inversely with frequency.
Fig. 10-3 is used to determine either a given field-strength contour or the required effective radiated power to produce a given field strength at a certain distance, for a given antenna height. The chart is based on a receiving-antenna height of 30 feet. As an example of its use to estimate the approximate radius of the area within a given field-strength contour, consider the following problem.
Estimated field strength exceeded at 50 percent of the potential receiver locations for at least 50 percent of the time at a receiving antenna height of 30 feet
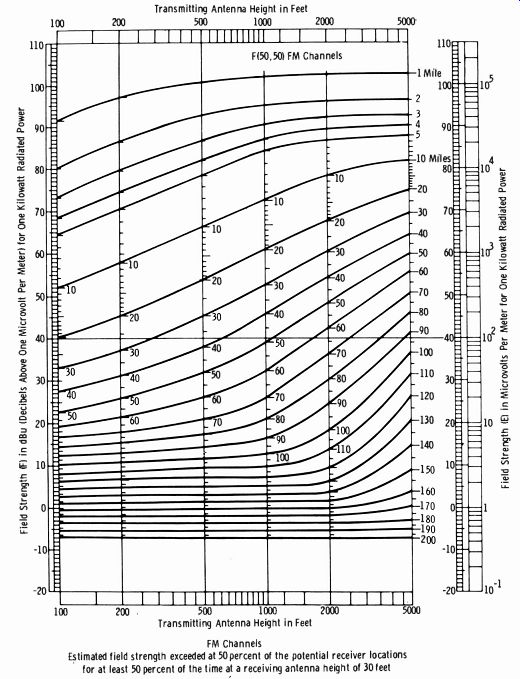
Fig. 10-3. Signal-intensity chart for fm stations.
Assume that it is desired to determine the distance from the antenna to the 1000-microvolt per meter (designated µV /m) contour when the antenna height above average terrain is 500 feet and the effective radiated power is 1 kW. This distance would probably be different in each direction unless the land is very flat. Note that 1000 µV/m is +60 dBu. Place a straightedge from 60 on the right edge to 60 on the left edge of the chart.
Mark the point at which the vertical line representing 500 feet (noted along the top and bottom of the graph) intersects the straightedge. In this example, the distance to the 1000 µV/m contour is approximately 15 miles.
The graph is drawn on the assumption of 1-kW power. To use the chart for any other power, subtract the number of dBk for the power used from the number of dBu corresponding to the desired signal strength; then use the resulting number in the manner just described. The charts issued by the FCC are supplied with a sliding scale that permits making this conversion graphically.
To find the value of effective radiated power necessary to produce a field intensity of 50 µV/m (34 dBu) at 50 miles from an antenna 500 feet high, locate the 50-mile point on the 500-foot antenna-height line. Place a straightedge (preferably transparent) across the chart through this point, being sure it is parallel with the bottom line. The field strength resulting from a 1-kW erp can then be read on the left edge of the chart. In this case, it is 32 dBu. The required field strength is 34 dBu, or a difference of 2 dB. Adding this same number of dB to the 1-kW erp gives a required erp of 2 dBk, or 1585 watts.
10-2. FM ANTENNA SYSTEMS
Gain is achieved in an fm broadcast antenna by stacking bays of radiators (normally about one wavelength apart) in the vertical direction, as shown by Fig. 10-4. This method nulls radiation in the vertical plane and concentrates radiation in the useful horizontal direction. Do not confuse this statement with direction of polarization; the same type of stacking of antenna bays results in maximizing radiation in the horizontal direction for either vertically or horizontally polarized radiating elements. Table 10-2 gives the gain (relative to a half-wave dipole) for various numbers of bays used. Antenna field gain is the square root of the power gain. Of particular interest is the correlation of power gain, decibels, and field gain (field strength) given in the table, which is typical for all fm antennas when horizontal polarization (only) is used. This does not apply to recent circularly polarized antennas (vertical and horizontal polarization) , which are discussed later in this section.
The RCA Type BFA broadband fm antenna (Fig. 10-4) is of sectionalized construction; each section consists basically of four radiating rings attached to a supporting frame. An insulated feed assembly and a section of 3V8-inch transmission line is provided with flanges to fit 3 1/2-inch coaxial feed lines. Adapters are available for other sizes of lines. Standard antennas have power gains from 0.9 to 16.5. Special designs are available on application. All BFA antennas are factory tuned to any channel in the frequency range of 88 to 108 megahertz. In standard and multiplexing operations, a voltage standing-wave ratio of 1.1 to 1 can be achieved with a minimum of field trimming. A transformer section is located near the input fitting.
The horizontal radiation pattern of the BFA antenna is essentially omni directional for top mounting. The horizontal pattern in free space is circular within 1 dB. The extent of deviation from a circular pattern for a side-mounted array is dependent on the type and size of the tower. It is recommended that the array be mounted, if possible, above the top set of guys on a guyed tower. Where this is not possible, the guys in the immediate area of the antenna should be broken by insulators every 3 1/2 feet for a distance of at least 14 feet. In addition, each guy in the vicinity of the antenna should be insulated at the point where it connects to the tower.
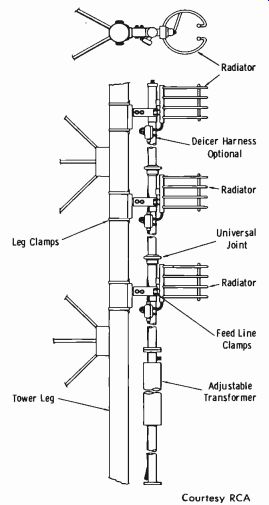
Fig. 10-4. Three-bay fm antenna side-mounted on tower.
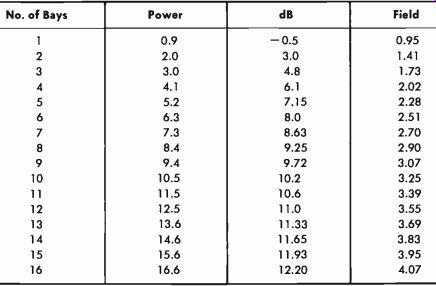
Table 10-2. Typical FM-Antenna Gains for Horizontally Polarized Elements.
Mechanically, each section consists of four stainless-steel rings stacked and equally spaced to form a height dimension of 12 inches. The sections are mounted on 3 1/8-inch coaxial line with an insulated feed stud energizing each radiating section. Only one coaxial transmission line is used to feed all sections of the antenna, and the individual radiating sections are identical mechanically and electrically. The radiators are both shunt fed and mechanically supported by this interconnecting feedline, which consists of modified lengths of 3 1/2-inch rigid coaxial transmission line. The BFA 1B through BFA-8B antennas terminate mechanically in a pressurized top cap with bleed valve and a bottom input flange for coupling the antenna to the desired type of transmission line. Type BFA-10B through BFA-16B antennas are center fed through a matching tee, and the lower and top radiators terminate mechanically in pressurized caps.
In some installations, it may be desirable to mount the antenna inside of a large tower to protect it from falling ice. Where tower widths are over six feet, this is quite feasible. In this type of installation, the horizontal pat tern is the result of several factors, including the tower width, tower-member size, and the operating frequency of the station.
Tower-leg mounting or side mounting to the tower has several advantages. Guyed towers and self-supporting towers of modest strength can be used, resulting in economy. Nearly all standard AM towers will support a side-mounted broadband antenna.
Pole, or top-mounting, antennas are available. They may be mounted on top of existing towers, both guyed and self-supporting. Pole mounting is extremely useful in situations where the antenna is to be mounted on top of a building the esthetic qualities of which are to be maintained.
In areas where a quarter inch or more of ice is routine, deicing is recommended. Long strip heaters are inserted into the element arms, providing excellent heat transfer to ice-sensitive members of the radiating element.
Depending on the type of connection, either 250 watts or 1000 watts of heat is available from a 110-volt ac source; 220 volts may also be used. An automatic control unit that operates the deicers when temperatures fall below preset levels and turns them off when temperatures rise can be used with each deicer system. Interbay deicing cable and conduit and electrical junction boxes are provided by the manufacturer to meet local electrical codes.
Combined Horizontal and Vertical Polarization
Fig. 10-5A shows half of the "doughnut" pattern of a half-wave dipole oriented horizontally. Maximum radiation occurs at right angles to the axis of the dipole. At increasing angles from the perpendicular, the radiation becomes weaker until, at the ends of the dipole, practically no radiation occurs at all. This is the familiar figure-8 transmitting or receiving antenna pattern; hence the basic half-wave dipole is considered to be a directional antenna.
(A) Horizontal dipole.
(B) Vertical dipole.
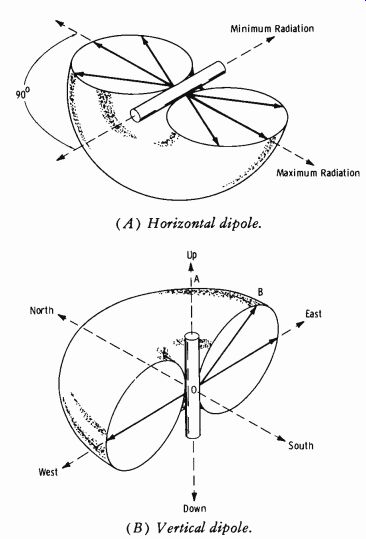
Fig. 10-5. Basic radiation pattern of a dipole.
The ring-type antenna discussed above is based on the half-wave dipole principle, but it is bent physically into a circle to obtain a 360° radiation pattern. Bear in mind, however, that the propagated wave is still horizon tally polarized.
Fig. 10-5B illustrates the resultant radiation pattern when the dipole is oriented vertically. The electric field is now vertical with respect to ground, and the wave is vertically polarized. Note that although no radiation occurs (theoretically, in free space) from the ends of the dipole, a considerable amount can occur in other directions. Note that although radiation along the OA axis is zero, radiation along the OB axis is considerable, but reduced in magnitude from the value along the east-west axis. Thus field-strength readings in a horizontal plane from a vertical radiator must specify the vertical angle of radiation for which the readings apply.
It was pointed out in the previous Section that the wavefront from an antenna consists of electric and magnetic fields which are in phase but at right angles to each other. The direction of the electric field is taken as the plane of polarization.
Now assume two antenna systems are fed from the same final rf amplifier; one of them consists of dipoles oriented vertically, and the other consists of dipoles oriented horizontally. Further assume that extra transmission line is employed in the horizontal feed to cause the rf current to lag the vertical current by 90° (one-quarter wavelength) . The result is shown by Fig. 10-6. This assumes that the currents are of identical magnitudes.
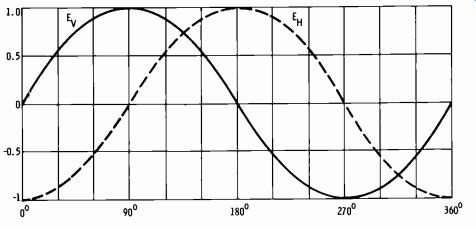
Fig. 10-6. Horizontal component of radiation delayed from vertical component
by 90 electrical degrees.
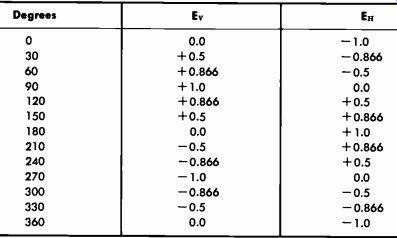
Table 10-3. Instantaneous Values of Ev and E11 at 30°
Intervals
Let Ev be the vertically polarized component, and let Ell represent the horizontally polarized component. Table 10-3 lists values for every 30° of the graph in Fig. 10-6.
At zero degrees, Ev = 0 and E11 =-1. The magnitude of energy is the vector sum, or:
E=\/Ev2+EH2 Then if the vector sum at zero degrees is designated E1:
E1=(0.0)2+ (-1.0)2
=Y0+ 1
=1 At 30°:
E2=Y(0.5)2+ (-0.866)2
=\/0.25+0.75
_Vi
=1
If similar computations are made for the other angles in Table 10-3, the result in each case is VT= 1. Thus the intensity of the electric field re mains constant, but the angle of polarization changes throughout the entire 360° of the wave, resulting in circular polarization. Fig. 10-7 illustrates this fact for the condition where E11 lags Ev by 90° as in the graph of Fig. 10-6. Note that here the direction of polarization rotates clockwise. Rotation may be either clockwise or counterclockwise, depending on the component shifted and the direction of the phase shift. This fact is not important for fm but is used in radar applications.
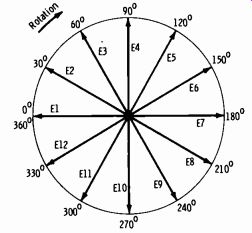
Fig. 10-7. Circular polarization, E11 lagging Ev by 90°.
If the magnitudes of the rf currents are not equal in the two antenna systems, elliptical polarization results ( Fig. 10-8) . Power dividers can be used to separate the antenna systems to achieve greater amplitude in one plane of polarization than in the other.
For circularly polarized fm antenna systems, power gain in the horizon tally polarized plane or in the vertically polarized plane is approximately equal to the number of stacked bays divided by two (the number of equivalent planes of polarization) . When circular polarization is used, the transmitter power can be doubled without exceeding the licensed horizontal erp, since the additional power radiated is in other planes of polarization. Conversely, for a given transmitter power, the antenna gain can be doubled for the same reason.
(A) Er greater than E,1. (B) EH greater than E1-.
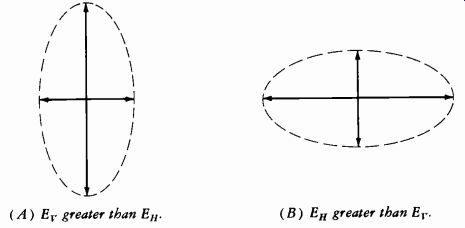
Fig. 10-8. Elliptical polarization.
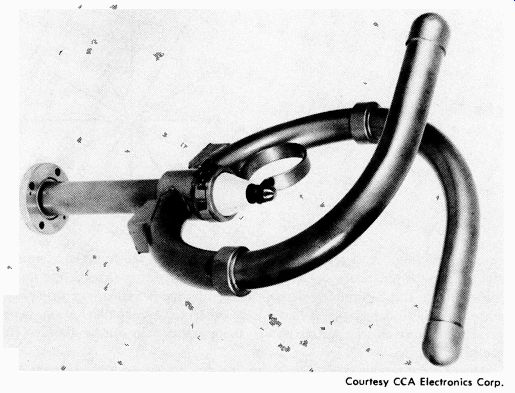
Fig. 10-9. Single element of CCA FMC circularly polarized fm antenna.
Most recent circularly polarized fm antenna systems do not employ two separately polarized units, but each bay or element gives circular polarization by design. Fig. 10-9 illustrates one example, a single element of the CCA FMC antenna. Complete systems incorporate from 1 to 16 elements.
Normally, systems with eight elements or fewer are fed at the bottom, but systems with more than eight elements are fed at the center. The element is essentially a 1 1/2-turn helix constructed of 2-inch diameter, thick-walled copper with rounded surfaces to minimize corona problems. Individual elements are placed one wavelength apart. The power gains listed in Table 10-4 are for equal horizontally and vertically polarized components; other ratios are available. The radiation centers of both the vertical and horizontal components are identical, thus achieving true phase coincidence, which is essential for true circular polarization.
The basic element can serve with a minimum of retuning as a radiator at any frequency in the standard fm broadcast band. Each of the elements in the antenna system represents an impedance of 50 ohms times the number of elements. For example, an 8-bay antenna would have 400-ohm elements. Thus, since all elements are spaced one wavelength apart, all elements are fed in parallel with equal power and represent a nominal 50 ohms to the feed line.
Because of the substantial diameter of the basic elements, they are fairly low-Q broadband elements. Thus it is possible, with associated combiners, to have one CCA Type FMC antenna radiate several fm channels.
The free-space circularity patterns (Fig. 10-10) of the FMC antenna are within ±1 dB of perfect circularity. However, when side mounted on a wide tower, the FMC, like all antennas which radiate a vertical component, produces a pattern in the vertical field with nulls and some directivity.
However, in practice the antenna will provide the urban area with considerably better coverage than a horizontal-only radiating system.
The antenna is supplied with a triple stub tuner which provides adjust able capacitors at discrete positions in the feed line. These adjustments are such that they compensate for impedance changes due to the mounting environment and still achieve a matched condition.

Table 10-4. CCA FMC Antenna Gain Specifications-----------low power (LP)
uses 1%-inch feed line.
High power (HP) uses 3 1/8-inch feed line (still higher powers available).
Antenna polarization is circular clockwise for all directions of azimuth.
Length of antenna in feet is 984 divided by frequency in MHz times one less than number of bays, plus 6 1/2 feet for transformer.
The deicers of the FMC series are stainless steel rods which require approximately 400 watts of power consumption per bay. They are capable of achieving ice-free operation at ambient temperatures of 0°C and in 50-mph winds. They require 230 volts, single phase, balanced to ground.
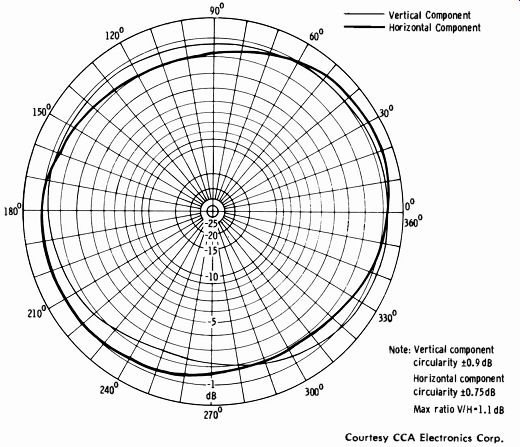
Fig. 10-10. Free-space circularity patterns of CCA FMC antenna.
The Harmonic Filter
A harmonic filter is normally used in series with the antenna feed to provide a high attenuation to harmonics and negligible attenuation to the fm band. A description of the Jampro JF-50 harmonic filter follows.
The JF-50 fm harmonic filter is designed for use with high-power fm transmitters (up to 50 kilowatts) operating into a transmission line having a standing-wave ratio no greater than 1.10 to 1. The input-frequency level is the reference for the harmonic attenuation. The filter is tuned for best response for a given frequency in the fm band and is fixed-tuned to a given channel prior to shipment. The design passband of the filter is two megahertz wide. There are no spurious passbands in the range from the fundamental to the tenth harmonic that are not attenuated at least 10 dB.
The attenuation in the desired passband is negligible due to the basic design of the filter.
The filter is designed to be inserted into a standard 3 1/2-inch, 50-ohm transmission line between the transmitter and the antenna. The filter is air tight but will pass air as required in a pressurized system. To install the unit, simply replace a section of transmission line with the filter and make connections in the standard manner. In the installation, observe the input and output markings on the filter. The filter is provided with 3 1/8-inch EIA flanges and fixed bullets.
The filter consists of a series of constant-k midsections with a constant-k half-section at the input and output to provide an impedance match to the 50-ohm transmission line. The constant-k sections have been designed ac cording to conventional filter theory. They are assembled as shown in Fig. 10-I1A. The equivalent electrical circuit is shown in Fig. 10-11B. The midsections have a cutoff frequency of 110 MHz, and the half-sections are designed with a slightly higher cutoff frequency to provide a good impedance match over the fm band.
(A) Physical arrangement. (B) Schematic diagram.
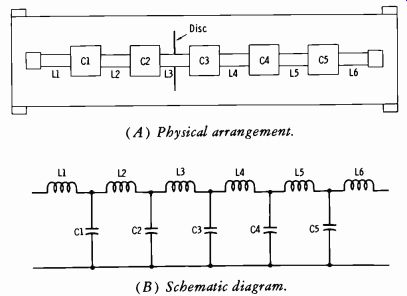
Fig. 10-11. Typical harmonic filter.
The L and C circuit elements are made up of lengths of coaxial transmission line. A section of low-impedance line is used for C, and a section of high-impedance line is used for L, as is illustrated in Fig. 10-11A. In a filter of this type using a series of coaxial elements, there will be several frequencies in the attenuation band at which compensation between elements occurs, causing transmission through the filter. The small disc between C2 and C3 is used to eliminate or reduce this effect in the harmonic ranges of the filter out to the tenth harmonic.
The filter has a very low vswr (under 1.06 to 1 for the frequency of operation). During tests of the unit, the positions of the C sections are adjusted slightly to obtain the best vswr.
The extremely low insertion loss makes it possible to use this filter under high-power conditions without heat damage. All of the internal insulation is Teflon.
In normal operation, the filter will show a very poor vswr to harmonic energy. The harmonics, depending on their amplitude with respect to the fundamental, may cause excessively high reflectometer readings when the reflectometer is inserted between the transmitter and the harmonic filter. In this event, it is recommended that the reflectometer probe be inserted in the transmission line between the filter and the antenna.
10-3. FREQUENCY MODULATION (FM) AND PHASE MODULATION (PM)
The two basic methods employed to obtain a frequency-modulated carrier wave are phase modulation (pm) and direct frequency modulation (fm) .
Basic block diagrams of the two types of transmitters appear in Fig. 10-12.
(A) Direct fm. (B) Phase modulation.
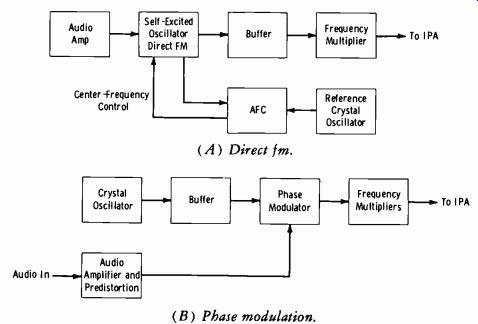
Fig. 10-12. Block diagrams of pm and fm transmitters.
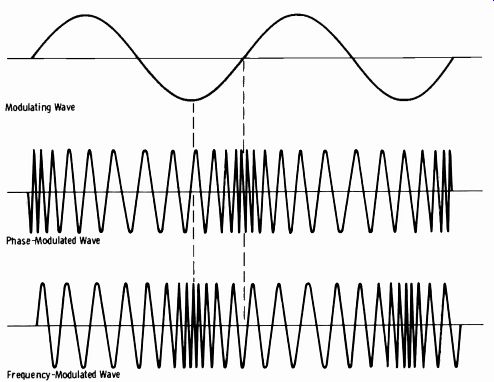
Fig. 10-13. Comparison of phase and frequency modulation.
Modulation Methods
In direct fm (Fig. 10-12A), a self-excited, voltage-controlled oscillator is varied in frequency at the audio rate applied. The frequency deviation is proportional to the instantaneous amplitude of the modulating signal. The frequency of the modulating signal determines the rapidity of the swing through the center carrier frequency.
In pm (Fig. 10-12B), frequency deviation is also proportional to the instantaneous amplitude of the modulating signal, but the rapidity (frequency) of phase shift is determined by the modulating signal frequency.
Therefore, the frequency deviation in pm is proportional to both the amplitude and frequency of the signal applied.
Fig. 10-13 illustrates the difference between pm and fm carriers modulated by identical sine-wave signals. Note that for pm, maximum carrier frequency occurs during the maximum rate of change of the modulating sine wave (intervals between peaks) . For fm, maximum carrier frequency occurs on the negative peaks of the modulating signal, and minimum carrier frequency occurs on the positive peaks ( for the particular system illustrated) . An fm receiver is designed to demodulate a pure fm signal.
For this reason, the audio prior to phase modulation is made to have a response inversely proportional to frequency (1/f,). This is shown in Fig. 10-12B as pre-distortion in the audio block. In this manner, pm is made equivalent to fm.
In the pm transmitter, the audio signal is applied in an amplifier stage, which allows a highly stable crystal oscillator to be used without further frequency control. In direct fm, a self-controlled oscillator must be modulated, and a separate highly stable crystal oscillator must be used to control the center operating frequency of the modulated oscillator. This is done by counting down from the modulated oscillator frequency, comparing a difference between this frequency and the reference crystal frequency, and deriving a dc voltage proportional to any amount of correction required.
This correction voltage is fed to the voltage-controlled modulated oscillator (vco) to hold the center carrier frequency at the assigned value. Both pm and fm transmitters are covered further in Section 10-4.
FM Sidebands
In angular modulation of a carrier wave (pm or fm) , the modulating signal adds no power to the carrier as it does with AM. The amplitude of the modulated carrier envelope remains constant, regardless of the amplitude or frequency of the modulating signal. Note that it is the modulation envelope that remains constant; the individual carrier cycles, of course, cross (positive and negative) through zero upward and downward to form this carrier envelope. Individual cycles of the carrier component and the various sidebands go to zero amplitude at specific values of the modulation index (m). This characteristic can be used to measure fm deviation under sine-wave modulation, as covered in Section 14.
In contrast to AM, angular modulation of a carrier with a single sine wave yields an infinite number (theoretically) of sidebands spaced by the modulation frequency, fm. In practice, the required bandwidth is deter mined by considering the number of significant sidebands. The term "significant" means those sidebands which have a voltage at least 1 percent (-40 dB) of the unmodulated carrier voltage. Sideband amplitudes be come negligibly small beyond a certain frequency range from the center carrier frequency, depending on the magnitude of the modulation index.
The modulation index (m) is:
OF m where, m is the modulation index, OF is the peak deviation in hertz, f is the modulating frequency in hertz.
For fm, the ratio of the peak frequency deviation of the carrier to the frequency of the modulating signal is m, the modulation index. The modulation index is equal to the peak phase deviation of the carrier in radians.
For pm, the peak phase deviation of the carrier in radians is the modulation index. As in fm, the modulation index is equal to the ratio of the peak frequency deviation of the carrier to the frequency of the modulating signal. Note therefore that the expression for the modulation index is the same for either fm or pm.
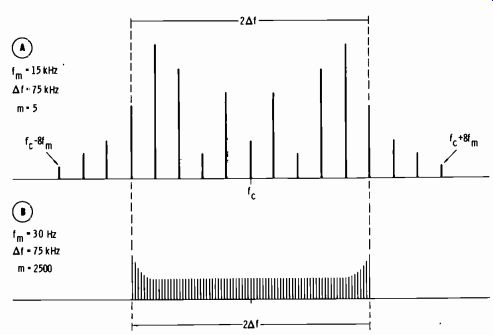
Fig. 10-14. Spectrum analysis of fm signals.
In fm broadcasting, 100-percent modulation is related to ±75 kHz frequency deviation. Thus for 100-percent modulation (delta_f = 75 kHz) and assuming a 15-kHz modulating sine wave (f.):
m=15 =5
For m = 5, actual spectrum analysis shows that the resulting signal has eight significant sideband pairs spaced fm apart (A in Fig. 10-14) . This actually exceeds the 150-kHz signal bandwidth allotted to fm broadcasting (150 kHz plus 25-kHz guard band at each side of the channel) . The actual significant bandwidth required for 100-percent modulation at 15 kHz may be seen to be:
(2) (8) (15 kHz) = 240 kHz
The justification for this characteristic is that program content does not have 15-kHz components that approach 100-percent modulation when the average program content itself is held to this amplitude.
The required audio response for fm broadcast transmission is 30 Hz to 15 kHz. The modulation index is 2500 for a 30-Hz signal at 100-percent modulation. As m approaches and exceeds a value of 100, the bandwidth becomes simply 2 Of = 150 kHz at the lower frequencies (B in Fig. 10-14).
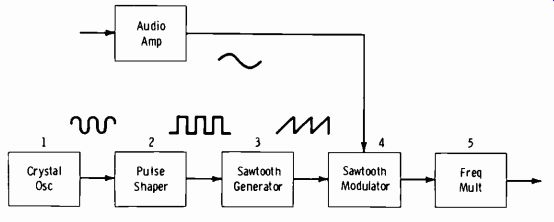
Fig. 10-15. Block diagram of pm exciter.
10-4. FUNDAMENTAL FM TRANSMITTER CIRCUITRY
An fm transmitter has essentially the same outward appearance as an AM transmitter. However, most of the circuitry is significantly different.
Basic Method of Phase Modulation
A block diagram of a typical pm exciter unit is shown in Fig. 10-15.
The basic function of each numbered block is as follows:
1. The crystal oscillator generates a stable sine-wave signal at a relatively low sub-multiple of the final assigned carrier frequency.
2. Pulse shaping is accomplished by overdriving a tube so that plate cur rent flows in short pulses and is cut off between pulses by the automatic bias developed by grid current. This shaping action is necessary for the following sawtooth generator.
3. The sawtooth is generated by charging a capacitor over a small linear time duration, then rapidly discharging it as the tube is driven into conduction by the plate pulses from the preceding stage. Thus a saw-tooth at the crystal-oscillator frequency is formed.
4. One of the tube elements, such as the control grid, receives the saw-tooth from the generator, while another element, such as the cathode, receives the amplified program audio. This modulator stage is usually operated with low plate-to-cathode voltage. The audio voltage super imposed on the static cathode-bias voltage shifts the point on the saw slope at which the tube begins to conduct so that the phase of the conduction point is advanced or retarded at the audio rate (Fig. 10-16). The actual phase shift, which is quite low for good linearity, is about 2 radians (roughly 120°) .
5. A string of frequency multipliers increases the crystal frequency to the assigned carrier frequency. As the frequency is multiplied, so is the phase shift; thus, the full 100-percent modulation ( which represents ±75 kHz for standard fm broadcast) can be achieved.
The method just described is termed phase-shift modulation employing pulse techniques, or sometimes serrasoid modulation. The average carrier frequency is tightly controlled by the crystal and is independent of the modulation process. The carrier is deviated only during the time the phase is being changed by modulation. Since the oscillator and modulator stages are fully isolated, the modulation process cannot affect the average carrier frequency. The pulses are converted to a phase-modulated sine-wave carrier by the following tuned amplifiers. There are other methods of pm, but this form is the most popular.
The audio signal is pre-emphasized at the transmitter before modulation.
A complementary de-emphasis circuit is employed in the receiver and in transmitter monitoring equipment. This arrangement improves the signal to-noise ratio so that extended dynamic range is a practical reality. Also in a pm transmitter, the response of the audio circuits driving the modulator must be inversely proportional to frequency. This is necessary to make pm equivalent to fm, as developed below.
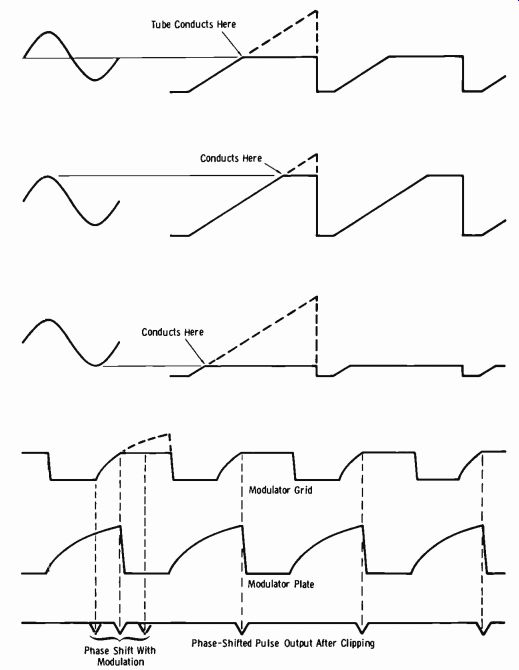
Fig. 10-16. Modulated sawtooth waveforms.
The relationship between the phase shift ( OB) in radians and the equivalent frequency deviation (OF) from the mean carrier frequency is:
= .F m
It should be noted that since the required phase shift in radians is directly related to the modulation index (m) , the maximum shift in radians occurs at the lowest modulating frequency to be considered. This is 30 Hz for fm broadcast. If the oscillator frequency is 100 kHz and the assigned carrier frequency is 100 MHz, a frequency multiplication of 1000 is required to obtain the proper carrier frequency. It was shown above that m = 2500 for a 30-Hz modulating frequency at 100-percent modulation (OF = 75 kHz). Then the required phase shift in radians of the 100-kHz signal is 2500/1000 = 2.5 radians. Since the phase shift is multiplied in direct ratio to the frequency multiplication, the required 2500-radian phase shift occurs at the multiplier output. Note also that at f,,, = 15 kHz (m = 5) only a 0.005-radian phase shift should occur in the modulator.
Thus the audio input to the modulated stage must be made to have a response proportional to 1/f,,,.
The Direct FM Oscillator
Many recent fm transmitters employ direct fm, which means that a self controlled oscillator is directly varied in frequency by the modulating signal. In earlier tube-type fm oscillators (many of which are still in use) , the reactance-tube method was the most popular form of circuitry, and we will review this method of modulation briefly before going to modern solid state techniques.
A typical reactance-tube circuit is illustrated in Fig. 10-17A. The circuit uses a pentode tube with the plate connected across the tank circuit of a self-excited oscillator. The two blocking capacitors on each side of the pentode plate lead have negligible reactance at the oscillator frequency and become essentially short circuits. The plate current and the grid voltage of the reactance tube are placed in quadrature (90°) with the plate-voltage swing by R and C. Since the plate current is in quadrature with the plate voltage, the tube appears as a voltage-controlled reactance across the oscillator tank circuit and therefore controls the oscillator frequency. With R much greater than the reciprocal of wC (where w = 2 pi f) , the reactance tube acts as a variable inductance. (The current lags the oscillator rf voltage by 90°.)
The audio voltage on the grid of the reactance tube varies the transconductance (g,,,) of the tube and therefore the magnitude of the simulated inductive reactance. The relationship is:
X= RwC gm
An increase on the positive alternation of the applied signal increases gm.
Since gm is in the denominator of the equation, an increase in value lowers the resultant magnitude of the inductance in the oscillator tank circuit and hence increases the frequency. A negative signal swing decreases g,,, and hence increases the inductive reactance, lowering the oscillator frequency.
The center operating frequency is held constant by a dc voltage from the afc circuit.
(A) Simulated variable inductance.
(B) Simulated variable capacitance.
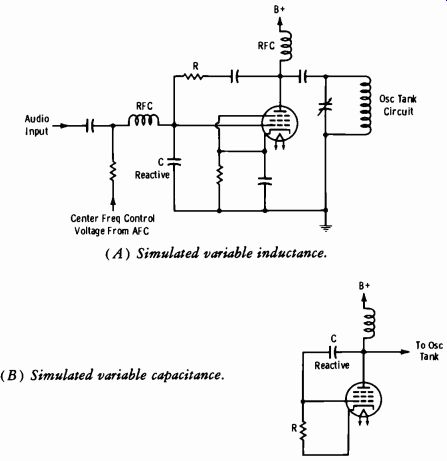
Fig. 10-17. Fundamental reactance-tube circuits.
If R and C are interchanged and R is made much less than 1 /WC, the circuit of Fig. 10-17B applies. In this case, the reactance tube appears as a voltage-variable capacitance across the oscillator tank circuit. The reactance is:
X= 1 g,,,RcwC
A positive signal swing increases gm, lowers the magnitude of the capacitive reactance across the oscillator tank, and decreases the frequency. A negative signal swing decreases gm, raises the value of the reactance, and increases the oscillator frequency.
The signal plate current of the reactance tube must be kept small relative to the oscillator tank current; otherwise, amplitude modulation may result.
Also, the transconductance of the reactance tube must vary linearly with grid voltage over the audio operating range for good modulation linearity.
Some direct fm transmitters employ push-pull reactance-tube modulators (employing a split oscillator tank circuit) to achieve very low harmonic distortion. Since push-pull stages are fed in opposite phase, one reactance tube acts as an inductance, and the other acts as a capacitance. A greater linear frequency deviation can be achieved in the direct fm oscillator by this method.
Solid-State Direct FM
In order to understand solid-state circuits for direct fm, it is necessary to be familiar with the characteristics of the voltage-variable-capacitance diode. The width of the barrier in a pn junction is influenced by the voltage across the junction. Since an electrostatic field is thus produced, the junction is the equivalent of two plates of a capacitor in which the spacing be tween the plates is governed by the voltage (and current) of the junction.
Figs. 10-18A and 10-18B illustrate this effect. Anything that increases the width of the pn junction barrier is equivalent to spreading apart the plates of the capacitor, resulting in less capacitance. As the reverse bias is decreased, the junction capacitance increases.
(A) Zero bias. (B) Reverse bias.
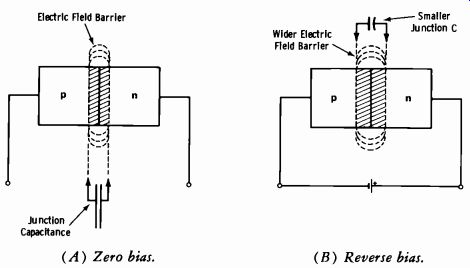
Fig. 10-18. Voltage-variable-capacitance diode.
(A) Typical small-signal diode. (8) Variable-capacitance diode.
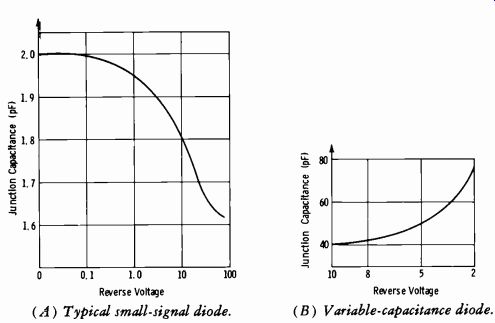
Fig. 10-19. Variation of junction capacitance with voltage.
Fig. 10-19A illustrates the junction-capacitance curve typical of nearly all signal diodes. Note that, in the reverse-voltage region of operation, the capacitance change is quite small over a 100-volt excursion. By comparison, Fig. 10-19B is an example (only) of the curve for one type of variable-capacitance diode. There are many different types of variable-capacitance diodes with different sensitivities in capacitance change per volt of change.
All of these diodes are typically nonlinear in capacitance-to-voltage change, as shown by this graph.
Some common circuits employ a voltage-variable diode capacitor which may be known as a variable-capacitance diode, varicap, or varactor. (The term "varactor" is usually applied to microwave devices.) This is a diode which is manufactured to maximize certain physical and chemical features affecting junction capacitance. Fig. 10-20 shows three symbols for this type of diode that may be found in practice on schematic diagrams.
Like the zener diode, the variable-capacitance diode is always operated in the reverse-biased condition. The capacitance decreases with increased reverse bias; that is, the capacitance varies inversely with the reverse bias voltage. The capacitance-versus-voltage relationship is nonlinear. The diode normally has a greater change in capacitance for a given change in applied voltage than the effective capacitance change in a conventional reactance-tube circuit.
When the total capacitance used to resonate a tuned circuit is split and used to form a feedback voltage divider, a Colpitts oscillator results. Fig.
10-21A illustrates a transistor Colpitts oscillator, in which C1 and C2 together set the effective capacitance with which L resonates. Remember that part of this capacitance is "hidden" in junction capacitance of the transistor. The important point at this time is to understand the effect of a capacitance diode on an LC tuned circuit.
Fig. 10-20. Symbols for voltage-variable-capacitance diodes.
Now look at Fig. 10-21B. This is the same circuit as the one in Fig. 10-21A, but with added components. Variable-capacitance diodes X1 and X2 must remain reverse biased at all times; this bias is supplied through resistors R1 and R2. Capacitors C3 and C4 are large and have negligible reactance at the oscillator frequency. Now assume that a signal is applied with a swing in the negative polarity. The effective capacitance of X1 and X2 varies with the instantaneous audio voltage. Since the diodes are effectively connected to the tank circuit, the resonant frequency is varied in step with the instantaneous audio voltage variation. For a negative excursion of the modulating signal, the reverse bias is increased. Since capacitance varies inversely with the reverse bias, the capacitance decreases, increasing the output frequency of the oscillator. Conversely, as the signal goes positive, the frequency decreases. The result is a frequency-modulated (but non linear) output.
Note that with the same type of transistor and the same polarity of audio input signal, X1 and X2 could be reversed in connection of polarity, with a reverse bias now of negative rather than positive polarity. In this case, the oscillator would be caused to decrease in frequency for negative swings and increase in frequency as the signal swings positive. If both of the foregoing oscillator circuits are used and the same audio signal is applied to both inputs, one oscillator increases in frequency as the other decreases. This is a push-pull type of frequency modulation which tends to cancel the non-linearity of modulation resulting from the nonlinear voltage-capacitance relationship of the diodes. When this type of modulation is not used, a nonlinear amplifier with characteristics inverse to those of the modulator must be used to restore linearity.
(A) Colpitts oscillator. (B) Fm Colpitts oscillator.

Fig. 10-21. Use of voltage-variable-capacitance diodes for direct fm.
Audio Pre-Emphasis
The relatively low energy of the higher-frequency components in speech and music makes it desirable to pre-emphasize the high-frequency components prior to modulation in the transmitter, and to employ a corresponding de-emphasis subsequent to demodulation in the receiver. This raises the resulting signal-to-noise ratio for a wideband receiver. The pre-emphasis curve employed at the transmitter is shown in Fig. 10-22 with the FCC limits prescribed.
The FCC standard is stated in terms of the L/R time constant of a series combination of inductance and resistance. The complementary de-emphasis constant is the RC time constant of a series combination of resistance and capacitance. The specified time constant is 75 microseconds.
The pre-emphasis network is normally part of, or immediately follows, the first amplifying stages for the audio signal within the transmitter. In a pm transmitter, this network precedes the 1/fm network required to convert pm to fm. Therefore, the 1/fm network works from the standard pre-emphasized signal, and the pm transmitter produces the same pre-emphasized signal as the fm transmitter. The receiver de-emphasis network receives the same signal characteristic whether the transmitter is pm or fm.
AFC for Direct FM
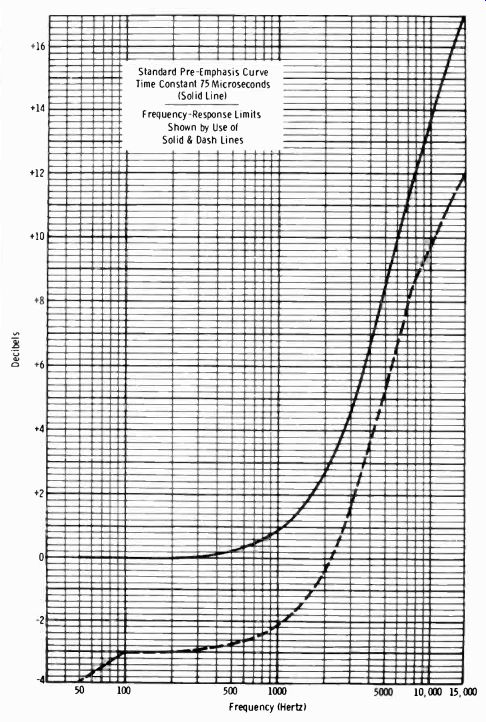
Fig. 10-22.
(A) Block diagram of exciter. (B) Block diagram of afc loop.
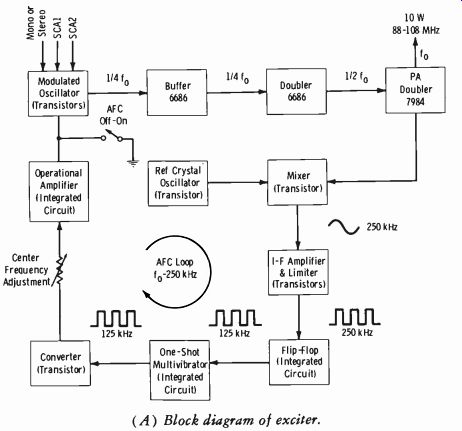
Fig. 10-23. CCA FM-10DS exciter.
Since a crystal oscillator cannot be employed for the direct fm process, some form of automatic frequency control (afc) must be used. In general, this depends on a highly stabilized crystal oscillator unit operating at some frequency below the assigned carrier frequency. This oscillator is used to obtain a beat frequency with the carrier, and the beat frequency is then counted down to a very low frequency to derive a dc with a magnitude and polarity that correspond to any drift of the center carrier frequency. This dc is applied to the modulated oscillator for center-frequency control.
Fig. 10-23A is a basic block diagram of the CCA FM-10DS exciter unit, which employs direct varicap fm with afc control. The reference crystal oscillator is a transistor stage. The crystal is a third-overtone type that operates at V2 of the required frequency. The oscillation and frequency multiplication are accomplished in the same stage by means of resonant circuits for the oscillator frequency and a frequency doubler. The output frequency of the circuit is 250 kHz below the desired carrier frequency of the fm exciter. The output of the oscillator is fed to a transistor mixer stage.
A sample rf signal obtained from the output stage of the exciter is fed through a resistor to the base of the mixer transistor. The IF (difference frequency) is obtained at the collector of the mixer after filtering of the high frequencies to ground by means of a capacitor. The IF is amplified by a transistor stage and is further amplified and limited by an additional stage. The IF thus obtained is centered at approximately 250 kHz, and it includes the modulation content of the fm exciter output.
A 250-kHz square-wave output of the limiter stage is fed to the flip-flop (integrated circuit), which divides this frequency by two and provides a consistent square-wave output. The output of the flip-flop is fed to the second integrated circuit, which is connected as a one-shot multivibrator. This circuit provides a square pulse of constant width and amplitude, regardless of the shape of the input pulse. The square pulse is obtained every time that the input signal goes in the positive direction.
The output of this IC consists of positive pulses of constant width and amplitude and a repetition rate that depends on the input frequency. The average dc content of the square pulses varies according to the frequency.
These pulses are applied to the converter stage, which consists of a transistor and a filter circuit. The output consists of a dc level proportional to the repetition frequency. The filter circuit is so designed that the modulation content of the intermediate frequency does not change the average dc out put; that is, the filter is unable to follow any frequency variation of more than 5 Hz. The dc circuit is completed through resistors to the -15-volt dc power supply.
The afc adjustment potentiometer (center-frequency adjustment) deter mines the amount of the dc voltage that is fed to the operational amplifier.
The position of the arm of this control can be selected such that its voltage is about zero volts dc when the intermediate frequency centers around 250 kHz. Any deviation from that frequency provides a dc voltage which will be amplified by the operational amplifier.
The gain of this amplifier is about 100 times, and its output is clamped through two gate diodes in order to hold the excursions to not more than plus or minus 4 volts. This afc correction voltage is applied to the anodes of the voltage-variable-capacitance diodes to hold the center frequency of the fm oscillator at the assigned value. When the afc action is to be disabled, a front-panel afc switch simply shorts the afc correction voltage to ground.
Fig. 10-23B is a simplified block diagram of the afc loop only; it shows the action required when an increase in center carrier frequency occurs.
In this transmitter, an increased negative potential on the varicap diodes increases the carrier frequency. Therefore, a corresponding shift of dc bias in the positive direction must be obtained from the afc loop.
It should be noted that a direct-fm transmitter requires very little frequency multiplication to obtain 100 percent modulation. Whereas pm transmitters require frequency multiplication of from 800 to 1000 times or more, the particular transmitter shown in Fig. 10-23 requires only a 4-times multiplication. Some direct-fm transmitters employ a frequency-modulated oscillator which operates at one-half the carrier frequency, and only one doubler stage is required.
The RCA 20E fm transmitter uses direct fm in which the full deviation occurs in the direct-fm oscillator, and no frequency multiplication is required. A basic block diagram is shown in Fig. 10-24. The diagram shows one of two units that are combined to make a 40-kW transmitter.
Automatic frequency control of the on-frequency basic oscillator is achieved by taking a sample of the buffer output frequency and dividing it by two, 14 times. A low-frequency reference crystal operating at 1/1024th of the desired output frequency is divided by two, 4 times. Integrated circuits operating in the saturated mode are used in both binary dividing chains. The outputs from the reference and basic-oscillator binary dividers are phase compared in a time-sharing IC comparator. The output of the circuit, which represents the afc error voltage, is filtered and applied to another pair of varicap diodes coupled to the tuned circuit of the basic oscillator. Thus, the basic oscillator is phase locked to the 1024th harmonic of the oven-controlled reference crystal.
An off-frequency detector is incorporated in the design of this fm exciter. When the basic-oscillator frequency is not phase locked to the reference crystal, an ac component appears at the afc output. This voltage is rectified to operate a relay the contacts of which can be used to turn off the transmitter.
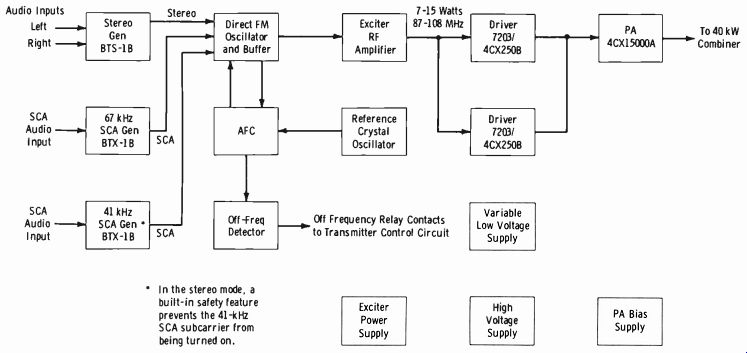
Fig. 10-24.
Parallel Operation of FM Transmitters
The parallel operation of AM transmitters was covered in the previous Section. This practice is becoming quite popular in fm installations as well.
Fig. 10-25 is a block diagram of the RCA BTF-40E1 fm transmitter, which employs parallel operation. The function of parallel fm transmitters operating through a hybrid coupler is basically the same as that described previously for AM transmitters. Fig. 10-26 shows the layout and dimensions of the BTF-40E1.
The BTF-40E1 is a di-plexed transmitter consisting of two 20E transmitters united by a combining panel. The di-plexed output combiner (a 3-dB hybrid coupler) and one 6 1/8-inch harmonic filter are external to the cabinets of the transmitter.
The combining panel consists of five sections, the first of which contains the following control and metering functions: Six illuminated push buttons are provided for operating the combined-unit on, off, plate on, and plate off, and to indicate transmitter overload and output-line vswr overload. Also located here are three meters essential for operation. A reject-power meter is used to indicate power into the air-cooled reject load. A reflected output power meter serves to indicate reflected power and to protect the transmitter from an unusually high vswr in case of a line or antenna fault. The control can be adjusted to any value of vswr. The third meter indicates power output.
The second section in the combining panel is used to mount the set-point module of the meter control and to mount the reflectometer adjustments and controls. Below this, a third section contains illuminated switches for exciter 1 or 2, a control-circuit line breaker, and a meter indicating reject power in the input balun. The fourth section has a control for adjustment of the line stretcher used for phasing the input circuits of the combined 20E transmitter units. The last section in the combining panel is a blank panel.
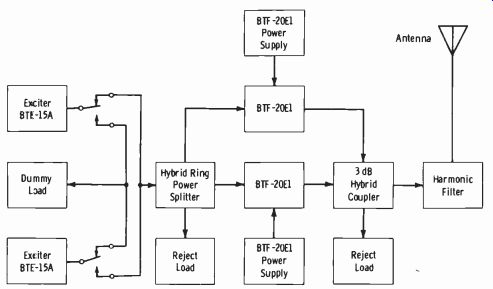
Fig. 10-25. Block diagram of RCA BTF-40E1 fm transmitter.
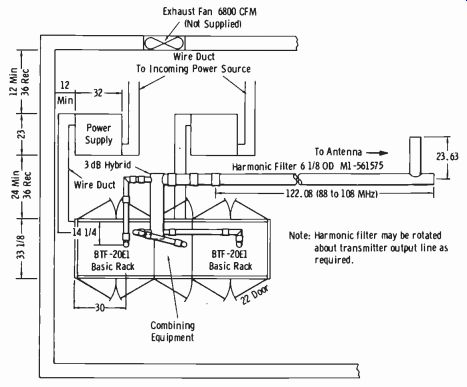
Fig. 10-26. Physical layout of BTF-40E1 transmitter.
In the top of the combiner unit is a thermostatically controlled blower so that in case of failure of either of the 20-kW transmitters, the heat from the 10-kW reject loads will be removed from the cabinet. Each air-cooled 5-kW load is also equipped with a thermostatically controlled fan for cooling.
The transmitter can be controlled as a 40-kW unit from the combining-cabinet panel, or as individual 20-kW transmitters from the individual control positions. The BTF-40E1 transmitter or the individual 20-kW sections can be operated by a remote-control system.
Relays automatically switch all inputs (stereo and two SCA channels) from one exciter to the other. The primary power to each exciter is always fed from the transmitter that is not shut down.
Two simplified, single-ended amplifiers (operating class C) follow the exciter in each 20-kW unit. The ipa stages consist of two ceramic 7203/ CX250B tetrodes operating in parallel, and both final power amplifiers contain Type 4CX15000A tubes. Variable vacuum capacitors are used to tune the interstage network between driver and power amplifier.
The power amplifiers also use pi-network circuitry; however, the tuning of these stages is accomplished by variable inductors operating at ground potential. The output tubes are designed for very high power gain with little drive. The power output is controlled by means of motor-driven vari able transformers connected in the primary of the low-voltage power sup ply for the driver amplifiers. This controls the ipa-plate and the pa-screen voltages simultaneously.
For increased transmitter stability and reliability, separate grid-bias sup plies are incorporated. These supplies are semiconductor rectifiers.
To keep spurious emissions at a minimum, the transmitter is furnished with a 6 1/2-inch harmonic filter. The filter consists of a series of transmission-line elements with a uniform-diameter outer conductor, a stepped inner conductor, and a shunt stub. The conductors are fabricated of a high grade copper alloy. Attenuation of all harmonic radiation above channel limits is accomplished in an m-derived section and a series of constant-k T-sections. This design provides a broad passband with a sharp high-frequency cutoff and excellent attenuation of frequencies above the passband.
The high-voltage power supplies are installed at any convenient place in the station. The cabinets house the high-voltage plate transformers, a bank of plug-in semiconductor rectifiers, a line circuit breaker, a low-power circuit breaker, and the plate contactor. Personnel are fully protected from shock through interlock and grounding switches.
The rectifier section contains silicon-junction diodes (with equalizing resistors and capacitors) in a three-phase, full-wave bridge circuit. Circuit breakers are used instead of fuses in the transmitter to add to the depend ability, particularly for remote-control operation.
The VSWR Meter
The power indicator and voltage-standing-wave-ratio (vswr) meter usually takes the form of a reflectometer. This is a combination of a directional coupling device and a diode detector circuit. This indicator provides a constant check on power output as well as showing the condition of the trans mission line and antenna system as they affect standing waves on the line. A basic diagram of a directional coupler is shown in Fig. 10-27. The loop might have both magnetic and capacitive coupling to the transmission line. The capacitive coupling is small, with a large reactance at the carrier frequency. Therefore the current through the resistor is in quadrature (90°) with the line current. The loop and resistor voltage drops are in series. For a wave traveling in one direction, the voltage across the trans mission line and the current in the line are in phase at a magnitude set by the characteristic impedance of the line (normally 50 ohms) . Since both the coupled voltage and the resistor voltage are in quadrature with the line current, the loop voltage is in phase with the resistor voltage, and the sum represents the directional-coupler output voltage.
(A) Coupling arrangement. (B) Equivalent circuit.
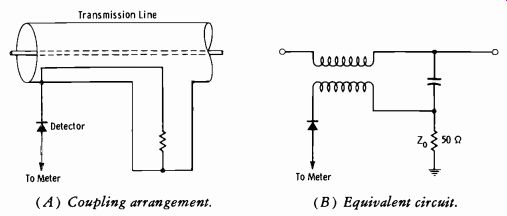
Fig. 10-27. Principle of directional coupler.
When any degree of impedance mismatch occurs at the sending or receiving terminals of the transmission line, the line voltage and current maxima and minima are no longer in phase, resulting in standing waves.
In the event of a standing wave ( wave on transmission line from opposite direction), the loop induced voltage is out of phase with the resistor voltage drop. Now, if the loop is adjusted so that these voltage drops are made equal, the coupler output voltage will be zero. In this way, the directional coupler can distinguish between waves traveling in opposite directions. It can be calibrated to measure power output, or, by comparing voltages of opposite wave direction, it can measure load mismatch or voltage standing wave ratio.
It is necessary to calibrate the reflectometer and then ensure maintenance of correct calibration in arbitrary terms of power output. Calibration is done with a dummy load and rf wattmeter.
10-5. SUBSIDIARY COMMUNICATIONS (SCA)
Paragraph 73.268 of the FCC Rules and Regulations pertains to fm modulation:
The percentage of modulation shall be maintained as high as possible consistent with good quality of transmission and good broadcast practice.
In no case is it to exceed 100 percent on peaks of frequent recurrence.
Generally, it should not be less than 85 percent on peaks of frequency recurrence; but where necessary to avoid objectionable loudness, modulation may be reduced to whatever level is necessary, even if the resulting modulation is substantially less than 85 percent on peaks of frequent recurrence.
NOTE: The "loudness" problem will be considered in greater detail in Section 11.
Paragraph 73.319 of the Rules and Regulations concerns the engineering standards for subsidiary communications multiplex operation:
A. Frequency modulation of SCA subcarriers shall be used.
B. The instantaneous frequency of SCA subcarriers shall at all times be within the range 20 to 75 kHz, provided, however, that when the station is engaged in stereophonic broadcasting the instantaneous frequency of SCA subcarriers shall at all times be within the range 53 to 75 kHz.
C. The arithmetic sum of the modulation of the main carrier by SCA subcarriers shall not exceed 30 percent, provided, however, that when the station is engaged in stereophonic broadcasting, the arithmetic sum of the modulation of the main carrier by the SCA subcarriers shall not exceed 10 percent.
D. The total modulation of the main carrier, including SCA subcarriers, shall meet the requirements of paragraph 73.268 (presented above) .
E. Frequency modulation of the main carrier caused by the SCA subcarrier operation shall, in the frequency range 50 to 15,000 Hz, be at least 60 dB below 100 percent modulation, provided, however, that when the station is engaged in stereophonic broadcasting, frequency modulation of the main carrier by the SCA subcarrier operation shall, in the frequency range 50 to 53,000 Hz, be at least 60 dB below 100 percent modulation.
Modern SCA operations are usually on 41 kHz and/or 67 kHz. The latter frequency is the most popular, since it can be used with either mono or stereo transmission, and interference traps in fm stereo receivers are usually tuned to this frequency.
The effect of the FCC rulings for SCA and/or stereo transmission on modulation percentages (when maximum SCA deviation is used) is as follows:
1. For mono transmission and one SCA: Maximum mono modulation: 70 percent (±52.5 kHz) Maximum SCA modulation: 30 percent ( ±22.5 kHz)
2. For mono transmission and two SCAs: Maximum mono modulation: 70 percent ( ±52.5 kHz )
Maximum SCA modulation (each): 15 percent (±11.25 kHz each)
3. Stereo transmission is covered in Section 10-6. At this time, we will consider only the modulation percentages involved in stereo with one SCA (two SCAs cannot be used with stereo, and the SCA subcarrier must be between 53 and 75 kHz, usually 67 kHz) :
Maximum Main Channel (L R) Modulation: 40 percent (±30 kHz) Maximum Stereo Sideband (L-- R or L-R only) : 40 percent (±30 kHz) Maximum SCA Modulation: 10 percent (±7.5 kHz) It should be noted that the above modulation percentages are in terms of the maximum allowed. Many mono stations have 100-percent SCA modulation referred to ±7.5 kHz with frequency response limited to 30 Hz to 7.5 kHz ( sometimes 30 Hz to 5 kHz) to allow greater modulation to be used on the main carrier. Similarly, some stereo stations employing simultaneous SCA have 100-percent SCA modulation referred to ±3.5 kHz.
The SCA subcarrier injection on the main carrier is of constant amplitude, but is frequency-modulated by the desired audio in the SCA genera tor. The system therefore can be termed fm on fm by the modulation process shown basically in Fig. 10-28. The subcarrier (modulated) deviates the main carrier at the SCA frequency. Since only a limited deviation relative to main-channel deviation is required, the SCA reactance circuit normally is connected only across a fixed portion of the master-oscillator tank circuit.
10-6. STEREO TRANSMITTERS
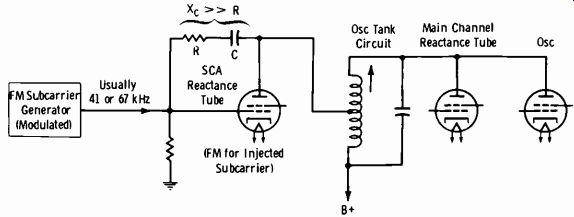
Fig. 10-28. Main-channel and SCA modulation of oscillator.
As was stated in Section 7, the number one requirement in stereo is compatibility, which means that (1) a standard receiver can reproduce a monophonic output from a stereocast and (2) a stereo receiver can repro duce a monophonic program. The left and right channels in the studio (which may originate at microphones, a stereo record pickup, or a stereo magnetic-tape head) are used to form sum and difference signals:
Sum = L + R Difference = L –R
The L + R signal is fed into the fm modulator in the conventional manner and is the 30-15,000 Hz signal used in monophonic receivers. The L-R signal provides one input to a balanced modulator; a subcarrier of 38 kHz is the other input. The subcarrier is balanced out, or suppressed, and only the double sidebands of the L-R amplitude-modulated signal remain.
These are added to the main-channel signal and are used by a stereophonic receiver to supply the right speaker. The right signal is subtracted from the L + R signal to supply the left speaker.
(A) Without SCA. (B) With SCA.
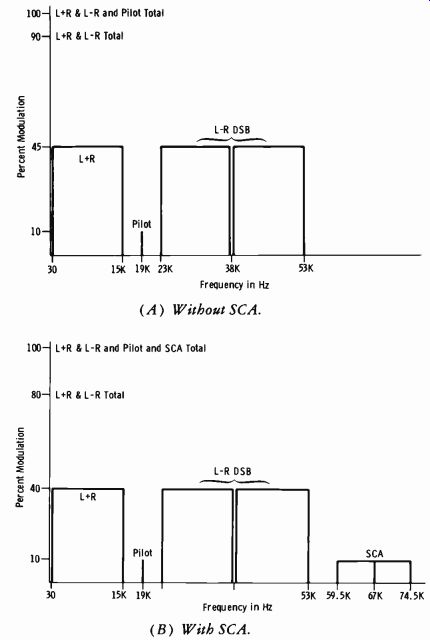
Fig. 10-29. Frequency distribution of fm stereo signal.
The respective modulation levels are shown in Fig. 10-29A. The sum and difference signals are allowed 45 percent modulation each, and the pilot signal is allowed 10 percent, for a total of 100 percent. (The pilot frequency is one-half the subcarrier frequency and is used by a stereophonic receiver to reinsert the subcarrier frequency.) Since an additional subcarrier is used in SCA, the respective modulation levels are reduced to allow for the 10-percent SCA subcarrier modulation (Fig. 10-29B) .
Fig. 10-30 is a block diagram of a basic stereo transmitter. Each numbered block functions as follows:
1. Both left and right audio inputs pass through filters which are essentially flat to 15 kHz and roll off sharply beyond that frequency. This prevents any spurious signals in the 19-kHz pilot region or the region of the L-R sidebands.
2. Both channels are pre-emphasized by the standard 75-microsecond characteristic specified by the FCC.
3. The two channels feed a matrix which derives the sum and difference signals. This circuit is simply a cross-connected voltage divider (Fig. 10-31).
4. The sum signal feeds the normal audio input of the fm modulator. This signal occupies the conventional 30-15,000 Hz bandwidth.
5. An adjustable time delay is used to meet the FCC requirement that any phase difference between the two signals as received at the receiver matrix shall not exceed ±3° at any frequency between 30 Hz and 15 kHz. This is necessary to assure proper separation between left and right channels. (In practice, the delay adjustment may be found in either the left or right channel.)
6. A crystal oscillator generates the 19-kHz pilot.
7. The times-2 multiplier generates the 38-kHz subcarrier frequency.
8. If the subcarrier is fed to a single-ended input of a stage which is connected push-pull at the plates, the signal is cancelled, or sup pressed. This is one form of obtaining the suppressed-carrier stereo signal. The L-R signal amplitude-modulates the subcarrier rf; therefore the output consists of a double-sideband, suppressed-carrier signal. Since the sidebands extend to a maximum value at the highest modulating frequency, the total spectrum is:
38 kHz + 15 kHz = 53 kHz 38 kHz- 15 kHz = 23 kHz
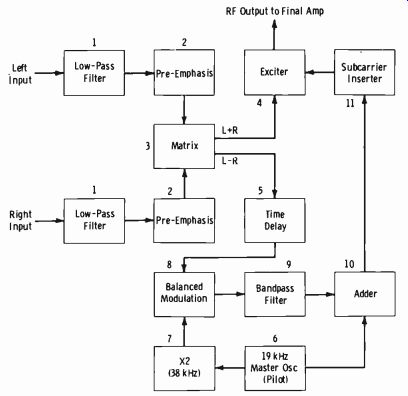
Fig. 10-30. Block diagram of basic stereo transmitter.
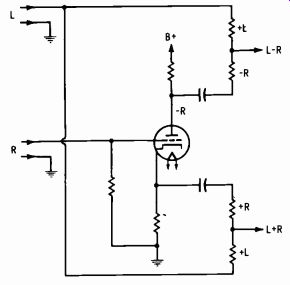
Fig. 10-31. Inverter-tube stereo matrix.
Thus, the sidebands extend from 23 kHz to 53 kHz, and the total spectrum is 30 Hz to 53 kHz for stereo only or 30 Hz to 74.5 kHz when SCA is added.
9. The bandpass filter removes residual L-R audio components in the frequency range of 30-15,000 Hz and harmonics outside the range of 23-53 kHz.
10. The adder accepts the 19-kHz pilot and the output of the bandpass filter. At the output of this stage are the double-sideband suppressed-carrier difference signal and the proper amplitude of the 19-kHz pilot.
11. The subcarrier inserter is essentially a phase modulator which places, or frequency modulates, the subcarrier signal onto the main signal.
The 19-kHz pilot also frequency modulates the main carrier.
Principles of the Stereo Receiver
The stereo receiver (Fig. 10-32) is conventional up to the discriminator output. Here, the L + R signal in a monophonic receiver would produce a compatible monophonic program.
The amplifier-filter arrangement in a stereo receiver separates the L + R signal, the L-R sidebands, and the 19-kHz pilot. The pilot is doubled in frequency to recover the 38-kHz subcarrier which in turn is mixed with the L-R sidebands to obtain a conventional amplitude-modulated signal.
This is detected to produce the L-R signal for the matrix. The outputs of the matrix, after de-emphasis in the normal manner, produce the original left and right stereophonic signals.
Why are a suppressed subcarrier and subharmonic pilot used? This is done for two important reasons:
1. The 19-kHz pilot falls in a clear-channel portion of the discriminator output. Thus, a simple filter in the receiver can isolate the pilot to recover the subcarrier.
2. The suppressed subcarrier is used for the resulting interleaving which would permit 90 percent maximum deviation on the main channel as well as 90 percent on the subchannel. (The remaining 10 percent is used for the pilot.) This is possible because one channel is deviating the main carrier at a peak while the other is zero, and vice-versa.
(The sum of two variables, L + R, is maximum when their difference, L- R, is minimum.) Thus, the monophonic listener experiences a signal-to-noise loss of less than 1 dB.
The subcarrier is also suppressed (to less than 1 percent) so that the main and subchannel fm deviations are limited only by the necessity to provide for the 10-percent pilot-subcarrier modulation.
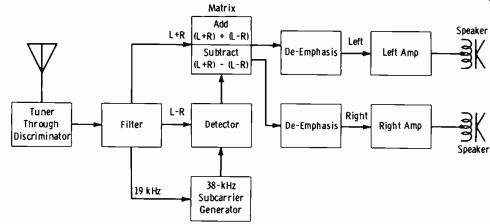
Fig. 10-32. Block diagram of stereo receiver.
Stereophonic Transmission Standards
The following standards are from paragraph 73.322 of the FCC Rules and Regulations:
A. The modulating signal for the main channel shall consist of the sum of the left and right signals.
B. A pilot subcarrier at 19,000 Hz plus or minus 2 Hz shall be trans mitted that shall frequency modulate the main carrier between the limits of 8 and 10 percent.
C. The stereophonic subcarrier shall be the second harmonic of the pilot subcarrier and shall cross the time axis with a positive slope simultaneously with each crossing of the time axis by the pilot sub-carrier.
D. Amplitude modulation of the stereophonic subcarrier shall be used.
E. The stereophonic subcarrier shall be suppressed to a level less than one percent modulation of the main carrier.
F. The stereophonic subcarrier shall be capable of accepting audio frequencies from 50 to 15,000 Hz.
G. The modulating signal for the stereophonic subcarrier shall be equal to the difference of the left and right signals.
H. The pre-emphasis characteristics of the stereophonic subchannel shall be identical with those of the main channel with respect to phase and amplitude at all frequencies.
I. The sum of the sidebands resulting from amplitude modulation of the stereophonic subcarrier shall not cause a peak deviation of the main carrier in excess of 45 percent of total modulation (excluding SCA subcarriers) when only a left (or right) signal exists; simultaneously in the main channel, the deviation when only a left (or right) signal exists shall not exceed 45 percent of total modulation (excluding SCA subcarriers).
J. Total modulation of the main carrier including pilot subcarrier and SCA subcarriers shall meet the requirements of Section 73.268 with maximum modulation of the main carrier by all SCA subcarriers limited to 10 percent.
K. At the instant when only a positive left signal is applied, the main channel modulation shall cause an upward deviation of the main carrier frequency, and the stereophonic subcarrier and its sidebands signal shall cross the time axis simultaneously and in the same direction.
L The ratio of peak main-channel deviation to peak stereophonic sub-channel deviation when only a steady-state left (or right) signal exists shall be within ±3.5 percent of unity for all levels of this signal and all frequencies from 50 to 15,000 Hz.
M. The phase difference between the zero points of the main-channel signal and the stereophonic subcarrier-sidebands envelope, when only a steady-state left (or right) signal exists, shall not exceed ±3° for audio modulating frequencies from 50 to 15,000 Hz.
NOTE: If the stereophonic separation between left and right stereophonic channels is better than 29.7 dB at audio modulating frequencies between 50 and 15,000 Hz, it will be assumed that paragraphs L and M of this section have been complied with.
N. Cross talk into the main channel caused by a signal in the stereo phonic subchannel shall be attenuated at least 40 dB below 90 percent modulation.
O. Cross talk into the stereophonic subchannel caused by a signal in the main channel shall be attenuated at least 40 dB below 90 percent modulation.
P. For required transmitter performance, all of the requirements of Section 73.254 shall apply with the exception that the maximum modulation to be employed is 90 percent (excluding pilot subcarrier) rather than 100 percent.
Q. For electrical-performance standards of the transmitter and associated equipment, the requirements of Section 73.317 (a) (2) , (3) , (4) , and (5) shall apply to the main channel and stereophonic sub-channel alike, except that where 100 percent modulation is referred to, this figure shall include the pilot subcarrier.
Additional Discussion of Standards
The following paragraphs contain clarifications of certain aspects of the FCC rules most important in maintenance.
FCC Paragraph 73.322(c)--Standardization of the polarity of the sub-carrier relative to the pilot subcarrier is necessary to provide identification of the left and right channels. If the second harmonic should cross the time axis with a negative slope at the transmitter and a positive slope at the receiver, the left channel as transmitted would be reproduced in the right channel of the receiver, and conversely.
FCC Paragraph 73.322(k)--Essentially the same reasoning applies as for paragraph 73.322 (c). In this case, the relationship of the left-plus-right signal relative to the left-minus-right signal is maintained. If the transmission standards varied from station to station (deviation upward in some transmitters and downward in others) , the left and right channels would be reversed in the receiver, depending on the particular fm station being received.
FCC Paragraphs 73.322(1) and (m) –
These paragraphs give the FCC requirement for channel separation. Paragraph I specifies the required amplitude response of the two channels, and paragraph m specifies the phase response. With a steady-state signal in the left channel only, signals of the same frequency and equal amplitudes (within 3.5 percent) exist in the left-plus-right and left-minus-right channels. The phase difference be tween the left-plus-right and left-minus-right signals must not exceed ±3° between 50 and 15,000 Hz.
The preceding may be summarized by stating that for proper channel separation, the left-plus-right and left-minus-right channels must have the same frequency response, and all frequencies in both channels must arrive at the receiving matrix at the same time (in the proper phase relationship) .
The FCC note following paragraph m specifies when further measurements in checking channel separation are required. For a given signal in the left channel only, adjustment is satisfactory if the signal recovered at the receiver (or receiver-type monitor) in the right channel is attenuated at least 29.7 dB. This must be true throughout the frequency range of 30 to 15,000 Hz. If this check is negative, further measurements of the frequency and phase response must be made.
FCC Paragraphs 73.322(n) and (o) –
These paragraphs specify transmitter requirements with respect to cross talk from the left-minus-right channel into the left-plus-right channel (stereo subchannel into main channel) and cross talk from the left-plus-right channel into the left-minus-right channel (main channel into stereo subchannel). In either case, the ratio must be at least 40 dB relative to 90-percent modulation of the other channel.
Stereo Subcarrier Modulation
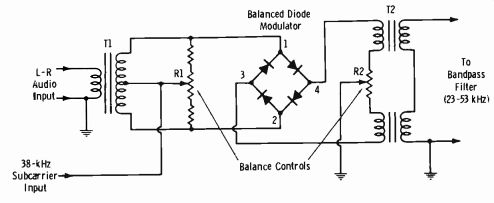
Fig. 10-33. Balanced modulator using diode bridge.
The conventional tube-type balanced modulator for modulating the 38-kHz subcarrier and suppressing the carrier frequency was mentioned in the preceding description. One of the earlier circuits using a diode bridge as a balanced modulator is shown in Fig. 10-33. The L-R audio signal across T1 is applied to terminals 1 and 2 of the bridge. The subcarrier in put is applied to the center tap of the secondary of T1. The resulting amplitude-modulated output of the bridge from terminals 3 and 4 is applied across the primary of T2. Balance control R2 effectively grounds the center tap of this transformer so that, with proper bridge balance, the net value of the 38-kHz frequency can be made to be essentially zero. Balance control R1 can be adjusted so that the sideband components across T2 are of equal value on both sides of the carrier frequency.
In practice, stereo signals can be derived either by the matrix and balanced modulator technique covered thus far, or by a time-division or sampler technique. Both techniques are mathematically equivalent and perfectly valid. The sampler (time-division) technique gives excellent results with greater simplicity.
An example of a commercial fm stereo generator employing time division is the CCA Model SG-1D. A simplified block diagram of this system is shown in Fig. 10-34.
The most obvious advantage of the time-division method is the fact that mono and stereo signals follow the same path. When the mono and stereo channels are developed, they appear at a common point and do not go through different circuits, which could introduce undesirable delays. In Fig. 10-34, the left and right signals are fed through matching transformers into the left and right amplifiers. These are two identical amplifiers with flat frequency response; however, when the pre-emphasis switch is on, the frequency response of the amplifier is modified through a frequency-sensitive negative-feedback network, and the response of the amplifiers follows very closely that of the 75-microsecond pre-emphasis required for fm broad casting.
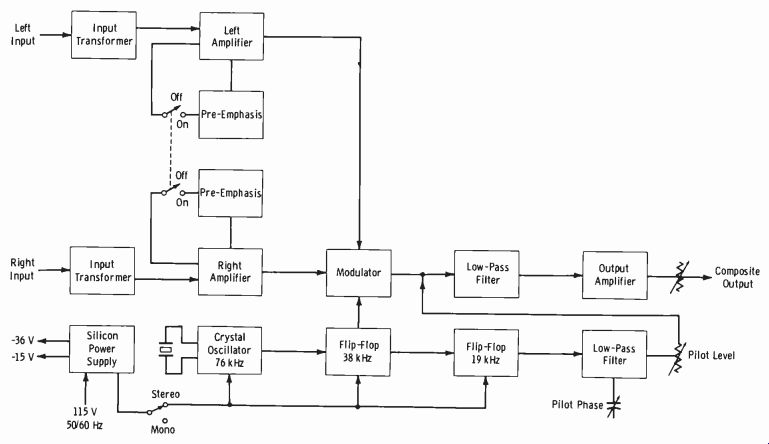
Fig. 10-34.
The 38-kHz subcarrier frequency and the 19-kHz pilot are generated in the following manner. A crystal oscillator operates at 76 kHz. This oscillator drives a flip-flop that divides the frequency by 2, providing a 38-kHz square wave on each one of the two transistor collectors. At the same time, this flip-flop drives another flip-flop, which in turn divides the frequency to 19 kHz. This 19-kHz square wave is filtered by a low-pass filter, and only the fundamental 19-kHz sine wave is obtained at the output. This is followed by a pilot level control and a phase control. The 19-kHz signal is then added to the modulator output to form the composite signal.
The left and right signals are fed to transistor switchers that are turned on and off at a 38-kHz rate. This switching alternately shorts to ground the left and right signals.
The switching process creates high-order harmonics of the 38-kHz signal and its sidebands; thus a low-pass filter is included in the circuit in order to eliminate frequencies above 53 kHz. This low-pass filter has flat frequency response up to 53 kHz, and its phase linearity is such that the total time delay is the same at any frequency from 30 Hz to 53 kHz. The output of the low-pass filter is fed to the output amplifier.
The power supply includes a full-wave bridge rectifier which provides voltages of-15 and-36 volts. These voltages are regulated with zener diodes so that the output signal level of the generator is independent of power-line variations.
Circuit Analysis of CCA Stereo Generator
See Fig. 10-35 for the following circuit analysis. The audio signal is connected to a balanced input transformer which provides proper matching with the input line. Potentiometer R22 is provided in the right channel to adjust the signal level slightly for compensation purposes.
The left and right amplifiers are identical. There is a negative-feedback loop the frequency response of which is flat when the pre-emphasis switch is in the off position; the frequency response can be changed to match a 75-microsecond pre-emphasis when the switch is on. This is done by means of capacitors C3 and C11.
Two switching transistors are utilized in the modulator. They operate as grounded-emitter stages with the bases connected to the 38-kHz square-wave generator.
During one half period, transistor Q4 is saturated and Q5 is cut off; Q4 is cut off and Q5 is saturated during the other half period. The saturated transistor shorts the output of the corresponding amplifier to ground; the cut-off transistor allows the other signal to be amplified normally. This is done at the rate of 38 kHz, and it can be shown mathematically that this action generates the monaural left-plus-right signal as well as the required sidebands for left-minus-right signals centered on 38 kHz. At the same time, the 38-kHz subcarrier is eliminated to a high degree. The switching system produces third-order harmonics that are eliminated by means of the low-pass filter.
A highly stable crystal oscillator operates at 76 kHz. This frequency was chosen in order to facilitate the generation of the 38-kHz square wave. In this circuit, the crystal operates as a series resonant circuit. The output of the 76-kHz crystal oscillator is differentiated and utilized to trigger a flip flop which generates the 38-kHz square wave. This signal is used to switch the modulator transistors.
Another output of the 38-kHz flip-flop is differentiated and utilized to trigger a second flip-flop, the output of which is a 19-kHz square wave.
The output of this flip-flop is filtered by means of a low-pass filter to eliminate all frequencies above the fundamental 19 kHz. Inductor L4 of the second section of the filter is utilized as a pilot-phase control.
The output of the 19-kHz low-pass filter is connected to a potentiometer labeled PILOT LEVEL CONTROL. This potentiometer is set to inject the proper amount of 19-kHz pilot signal directly at the output of the modulator.
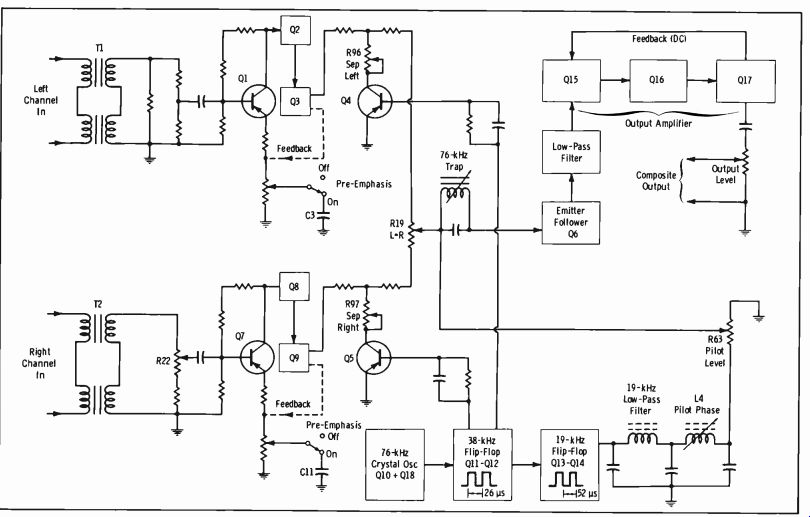
Fig. 10-35.
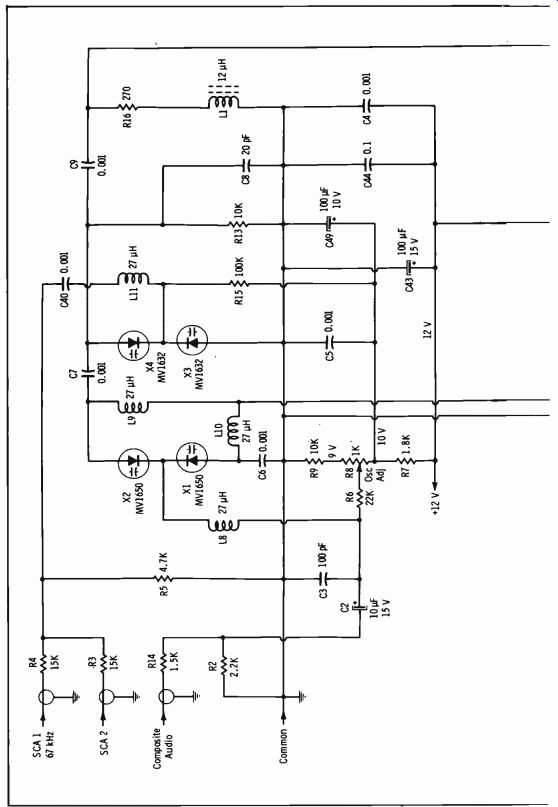
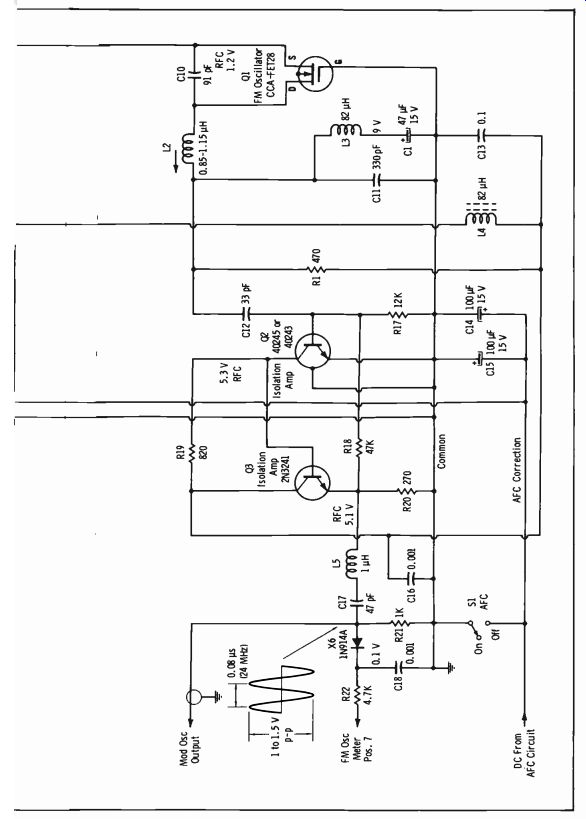
Fig. 10-36.
After the pilot subcarrier and the modulator output signal are combined, the composite signal passes through a parallel tuned circuit which eliminates the 76-kHz spurious components that remain after the modulating process. This trap allows a reduction of spurious content well below the interference level of an SCA system, if used. The signal is fed next to the base of an emitter-follower transistor, which provides impedance matching with the low-pass filter.
The low-pass filter provides a flat frequency response and linear phase characteristics up to 53 kHz. This filter reduces the second group of harmonics centered at 76 kHz, but the most important function is to attenuate the third-order harmonics centered at 3 times 38 kHz, or 114 kHz. It should be noted that the SG-1D would meet FCC spurious-signal specifications without the low-pass filter and the 76-kHz trap, but they are considered a worthwhile addition.
The composite stereo signal is amplified by means of a 3-transistor out put amplifier. The circuitry is similar to the two input amplifiers, and it provides a signal level capable of modulating most of the existing fm exciters for broadcast transmission. The output-level control selects the proper level to modulate the fm exciter fully.
Not shown in the simplified schematic is the means of mono-stereo operation control. The transition from mono to stereo operation is achieved by a multiple-contact relay. This relay can be operated by means of the front-panel stereo switch, or it can be operated by a remote stereo switch connected to the proper terminals of the generator.
When the relay is energized, all the circuits are completed for proper stereo operation as described above. When the relay is de-energized, the following changes are accomplished:
A. The two transistor switches are disconnected from the circuit.
B. The two flip-flops are de-energized. In addition, a set of contacts connects a resistor, which has the same power consumption as the previously disconnected stages, in order to keep a constant load on the power supply.
C. Another function accomplished by the relay contacts is to introduce an attenuator pad so that the total modulation of the transmitter will be kept constant when the change is made from stereo to monaural operation. This compensates not only for the inherent change of signal level of the stereo system, but also for the 10-percent modulation utilized by the pilot.
NOTE: The proper adjustments of separation, pilot phase, etc., are covered in Section 14.
Main Carrier Modulation The generation of the composite stereo signal, ready to frequency-modulate the main-carrier oscillator of the exciter unit, has been described. Fig. 10-36 shows the schematic of the frequency-modulated oscillator ( fmo) in the CCA FM-10DS exciter.
The frequency-modulated oscillator is built around Q1, an insulated-gate field-effect transistor (IGFET). The operating frequency of the oscillator corresponds to the resonance of inductor L2 and the capacitance connected from each end of the inductor to ground. The capacitance on one side of L2 is composed of C10 in series with a combination of several capacitors, including fixed capacitor C8 in parallel with two sets of voltage-variable capacitors (diodes X1 and X2 and diodes X3 and X4).
The voltage-variable-capacitor (vvc) diodes are connected as back-to back pairs. These diodes are reverse-biased at about 10 volts dc so that they operate as capacitors with capacitance that varies inversely with the bias voltage. If the variation of voltage is small compared with the fixed bias, the capacitance change will be in a linear region.
From the point of view of the external bias applied to the pair of vvc diodes, the increase or decrease occurs in the same direction, so that even when they are connected in series in the rf circuit, the total capacitance still goes up or down depending on the change of bias. (The modulating signal can be considered a fast variation of dc bias.) Any voltage applied across the two diodes in series will change the bias of the two diodes in opposite directions, thus tending to cancel the overall change of capacitance, making the pair quite insensitive to the application of voltage across the two diodes in series. This is the case for rf voltage applied to the diodes by the oscillator circuit; thus it can be seen that this approach minimizes frequency drift caused by changes in amplitude of the oscillator rf voltage.
A second pair of vvc diodes is biased with a fixed voltage and, in addition, receives the SCA subcarrier modulation.
The dc bias for X1 and X2 is obtained from a zener diode, and it goes through a trimming adjustment consisting of adjustable resistor R8, which is labeled OSCILLATOR ADJUSTMENT. A small change in the bias voltage is utilized as a fine adjustment to set the center frequency of the modulated oscillator. The coarse adjustment is obtained by tuning L2.
The dc path for the anodes of X1 and X2 is returned to ground through the output resistor of the afc circuit; thus if the afc system (previously de scribed) applies a correcting voltage to the fmo, it will be applied to the anodes of X1 and X2. The composite audio modulation signal is applied to the cathodes of the two diodes through a combining circuit that adds it to the fixed bias previously described.
The output signal of the oscillator is obtained across C11, which constitutes a low-impedance output. This reduces any interaction on the oscillator from the following stages. The isolation stage that follows the oscillator consists of a pair of transistors that provide an increase in signal level as well as a high-impedance input and a low-impedance output. The amplified signal is finally applied to the external amplifier-multiplier in order to multiply the frequency by four and increase the output power to a nominal 10 watts (2-to-12 watt range).
The rf output signal level is detected by diode X6. The resultant dc component is utilized to measure the activity of the oscillator circuit when the multimeter switch is in the proper monitoring position.
(A) Modulation and SCA frequency monitor. (B) Main-carrier frequency monitor. Courtesy McMartin Industries, Inc.
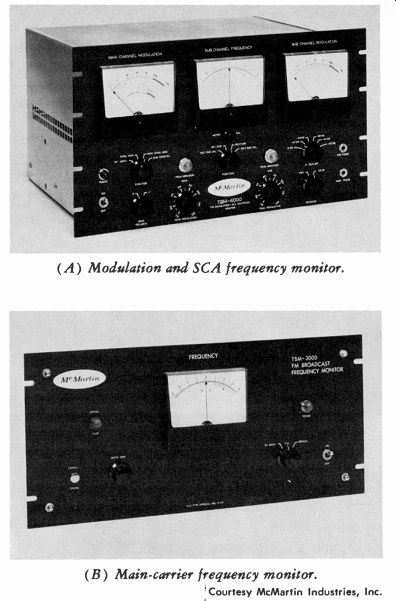
Fig. 10-37. Fm broadcast monitors.
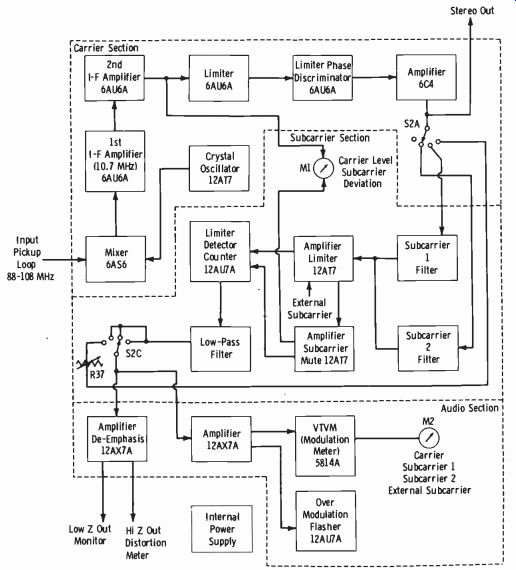
Fig. 10-38. Block diagram of RCA BW-73A fm multiplex monitor.
10-7. FM FREQUENCY AND MODULATION MONITORS
For fm broadcasting, the modulation and frequency monitors are normally combined in a single unit. For stereo and SCA broadcasting in addition to regular service, two units may be required. Fig. 10-37A shows a monitor for the main and subchannel modulation and the subchannel frequency. This unit, combined with a standard frequency monitor (Fig. 10 37B) provides complete main-carrier and SCA-multiplex monitoring.
A block diagram of the RCA BW-73A fm multiplex monitor is shown in Fig. 10-38.This unit indicates total modulation on the main carrier, the subcarrier (s) modulation of the main carrier, percent program modulation on each subcarrier, and the swing on any external subcarrier. It also measures the rf input level to assure proper operating conditions in the monitor. A front-panel flasher lamp with adjustable threshold indicates modulation peaks in any of the above services. In addition, outputs are available for aural monitoring through phones or station lines. The monitor gives continuous indication directly in percent of main carrier deviation by the subcarrier.
Terminals are provided for the connection of external meters for remote monitoring of all metered functions. A separate output is provided for interconnection of the station's distortion and noise meter. With this arrangement, accurate measurements of signal-to-noise ratio, distortion, and frequency response may be made quickly. Similarly, the unit can be used to measure main-to-subcarrier and subcarrier-to-subcarrier cross talk.
The rf input signal is injected on a 50-ohm line, and the level is adjusted according to meter indication. The input level chosen was such that the monitor would be capable of making overall transmitter measurements and yet be relatively insensitive to spurious or unwanted signals. The oscillator is crystal controlled and operates at 10.7 MHz above the station channel.
The mixer stage is followed by broadband IF and discriminator circuitry.
The succeeding amplifier output is switch selected for choice of monitoring mode. The subcarrier filters are plug-in units allowing fast, convenient changes or additions of subcarriers should the need arise.
The subcarrier chain employs two double-anode zener diodes in cascade to provide stability of the limiting level. At this point, the fm wave is applied to a pulse-counter detector where it is demodulated. Residual sub-carrier is removed in a low-pass filter, and the remaining audio signal drives two separate stages. The first of these de-emphasizes the modulation, and it is this output which may be used for aural monitoring and distortion measurements in conjunction with an auxiliary distortion and noise meter.
The second stage is an amplifier for driving the peak-modulation indicator stage and the vacuum-tube-voltmeter modulation meter. The vtvm stage is compensated against zero drift. The ballistic characteristics of the meter meet the requirements of the FCC. The electronically regulated power supply is self-contained.
When used with the McMartin Model TBM-300 frequency monitor, this unit provides a complete station monitor.
EXERCISES
Q10-1. As a rule of thumb for horizontally polarized antenna systems, what is the power gain relative to the number of stacked bays?
Q10-2. If the power gain is 6, what is the gain in (A) dB, (B) field strength?
Q10-3. As a rule of thumb for circularly polarized antenna systems, what is the power gain relative to the number of stacked bays?
Q10-4. In terms of the modulating signal, give the characteristics determining the amount of frequency deviation for (A) fm, (B) pm.
Q10-5. What is done in a pm transmitter to make the output equivalent to an fm signal?
Q10-6. What is the instantaneous phase deviation in radians of an fm or pm carrier at 100-percent modulation for the modulating frequencies (A) 15 kHz, (B) 20 Hz?
Q10-7. What is the instantaneous shift in degrees for (A) and (B) of Q10-6?
Q10-8. What is the required frequency deviation of the oscillator stage in Fig. 10-23 for 100 percent modulation?
Q10-9. Is the SCA subcarrier amplitude modulated or frequency modulated?
Q10-10. Is the stereo subcarrier amplitude modulated or frequency modulated?
Q10-11. What information does the stereo subcarrier contain?
Q10-12. Give the frequency range of the stereo subcarrier sidebands.