Although a knowledge of basic electronics is assumed in this text, a brief review of some important principles is presented here.
9-1. REVIEW OF ANGULAR VELOCITY
When a sine wave is plotted on paper, its instantaneous values are related to the radius of a circle (Fig. 9-1) . The progressive points on the curve are in relation to the radius (A) as it rotates counterclockwise from the starting point at zero degrees. There are 360° in the entire circle, and the corresponding degrees of the curve are shown in the illustration. If the angle is measured in terms of the path along the circumference with the length of the radius as the unit of measurement, the angle is determined in terms of radians. When the length of the arc (B) is equal to the length of the radius (A), the angle is one radian. From geometry, the circumference of a circle is 2 pi times the radius. (The circumference of a circle di vided by its diameter is always ir, which is equal to 3.1416. Since the radius is one-half the diameter, there are 2 pi, or 6.28, radii in the circumference.) The radius divides the circumference 2 pi times. In degrees, then, one radian is 360° divided by 2 pi, or 57.3°.
As can be noted from the illustration, an angular rotation of 180° is equivalent to ?r radians, and 90° is one-half this amount, or pi^2 radians; 270° is 3 pi^2 radians, and 360° is 2 pi radians (Table 9-1).
The sine wave goes through one complete cycle for each rotation of the radius. The angular velocity (sometimes termed angular frequency or radian frequency) is the rate of rotation of the radius expressed in radians per second. The number of radians in one cycle, which is 2 pi (6.28) , is one of the most common numerical values in basic radio formulas. For example, inductive reactance is found by multiplying the value of inductance in henrys by 6.28 times the frequency. The value of capacitive reactance is 6.28(f ) (C) , divided into 1. In any of these formulas (with which the reader should already be familiar), the value 2 pi f should be understood to be the number of radians per cycle times the number of cycles occurring per second. The primary definition is:
w = 2 pi f where,
w (Greek letter omega) is the angular velocity in radians per second, f is the frequency in hertz (cycles per second), 2 pi is 6.28.

Table 9-1. Relation of Radians to Degrees
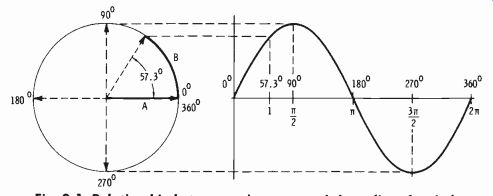
Fig. 9-1. Relationship between a sine wave and the radius of a circle.
9-2. REVIEW OF FREQUENCY-WAVELENGTH RELATIONSHIP
To understand the wave theory of propagation, it is necessary to correlate the speed of travel, the angular velocity, and the shape of the radiation pattern. The speed of travel, or velocity of propagation (do not confuse it with angular velocity), of a radio wave in space is the same as the speed of light, which has been accurately measured to be very nearly 186,000 miles per second. Since the metric scale is often used in scientific studies, the speed of propagation is taken as 300 million meters per second. There is an immediate relationship that occurs between the number of cycles per second ( frequency) of the radio wave and its "physical" length, or wave length.
NOTE: The unit of frequency is the hertz, abbreviated hz. One hertz is equal to one cycle per second.
One wavelength is the measurement of the length in space (or any given medium) occupied by one cycle of the wave. It is obvious that if the frequency is doubled, one cycle, or one wavelength, will occupy one-half as much space. In other words, the higher the frequency, the shorter is the wavelength; the lower the frequency, the longer is the wavelength.
The symbol used by engineers for wavelength is the Greek letter lambda (A). The relationship of wavelength and frequency is expressed mathematically as follows:
300,000,000 f where,
Á is the wavelength in meters, f is the frequency in hertz.
This formula states that to find the wavelength in meters, divide the velocity of propagation in meters per second by the frequency in hertz.
Since it is much easier to use kilohertz (kHz) and megahertz (MHz) for radio frequencies, the formula may be expressed in the following alternate forms 300,000 f (kHz) or, 300 f (MHz) Although the wavelength is always given in meters in technical discussions, it is useful to be able to convert meters to the more familiar English measurement in feet or inches. The following conversion factors may be used:
1 meter = 3.28 feet = 39.37 inches
For example, the wavelength at the approximate center of the AM broadcast band (1000 kHz) is calculated as follows:
300,000 300 meters 1000
Since 1 meter is equal to 3.28 feet:
( 300) ( 3.28) = 984 feet
For comparison, find the wavelength at the approximate center of the regular fm broadcast band (88 to 108 MHz) . This would be at approximately 100 MHz, so that:
300 100 = 3 meters, or 9.84 feet
As a further comparison, find the wavelength of a 950-MHz STL signal.
This is found to be 0.316 meter, or approximately 1.03 feet. Wavelengths at microwave frequencies are measured in centimeters and inches (1 centimeter equals 0.01 meter, or 0.3937 inch) .
9-3. REVIEW OF ELEMENTARY WAVE PROPAGATION
The transmitting antenna may be considered to be a device used for coupling radio-frequency energy to space. Fig. 9-2 illustrates a vertical radiator fed at the base, as is standard for AM broadcasting. The ground sets up a "mirror," or "image," antenna (as shown) as if there exists an actual antenna of the same length as the one above the ground. Fig. 9-2A shows the action at an instant when the first positive alternation is applied, making the upper wire terminate in a positive pole and the lower ( ground) terminate in a negative pole (surplus of electrons) . Since each electron has minute lines of force associated with it (as does any charged particle) , an electric field of force exists between upper and lower sections of the antenna. The similarity to a capacitor, which is simply two conductors separated by a nonconductor, can be seen. The two sides of the antenna itself are the conductors, and the air is the dielectric (nonconductor) between the conductors.
In Fig. 9-2B, the first polarity reversal (second alternation of the first cycle) is taking place. The top of the antenna is now charged negatively, and the image is charged positively. The lines of force produced during this half-cycle are in the opposite direction from those produced in the preceding half-cycle. When the current again reverses, the lines of force also re verse (Fig. 9-2C) . The lines of force are propagated outward from the antenna at the speed of light. This moving energy field is termed the electric field.
In addition to the electric field, the antenna also radiates a magnetic field, which is at right angles to the electric field. Thus the radiation field includes two components of force. The electromagnetic field, by definition, includes both the electric and magnetic fields at right angles to each other.
To complete the basic picture, the receiving antenna is a conductor, fixed in space (or within the receiver cabinet itself), across which the electro magnetic lines of force pass in their travel from the transmitting antenna.
A corresponding emf is set up in the conductor (in this case, the receiver antenna-ground system) ; thus, the receiver is able to reproduce signals from the electromagnetic field that passes the receiving antenna.
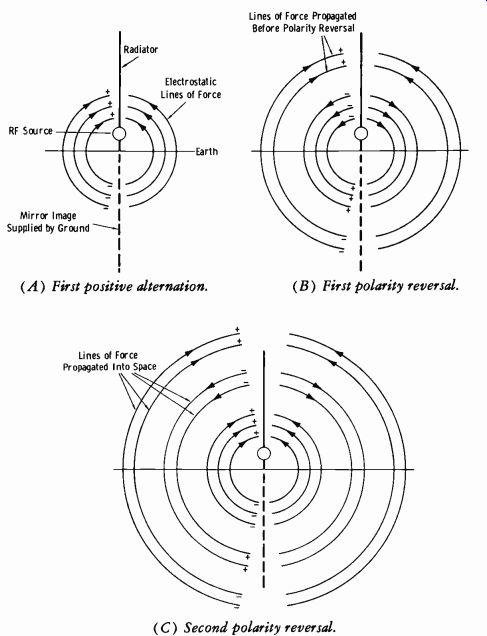
Fig. 9-2. Wave propagation.
---- (A) First positive alternation. Lines of Force Propagated Into Space (B) First polarity reversal. (C) Second polarity reversal.
The radiation field, which is the actual radio wave, should not be con fused with the induction field, which exists very near the transmitting antenna. The behavior of the field is different in this region, and the electric and magnetic components are out of phase in time as well as in direction.
In general, it may be stated that a vertical radiator propagates vertically polarized waves and a horizontal radiator propagates horizontally polarized waves. Since the radiated wave is composed of two components at right angles to each other, it is desirable to examine what is meant by a "direction of polarization."
Magnetic Field
Electric Field (A) Pictorial representation. (B) Vector representation.
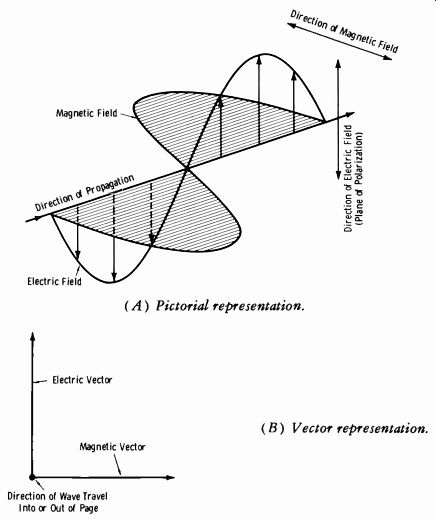
Fig. 9-3. Components of an electromagnetic wave.
Fig. 9-3, which illustrates one cycle of the radiation at a distance from a vertical antenna, should help visualize the two components of the electro magnetic wave. One cycle (one wavelength) of the electric component is shown by the arrows in Fig. 9-3A. The shaded waveform indicates the magnetic field at right angles to the moving electric field. The term "at a distance" from the radiating antenna means that the induction field in no way influences the two components. Note that the electric and magnetic cycles pass through the zero reference axis at the same point in space, although at right angles in relative directions of change. Fig. 9-3B shows the instantaneous electric and magnetic vectors, assuming the direction of travel to be into or out of the page. It should be obvious that during the following alternation, the electric vector would extend downward and the magnetic vector to the left. The direction of the electric field is taken as the direction of polarization. The direction of polarization for various broadcast services is specified by the Federal Communications Commission. Standard AM broadcast stations must radiate vertically polarized waves, and fm and tv broadcast stations must radiate horizontally polarized waves. (Vertically polarized waves may be radiated by an fm station in addition to the required horizontally polarized waves.) The chief reasons for selection of vertical polarization for standard AM broadcast service are as follows: (1) The primary purpose of the broad cast station is to provide the maximum possible ground-wave signal (signal unaffected by sky waves) to override the noise level at the receiver location. The vertical antenna has superior ground-wave characteristics in comparison to a horizontal antenna. (2) Due to the length of the wave between 540 and 1600 kHz, the vertical antenna is best from the standpoint of design and adjustment simplicity. (3) When directional arrays must be used (very common in practice) , vertical arrays are much more practical than horizontal arrays at these frequencies.
At the high frequencies utilized by fm and tv, the shorter wavelengths and line-of-sight propagation factors result in a situation opposite to that existing at AM frequencies. Consequently, horizontal polarization is used at these frequencies.
Little difficulty is experienced in reception on the standard AM broad cast band regardless of the type or orientation of the receiving antenna.
This is true because of the strong ground-wave signal and the fact that such vertically polarized waves do not retain an exact vertical polarization.
In field-intensity surveys, however, polarization may become important. At other frequencies, such as those assigned to fm and tv, the effects of polarization are highly important.
The next characteristic to be considered regarding the radiation field is the shape, or configuration, in space from the transmitting antenna. This shape is determined by the wave angle and has two components. Fig. 9-4 shows the azimuth (horizontal) angle (0) , which is measured in degrees clockwise from north, and the elevation (vertical) angle (0), which is measured in degrees upward from the horizontal axis. This figure also shows that a vertical radiator gives a strong nondirectional ground-wave signal, while the vertical radiation is minimized. Radiation in the vertical direction is useless to the primary area to be served by a standard AM broadcast station.
Note that the signal strength (in volts per meter) at some point represented by elevation angle 9 is equal to the maximum value (represented by E) times the cosine of angle O. Assume E to be 100 millivolts per meter at the indicated point of the horizontal axis. The value of e at any angle from this axis is obtained by multiplying 100 by the cosine of the angle involved. Assume it is desired to obtain the value of e at an elevation angle of 30°. From a table of trigonometric functions, the cosine value is found to be 0.866. Therefore:
E cos 30° = 100 ( 0.866) = 86.6 millivolts per meter
It should be observed that the cosine of 90° is zero, and the value of e in the vertical direction is zero. At standard broadcast frequencies, the angle of elevation is of no consequence when considering the primary service area, but it does influence effective field strength at a distance.
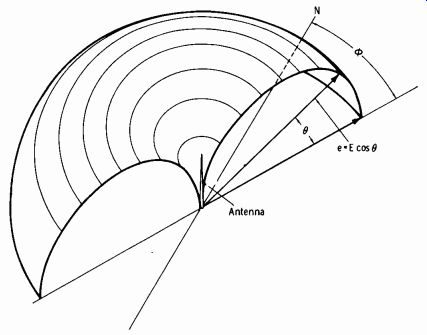
Fig. 9-4. Cross-section of radiation from a vertical antenna.
9-4. REVIEW OF PROPAGATION UNITS OF MEASUREMENT
Field strength is measured in millivolts per meter or microvolts per meter. The measurement is taken in the plane of maximum electric-field polarization. This measurement is in terms of carrier-wave stress, which is equivalent to the voltage induced in a 1-meter-long conductor as the wave cuts across the conductor at the velocity of light.
Since the carrier wave has two components, electric and magnetic, the two most important properties of the transmission medium are the dielectric constant and the magnetic conductivity. Since the main transmission medium for standard broadcast frequencies is the ground, these two properties of the soil, rocks, sand, or water over which the wave is carried must be considered.

Table 9-2. Inductivity and Conductivity for Various Types of Terrain
------ This figure is stated for comparison purposes-n order to indicate at a glance which values of conductivity and inductivity represent the higher absorption. This figure is the ratio between field intensity obtained with the soil constants given and with no absorption.
The dielectric constant is a value given to the dielectric, taking the value for air as unity, or 1. Basic theory states that if two large metal plates separated by air are connected across a battery, the plates are given a charge that depends on the battery voltage and the area of the plates. If a sheet of mica, for example, is inserted between the plates, the "capacitor" will immediately acquire a much greater charge. This is because mica has a dielectric constant, or storage capability, much greater than air. Thus, if the dielectric constant of the ground is relatively high, giving it a high inductivity, the efficiency of transfer of the electric component of the wave will be correspondingly high. If the conductivity is also high, the ground forms an efficient medium for electromagnetic wave propagation.
As stated previously, the dielectric constant is simply a numerical value given to a substance to denote its storage capabilities relative to air (unity). The conductivity is measured in electromagnetic units, abbreviated emu. Table 9-2 indicates the values of inductivity and conductivity used for various types of terrain in the absence of specific surveys. They should therefore be taken as approximate for any particular and limited area. It should be noted that ground with a high inductivity invariably has high conductivity also. Sea water is notably the most efficient carrier of radio waves. The best locations inland are low areas of marshy, or "crawfishy," soil which is damp the maximum percentage of time. For standard AM broadcast frequencies high locations are not at all important, unless the conductivity happens to be better in that area than in surrounding areas.
It is entirely possible at these frequencies for a transmitter in a low area to have greater coverage than one located on a mountain top.
It is apparent from the preceding that the dielectric constant and permeability of free space (or air) will be less than that of the ground. It might be deduced from this statement that the attenuation in air would be much greater than attenuation along the ground. In one sense this is true, but not in the way that might be most expected by the casual reader.
It is necessary to bear in mind that "free space" is entirely theoretical and is used to establish a basis for comparison. The definition of free space implies that all energy radiated into such a medium is done so freely with no reflections such as occur in practice from the ground and the ionosphere. From this it is possible to deduce that free space may be given a theoretical characteristic resistance which is of such value that no energy is reflected and consequently none ever returns. The value of this characteristic resistance of free space has been determined to be about 377 ohms, and through such a medium the waves are propagated at the speed of light, or 3 X 10^8 meters/second.
If one watt of power is radiated from a point in free space, one watt of power still exists at a distance of, say, 100 miles from the radiator. How ever, this one watt of power has now expanded into a sphere extremely large in comparison to the point from which it was propagated, and the watts per square meter is considerably less. That is, a receiving antenna covers only a small area of space, and when a watt-sphere spreads its area considerably, much less power per unit area exists. The area of the sphere of a wave varies as the square of the distance. If the distance is doubled, the total area increases 4 times, etc. Therefore the strength of the wave in units per square meter varies inversely as the square of the distance. If the distance is doubled, the strength in units per square meter decreases by a factor of 4. Thus at 100 miles from the antenna in free space (and remember the existence of free space is theoretical) , the signal strength per unit area will be only 1/1002, or 1/10,000, as strong as at one mile.
This characteristic of free-space transmission may now be compared with the ground-wave signal that is being carried by a medium having a much higher dielectric constant than air. The characteristic resistance (R0) of any material in relation to free space may be taken as:
R = 377 MY Ex
where, R. is the characteristic resistance in ohms, M. is the relative permeability with respect to air,
EX is the relative dielectric constant with respect to air.
For all practical purposes, it may be considered that the permeability (Ma) will be the same as for free space, whereas the dielectric constant will be high, such as 10. From this it can be seen that other mediums, such as the ground, will have less characteristic resistance than the 377 ohms of free space. For a dielectric constant of 10, the value of Ro would be 377 times the square root of 1/10, or about 116 ohms. With this change in R<,, the velocity of propagation in free space is changed according to the relation ship:
c M where, c is the velocity of propagation in meters per second, R. is the characteristic resistance in ohms, M is the permeability in henrys per meter.
This relationship for free space becomes:
377 377 377 8 c 4 pi x10^-7 12.56x10^-7 12.56x10^7=3x10
The answer is approximate because the numbers used in the computation were rounded off to a convenient number of significant figures. The error is negligible in practice.
Another example illustrates what happens when a wave enters a medium, such as the ground, with a lower R0:
116 c 1256 X 10^7= 9.28 X 10^7 or 0.928 X 10^8
As the wave is slowed down, the spherical surface becomes less in a given time, and the strength per unit is therefore greater than in free space or air.
9-5 PRIMARY AND SECONDARY COVERAGE AREAS ( AM)
In its allocation of frequencies, the FCC specifies a signal-intensity con tour of the station coverage area to be protected from objectionable interference. This varies with the class of station (clear, regional, or local, and their existing sub-classifications). No attempt is made here to list such protected contours and station classifications. The chief engineer, in particular, should subscribe to current FCC Rules and Regulations to keep abreast of all changes that occur. The cost of such a subscription is normally borne by the station as part of the overhead expenses.
The term primary service area (Fig. 9-5) designates the area in which the ground wave is not subject to objectionable interference or objection able fading. The term secondary service area designates the area served by the sky wave and not subject to objectionable interference (Fig. 9-5). The signal in this area is subject to intermittent variations in intensity. The sky wave (at standard AM frequencies) is almost completely absorbed in the daytime; thus, a secondary service area of any appreciable extent appears only at night. Fig. 9-6 shows how the attenuation of the sky wave varies during the sunset period. The term intermittent service area designates the area that receives service from the ground wave but which is beyond the primary service area and subject to some interference and fading.
(Ground Wave Subject to Interference and Fading)
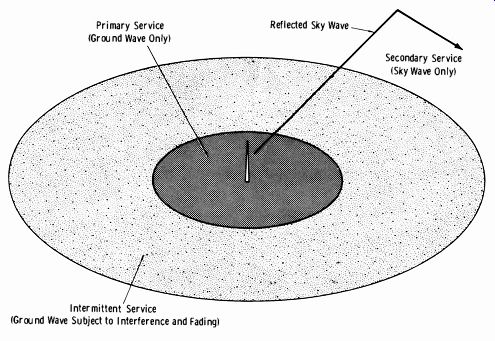
Fig. 9-5. Service areas
of an AM broadcast station.
9-6. GROUND-WAVE FIELD-INTENSITY CHARTS (540-1640 kHz)
The primary service area of a transmitter having a given frequency and power depends on the conductivity of the earth and the directivity of the antenna system. The graph in Fig. 9-7 illustrates the effect of soil conductivity on signal attenuation. This type of graph is published by the FCC for blocks of frequencies; some 20 graphs are required to cover the broad cast-band assignments. They show the ground-wave field-intensity curve plotted against distance for various conductivity values.
The reference assumes an antenna power and efficiency such that the inverse-distance field is 100 mV/m at 1 mile. Note the upper group of curves, which apply to the top row of miles from the antenna. The topmost curve intersects the 100 mV/m line at 1 mile. This line is transposed to the top of the lower set of curves, where 10 mV/m occurs at 10 miles from the antenna.
The inverse-distance field (100 mV/m divided by the distance in miles) corresponds to the ground-wave field intensity expected from an antenna with the same radiation efficiency and located over a perfectly conducting earth. To determine the value of the ground-wave field intensity corresponding to a value of inverse-distance field other than 100 mV/m at 1 mile, simply multiply the field intensity as given on these charts by the desired value of inverse-distance field at 1 mile divided by 100; for ex ample, to determine the ground-wave field intensity for a station with an inverse-distance field of 1700 mV /m at 1 mile, simply multiply the values given on the charts by 17. The value of the inverse-distance field to be used for a particular antenna depends on the power input to the antenna, the nature of the ground in the neighborhood of the antenna, and the geometry of the antenna.
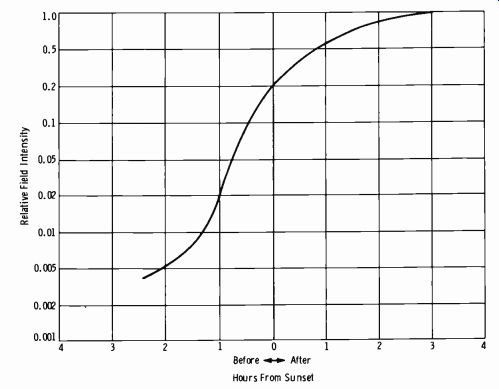
Fig. 9-6. Sky-wave field intensity.
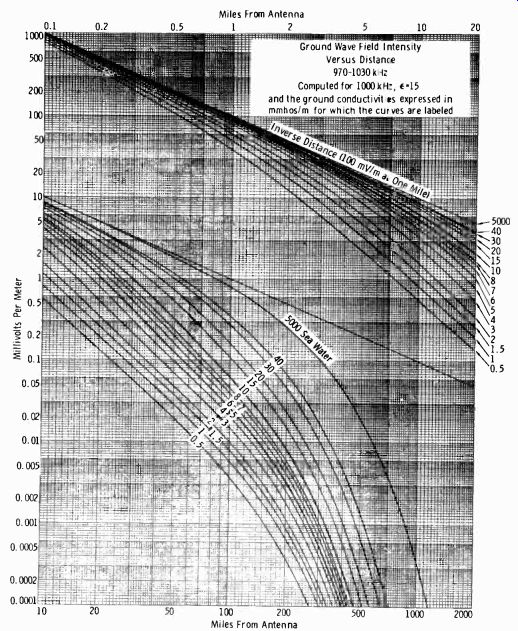
Fig. 9-7. Ground-wave field-intensity chart.
Assume that it is desired to find if there exists objectionable interferences between a 5-kW class-III station on 990 kHz and a 1-kW class-III station on 1000 kHz. The stations are 130 miles apart, and both stations use nondirectional antennas having such height as to produce an effective field for 1 kW of 175 mV/m at 1 mile. The conductivity at each station and of the intervening terrain is 6 mmhos/m. The protection to class-III stations during daytime is to the 500-12V/m contour. The distance to the 500-µV/m ground-wave contour of the 1-kW station is determined by the use of the appropriate curve (Fig. 9-7) . Since the curve is plotted for 100 mV/m at 1 mile, to find the distance to the 500 µV/m contour of the 1-kW station it is necessary to determine the distance for 285 µV/m on the graph, because (100) (500) /175 = 285. The estimated radius of the service area for the desired station is found from the appropriate curve to be 39.5 miles (using the curve designated as "6," for 6 mmhos/m). By subtracting this distance from the distance between the two stations, the interfering signal is found to travel 90.5 miles. From the curve it is found that the signal from the 5-kW station would be 158 µV/m at this distance.
Since a one-to-one signal ratio applies for stations separated by 10 kHz, the undesired signal at that point can have a value up to 500 µV/m with out causing objectionable interference. If the undesired signal had been found to be greater than 500 µV/m, then objectionable interference would exist.. For other channel separations, the appropriate ratio of the desired signal to the undesired signal should be used.
When a signal traverses a path over which different conductivities exist, the distance to a particular ground-wave field-intensity contour is deter mined by the use of the equivalent-distance method. When the unattenuated field of the antenna, the various ground conductivities, and the locations of discontinuities are known, reasonably accurate results may be expected in determining field intensities at a distance from the antenna by an application of this method. The method assumes a wave to be propagated across a given conductivity according to the curve for a homogeneous earth of that conductivity. When the wave crosses from a region of one conductivity into a region of a second conductivity, the equivalent distance of the receiving point from the transmitter changes abruptly, but the field intensity does not. From a point just inside the second region, the transmitter appears to be at that distance where, on the curve for a homogeneous earth of the second conductivity, the field intensity equals the value that occurred just across the boundary in the first region. Thus the equivalent distance from the receiving point to the transmitter may be either greater or less than the actual distance. An imaginary transmitter is considered to exist at that equivalent distance. This technique is not intended to be used as a means of evaluating an unattenuated field or the ground conductivity by the analysis of measured data.
An example using the equivalent-distance method follows. It is desired to determine the distance to the 0.5-mV/m and 0.025-mV/m contours of a station on a frequency of 1000 kHz. The inverse-distance field is 100 mV/m at one mile, and the path has a conductivity of 10 mmhos/m for a distance of 15 miles, 5 mmhos/m for the next 20 miles, and 15 mmhos/m thereafter. By the use of the appropriate curves (Fig. 9-7) , one can observe that at a distance of 15 miles on the curve for 10 mmhos/m the field is 3.45 mV/m. The equivalent distance to this field intensity for a conductivity of 5 mmhos/m is 11 miles. Continuing along on the propagation curve for the second conductivity, the 0.5 mV/m contour is encountered at a distance of 27.9 miles from the imaginary transmitter. Since the imaginary transmitter was 4 miles nearer (15- 11 miles) to the 0.5-mV/m contour, the distance from the contour to the actual transmitter is 31.9 miles (27.9 + 4 miles) . The distance to the 0.025 mV/m contour is determined by continuing on the propagation curve for the second conductivity to a distance of 31 miles (11 + 20 miles), at which point the field is read to be 0.39 mV/m. At this point the conductivity changes to 15 mmhos/m, and from the curve relating to that conductivity, the equivalent distance is determined to be 58 miles - 27 miles more distant than if a conductivity of 5 mmhos/m had prevailed. By using the curve representing the conductivity of 15 mmhos/m, the 0.025 mV/m contour is deter mined to be at an equivalent distance of 172 miles. Since the imaginary transmitter was considered to be 4 miles closer at the first boundary and 27 miles farther at the second boundary, the net effect is to consider the imaginary transmitter 23 miles (27-4 miles) more distant than the actual transmitter; thus the actual distance to the 0.025-mV/m contour is determined to be 149 miles (172 - 23 miles).
Considerable detail has been presented on the use of the FCC propagation curves even though the percentage of readers involved in the location of transmitter sites is relatively small. However, the understanding of such data is very important in maintaining broadcast antenna systems (particularly directional systems) . The proper techniques in field-intensity measurements for directional systems are assuming an ever-increasing importance to the FCC and therefore to your responsibilities in maintenance.
Notice that the preceding discussion involves the determination of the interference between ground waves only. When sky-wave interference is present, more complex computations are necessary.
NOTE: An amendment of Part 73 of the FCC Rules and Regulations modifies the calculation of radiation patterns for new directional-antenna installations. Essentially, the theoretical pattern is modified by adding a quadrature component and then multiplying the result by 1.05. The quadrature component is the larger of (1) 0.025 of the root-sum-square (rss) value of the inverse fields of the elements in the array, or (2) a value of 6 times the square root of the power in kilowatts. (Both of these values are modified by the vertical field distribution factor for the shortest tower in the array.) For details, refer to a current copy of Part 73 of the FCC Rules and Regulations.
To find rss: (1) Take the square of the individual signals from each tower; (2) add the individual squares (sum of step 1) ; (3) take the square root of the total in step 2.
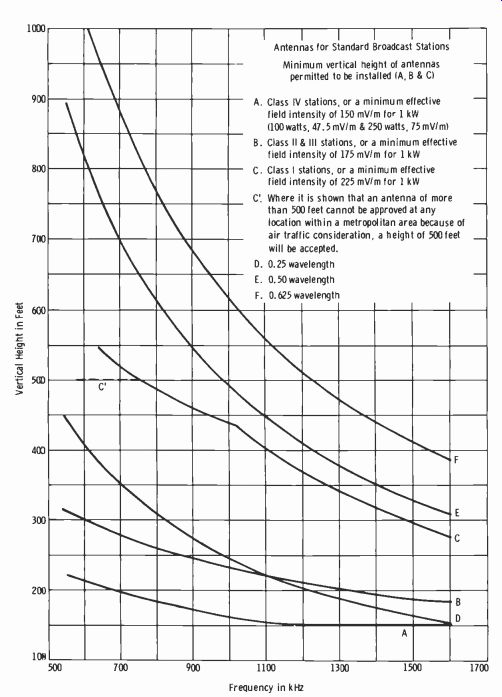
Fig. 9-8. FCC antenna requirements for AM stations.
9-7. BROADCAST ANTENNAS (STANDARD AM SERVICE)
The efficiency of service depends principally on five factors: the frequency of operation, operating power, ground conductivity, orientation of the transmitter with respect to the distribution of population, and design of the radiation system.
When an application is made to the FCC for new, additional, or modified broadcast facilities (such as changing transmitter location) , the applicant must specify the nature of the radiating system to be employed.
This system must comply with efficiency standards adopted by the FCC to meet the requirements of good engineering practice for the particular class of service concerned.
Fig. 9-8 shows the FCC standards which specify a minimum effective field intensity for particular classes of stations. (Caution: Always check current FCC Rules and Regulations, since modifications may be made at any time.) An observation of Fig. 9-8 shows these requirements:
Curve A. Class IV stations, a minimum height of 150 feet (for frequencies 1200 kHz and higher) , or a minimum effective field intensity of 150 mV/m for 1 kW (47.5 mV/m for 100 watts and 75 mV/m for 250 watts).
Curve B. Class II and III stations, minimum effective field intensity of 175 mV/m for 1 kW.
Curve C. Class I stations, minimum effective field intensity of 225 mV/m for 1 kW.
Curvet D, E, and F: The physical heights of the antenna for 0.25, 0.5, and 0.625 wavelength for any frequency from 550 to 1600 kHz.
Some interesting points are involved in the design of radiating systems for broadcast frequencies. Fig. 9-9 illustrates the comparative vertical radiation patterns for antennas of 0.25, 0.311, 0.5, and 0.625 wavelength.
Observation of this figure reveals that although an antenna of 0.625 wave length has a large low-angle lobe, a secondary lobe exists at a higher angle and decreases the effective fade-free area. Fading occurs when the sky wave reflected from the ionosphere meets the ground wave and tends to cancel out the signal due to phase reversal.
It has been found in practice, for example, that the strength of the ground wave at a given distance is increased only a few decibels by increasing the height of the antenna from 0.125 to 0.5 wavelength, but the effective fade-free area is greatly increased due to the reduction in strength of the high-angle radiation that produces a sky wave that returns to ground close to the transmitting location. Increased intensity in the horizontal plane is the main purpose of using antennas higher than a quarter wave length. It has been found that an antenna height of 190°, or 0.53 wave length, is the most efficient to use where the cost of such an installation is warranted by the conditions involved.
An adequate ground system must be employed with the broadcast antenna in order to obtain maximum efficiency. The FCC specifies that where the vertical radiator is used with the base on the ground, a ground system must be employed consisting of buried radial wires at least one-quarter wavelength long. They require at least 90 such radials, and recommend 120 radials of 0.35 to 0.4 wavelength spaced every 3°. In case of high base voltage (as in antennas approaching 0.5 wavelength) , a base screen of adequate dimensions should be employed to prevent high dielectric losses.
Vertical Radiation Patterns for Different Heights of Vertical Wire Antennas (Sinusoidal Current Distribution)
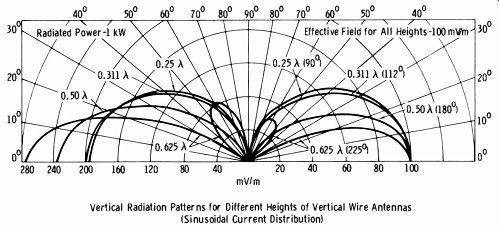
Fig. 9-9. Vertical radiation patterns for various antenna heights.
Note on Fig. 9-9 that the curves to the right on the polar graph are plotted on the basis of a 100-mV/m effective field for all antenna heights.
The curves to the left are plotted for a specified radiated power of 1 kW.
This gives the comparative effective field in millivolts per meter at one mile. For example, a 0.5-wavelength antenna with a radiated power of 1 kW produces a field intensity of 237.5 mV/m at one mile.
This information is duplicated by curve A of Fig. 9-10. Observe that the increase in field strength when going from a quarter-wave antenna (190 mV/m) to a half-wave antenna (237 mV/m) is a voltage ratio of 1.25 to 1. This is an increase of approximately 2 dB. However, as mentioned before, the effective fade-free area is significantly increased with the half-wave antenna due to the reduction of high-angle radiation.
Curve B of Fig. 9-10 indicates a complete wavelength (in feet) at any frequency between 500 and 1600 kHz. For example, a wavelength at 1400 kHz is 700 feet; at 700 kHz it is 1400 feet. Thus a half wavelength at 1400 kHz is 350 feet, and at 700 kHz it is 700 feet.
NOTE: When guyed towers are used, the guy wires are broken with insulators spaced a fraction of a wavelength at the operating frequency to avoid radiation interference to the tower.
9-8. DIRECTIONAL ANTENNA ARRAYS
Directional arrays must be used in a great majority of present-day broad cast installations. In most instances, they must be used to protect the service areas of other stations on the same or adjacent channels. Such a system also can be used to cause the carrier wave to be reinforced in the direction of the densely populated area intended to be served. Still another application is the elimination of multiple-ownership problems by using directional antenna patterns to prevent overlap of the coverage from transmitters owned by a common licensee.
The design of directional antenna systems is a specialized field requiring considerable training, the use of complex mathematics, and experience.
Just as in the case of transmitter-site preliminary tests, this work is under taken by licensed consulting engineers who specialize in such work. The discussion here is to eliminate the usual elements of mystery surrounding directional systems for the average operator and technician.
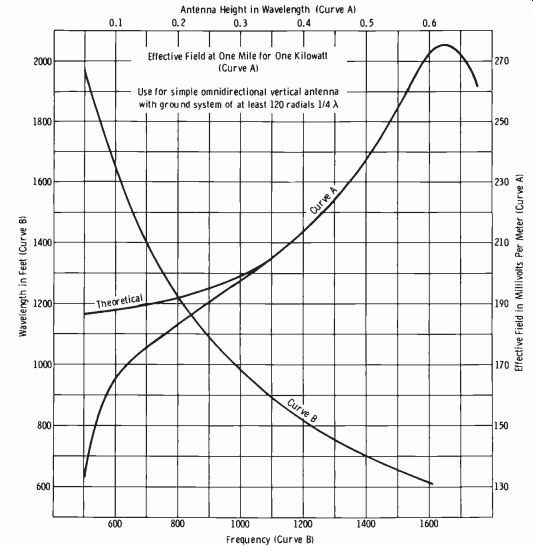
Fig. 9-10. Chart of wavelengths and effective field intensity.
Conditions Governing Number of Towers
Directional arrays commonly have from two to six towers, although as many as 12 have been used. The radiation pattern must have a shape which results in adequate coverage of intended service areas from the necessary location of the transmitter, and at the same time provide the required protection to other stations. Economics obviously dictate a need to accomplish the results with a minimum of towers and associated phasing equipment.
Under the more severe requirements, the number of towers must be in-creased until sufficient control of the radiated energy is achieved to result in the critical shape.
A broadly flexible rule, but one that is fundamental and serves as a starting point, states that two stations may be given the required protection with two towers. Three stations may be adequately protected with three towers, or in some cases of less severe requirements, only two towers will serve. Similarly, four towers will provide control of four nulls for four stations. Again, however, the required results often can be accomplished with three towers. Additional requirements entering into the overall problem, such as the need to concentrate energy into one or two directions to provide adequate service in addition to protecting stations in other directions, may complicate the control problem and call for additional towers
Radiation Pattern Control
The simplest directional array consists of two half-wave towers spaced a half-wavelength apart with no associated phasing equipment. This combi nation serves as a good starting point to illustrate the fundamentals of directional broadcast arrays.
In this example, the two towers are fed with currents of equal amplitude, in step (in phase) with each other. The currents in both towers reach their maximums and minimums at the same instant, assuming the transmission-line lengths are equal. Fig. 9-11 shows the resulting wave interactions which control the final radiation pattern.
In Fig. 9-11A, the towers are a half wavelength apart, and the wave from antenna A ( solid line) will have traveled a half wavelength by the time it reaches antenna B. The current in antenna B ( shown by dashed line) will then be 180° out of phase in this direction with that of antenna A, and the field will tend to cancel out. Conditions in the opposite direction in line with the towers will result in the same canceling effect, the wave of antenna A now being 180° behind that of antenna B.
Fig. 9-11B illustrates the wave reinforcement that occurs in the direction perpendicular to the line of the towers. The waves from the two towers, being in phase, add to one another, and the energy field is the total of the radiated energy from both. The same condition holds true in the opposite direction.
Fig. 9-11C shows the field interaction at an arbitrary point, P, at some direction between those of the previous examples. The radiated waves are now slightly, but not 180°, out of phase; therefore, the total energy at this point is the difference of the two energies. The resulting directional pattern in the horizontal plane is shown in Fig. 9-11D. When this two-element array is fed with currents 180° out of phase, the conditions are reversed.
In actual practice, there are many variables involved, such as differences in the amplitudes of the currents, phasing of the currents, spacing of the towers, etc., dictated by the requirements to be met and the convenience of controlling the current magnitudes and phases. The design mathematics are very involved and complex, and only the basic principles concern the average operating and maintenance engineer.
As a practical example, consider a typical two-tower directional array.
Nondirectional (one-tower) operation is specified for daytime, with a directional pattern (approximately a figure eight) necessary from local sunset to local sunrise. This dual operating function requires the relay switching system illustrated in Fig. 9-12A, which shows the relay in the position for directional operation. Fig. 9-12B shows the equivalent circuit for nondirectional operation, where the relay contacts disconnect the north tower, and only the south tower is excited. Fig. 9-12C shows the equivalent circuit when the relay is thrown to contacts B and D for directional operation.
(A) Towers one-half wavelength apart.
(B) Sum of radiation from towers shown in A.
(C) Field interaction between towers.
(D) Pattern in horizontal plane.
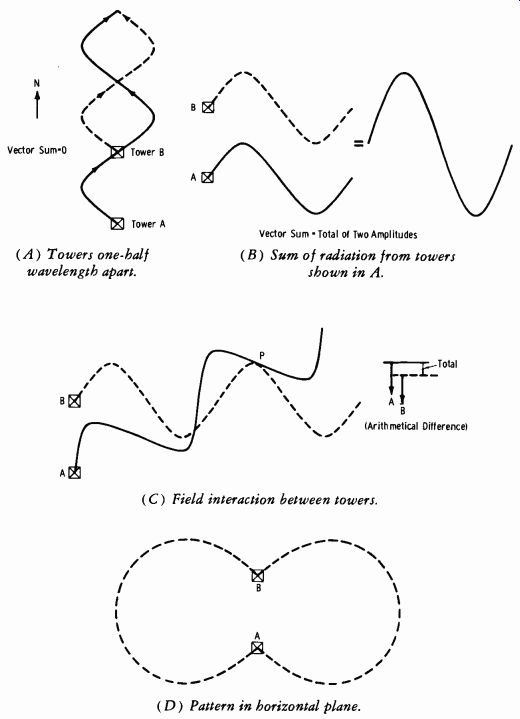
Fig. 9-11. Simple directional array.
(A) Switching system with relay in directional position.
(B) Equivalent circuit for nondirectional operation.
(C) Equivalent circuit for directional operation.
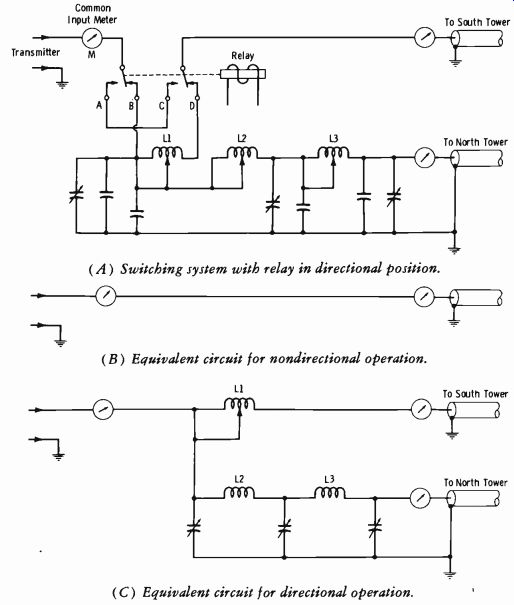
Fig. 9-12. Two-tower directional-array switching system.
This particular directional array is defined as follows: The spacing be tween the towers is 351 feet (183.9°) on a line bearing 165° true. The current in the south tower leads the current in the north tower by 160.6°.
The current ratio is: south tower 1, north tower 0.91.
A transmission line introduces a delay (in degrees) of: 8=360°1 where, 1 is the length of the line, is the wavelength.
The phasing unit must divide the transmitter currents into two parts with the required amplitudes (power ratio) and phase angles, taking into consideration the delay occurring in the transmission lines.
In order to illustrate the function of a phasing unit, consider the tower array and transmission lines without the phasing control. The transmission line to the south tower is 144 feet, 5 inches long, or 74.1 electrical degrees.
The line to the north tower is 306 feet, or 160.2 electrical degrees. The operating frequency of the station is 1430 kHz. Hence 360°, or one wave length is: 300,000 209 meters 1430 or 685.5 feet, approximately.
Therefore the current in the south tower is delayed by 74.1° from the transmitter, and the current in the north tower is delayed by 160.2°. Under these conditions, the current in the south tower would lead that in the north tower by 160.2- 74.1, or 86.1°.
Since the directional design factors to obtain the necessary pattern of radiation call for a current lead in the south tower of 160.6°, the phasing network must make up the difference by providing an additional delay in the north leg or a phase advance in the south leg of the circuit. The choice is usually a matter of convenience, and the configuration that is simplest to design and control for any specified circumstance is used. In the example, a phase-delay circuit was chosen for the north tower to delay the current by an additional 74.5° so that the total current lead in the south tower is 160.6°.
Variable capacitors are shunted across each fixed capacitor (Fig. 9-12A) for purposes of maintaining control after the array has been adjusted initially. These capacitors are always locked on the panel to avoid slight changes that might otherwise inadvertently occur as a result of brushing against the controls or in cleaning and maintenance routines. The FCC requires periodic checks on the directional radiation pattern. Any deviation caused by changing parameters over a period of time may be corrected by adjusting the variable capacitors and tapped coils.
It is necessary to maintain the correct phase and magnitude relationships between the currents in the different branches of directional-antenna systems. The phase monitor is an instrument designed for the remote indication of the relative amplitudes and phases of the antenna currents in the various elements of directive arrays.
9-9. ANTENNA TUNING UNITS
The circuit of a single-antenna tuning unit often consists of a single T-section, low-pass filter (Fig. 9-13) . The two series inductors allow independent adjustment of their respective terminating impedances; L1 is for the transmission line and L2 is for the antenna circuit. The capacitive shunt leg, common to both branches, is given a fixed value determined by the operating frequency.
This T-section network has two primary functions, to match impedances and to tune the antenna to the exact frequency of the station. For tuning the antenna, coil L2 is adjusted to series resonate with the capacitive reactance of the antenna, or, if the reactive component is inductive, it is to be considered absorbed into the inductance of L2. Coil L1 is then used to match the resistance of the transmission line to the resistance component left in the antenna circuit.
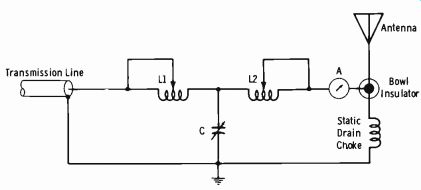
Fig. 9-13. Single-antenna tuning unit.
Table 9-3 presents the average resistance and reactance values for both self-supporting and guyed towers of various heights. These are not absolute values, which must be determined accurately by an rf bridge or other means, as described in Section 14.
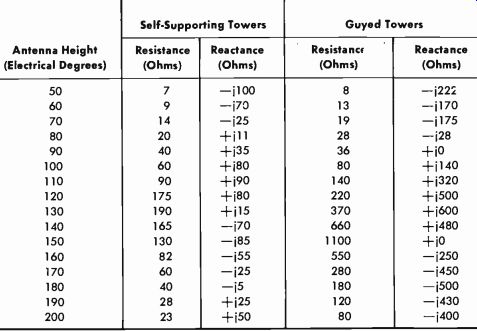
Table 9-3. Antenna Resistance and Reactance Values
This type of circuit forms a low-pass filter network with excellent harmonic attenuation. It should also be observed that the reactance values may cause a phase shift between zero and 180° (cutoff). In practice, a value of around 90° is chosen, in which case the following formulas hold true for each reactive element:
X1=+VR1R2 X2=+VR1R2 X3 =-
VR1R2 where, R1 is the line impedance, R2 is the antenna resistance, X1 is the reactance of L1, X2 is the reactance of L2i X3 is the reactance of C.
There are two accepted methods of tuning a broadcast antenna, the rf bridge method and the substitution method. Both methods are described in Section 14.
9-10. LIGHTNING PROTECTION
An AM tower insulated from ground is subject to severe static build-up and high potential storage relative to ground upon the approach and actual duration of a storm. It can be seen in Fig. 9-13 that a static drain choke is employed; it has very high impedance at the operating frequency but low resistance to ground for dc.
Fig. 9-14 illustrates conventional methods of lightning protection used at most AM stations, both within the tuning house (commonly termed the "dog house") and at the tower base. The antenna meters should be provided with heavy knife-blade switches which are kept closed ( meter shorted) except when readings are to be made. A 10- to 14-inch loop is usually provided just below the bowl insulator to provide a certain amount of inductive reactance to that path. The radio-frequency choke (rfc) will provide a sufficient amount of static drain under approaching storm conditions, or for normal static build-up from rain, snow, icing, etc. However, under severe electrical storm conditions, the impedance of the choke is usually too high for adequate protection. The series ammeters, when not shorted, usually burn out and open the antenna path.
The ball gap across the antenna base insulator should be spaced an amount just beyond the distance at which arcing occurs on 120-percent (positive-peak) modulation of the rf carrier. Thus, a lightning "hit" in the vicinity will cause an arc across this gap which, in turn, causes the final-
stage overload relay in the transmitter to trip, removing the carrier voltage so that the arc will not be sustained. Most transmitters employ automatic recycling such that the carrier is restored after about 1 second.
9-11. TOWER MARKING AND LIGHTING
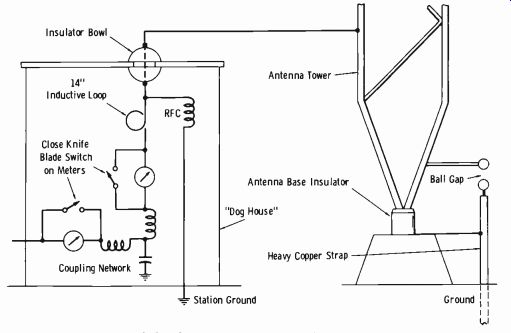
Fig. 9-14. Lightning protection for AM tower.
The precise tower painting and lighting requirements for each station are specified in the station authorization. The general rules for tower lighting and painting that apply to most stations are given in the following paragraphs. (Caution: Always check the latest FCC regulations.) Painting In general, towers are required to be painted with alternate bands of aircraft-surface orange and white, with the top and bottom bands being air-craft surface orange. There are to be 7 bands, except that the bands must be no narrower than 1 1/2 feet and no wider than 100 feet. All towers must be cleaned or repainted as often as necessary to maintain good visibility.
Lighting
The lighting requirement for a tower depends on the height of the tower (Table 9-4) . The obstruction lights on towers 300 feet high or less consist of at least two 100-, 107-, or 116-watt lamps (No. 100 A21 /TS, No. 107 A21 /TS, or No. 116 A2I /TS, respectively) enclosed in aviation-
red obstruction globes. On taller towers, at least one such lamp is required at each corner of the tower at each level.
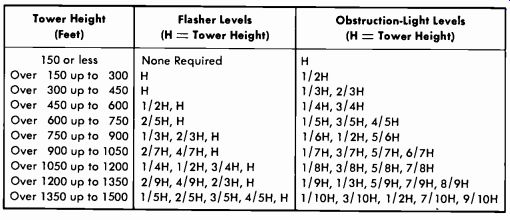
Table 9-4. Tower Lighting Requirements
Each flasher is a 300 mm electric code beacon equipped with two 500-, 620- or 700-watt lamps (PS-40, code beacon type) . On larger towers where an unobstructed view of the beacon at any level is not possible from all angles of approach, two such beacons must be installed at that level.
All lights at each level are required to burn simultaneously. On towers of 150 feet or less, the lights are required to burn from sunset to sunrise.
The lights may be controlled manually, by a timer, or by a light-sensitive device. On larger towers the lights must either burn continuously or be controlled by a light-sensitive device adjusted so that the lights will be turned on at a north-sky light-intensity level of about 35 footcandles and turned off at a north-sky light-intensity level of about 58 footcandles.
During the construction of a tower, two obstruction lights of the type previously described must be installed at the top of the tower and at each level where lighting is required. ( Alternately, the permanent lights may be installed at each level as the level is reached.) The temporary lights must be displayed from sunset to sunrise until the permanent lights have been placed in operation.
In special cases, a station may be required to mark its tower or towers in a manner different from that previously described. Many older installations were built when other requirements were in effect. In every case, the required type of marking is specified in the station authorization.
Fig. 9-15 shows a typical lighting plan for towers up to 150 feet high.
The double obstruction light uses 100-watt A21 /TS lamps. The wire-feeder size should be based on no more than a 5-percent voltage drop from the rated voltage of the lamp.
Maintenance Requirements At least once every 24 hours, an observation of the tower lights must be made. This may be done either visually or by means of an automatic and properly maintained indicator designed to register any defect of the lights.
As an alternative, an automatic alarm system may be used to indicate a failure in the tower-lighting system. Any observed failure of a top light or code or rotating beacon which is not corrected within 30 minutes must be reported by telephone or telegraph to the nearest Flight Service Station or office of the Federal Aviation Administration. Further notification by tele phone or telegraph must be given immediately on resumption of the required illumination.
(A) Physical layout. (B) Wiring diagram.
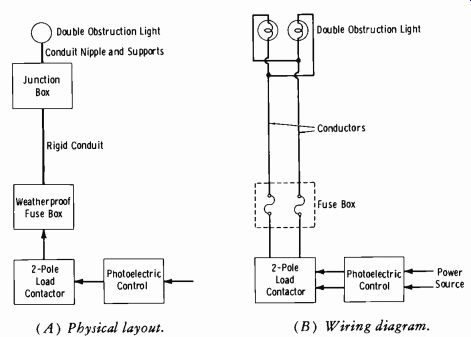
Fig. 9-15. Typical lighting system for a 150-foot tower.
At least once every three months, there must be an inspection of all automatic or mechanical control devices, indicators, and alarm systems associated with the tower lighting. This is to insure that the apparatus is functioning properly.
Entries must be made in the station record of the following:
1. The time the tower lights are turned on and off each day, if manually controlled.
2. The time the daily check of proper operation of the tower lights was made, if automatic alarm system is not provided.
3. In the event of any observed or otherwise known failure of a tower light:
A. Nature of such failure.
B. Date and time the failure was observed or otherwise noted.
C. Date, time, and nature of the adjustments, repairs, or replacements where made.
D. Identification of Flight Service Station (Federal Aviation Ad ministration) notified of the failure of any code or rotating beacon light or top light not corrected within 30 minutes, and the date and time such notice was given.
E. Date and time notice was given to the Flight Service Station (Federal Aviation Administration) that the required illumination was resumed.
4. On completion of the periodic inspection required at least once each three months:
A. The date of the inspection and the condition of all tower lights and associated tower-lighting control devices, indicators, and alarm systems.
B. Any adjustments, replacements, or repairs made to insure compliance with the lighting requirements and the date such adjustments, replacements, or repairs were made.
The FCC lists specifications for tower-lighting equipment and paint.
These specifications are given in Chart 9-1.
--------------------
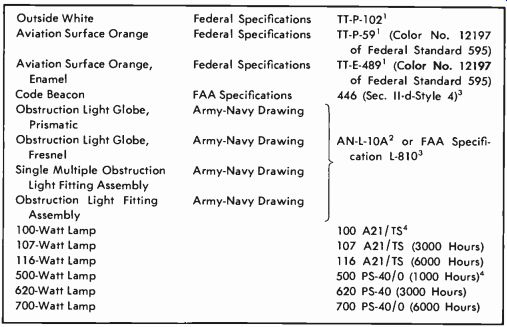
Chart 9-1. Specifications for Tower Paint and Lighting Equipment
Outside White Aviation Surface Orange Aviation Surface Orange, Enamel Code Beacon Obstruction Light Globe, Prismatic Obstruction Light Globe, Fresnel Single Multiple Obstruction Light Fitting Assembly Obstruction Light Fitting Assembly 100-Watt Lamp 107-Watt Lamp 116-Watt Lamp 500-Watt Lamp 620-Watt Lamp 700-Watt Lamp Federal Specifications Federal Specifications Federal Specifications FAA Specifications Army-Navy Drawing Army-Navy Drawing Army-Navy Drawing Army-Navy Drawing TT-P-102' TT-P-59' (Color No. 12197 of Federal Standard 595) TT-E-489' (Color No. 12197 of Federal Standard 595) 446 (Sec. II-d-Style 4)3 AN-L-10A2 or FAA Specification L-8103 100 A21/TS4 107 A21/TS (3000 Hours) 116 A21/TS (6000 Hours) 500 PS-40/0 (1000 Hours)° 620 PS-40 (3000 Hours) 700 PS-40/0 (6000 Hours)
Copies of this specification can be obtained from the Specification Activity, Room 1643 Federal Supply Service Center, General Services Administration, 7th and D Sts SW., Washington D.C. 20407.
2 Copies of Army-Navy specifications or drawings can be obtained by contacting the Commanding General, Air Materiel Command, Wright Field, Dayton, Ohio 45433, or the Naval Air Systems Command, Navy Department, Washington, D.C. 20360. Information concerning Army Navy specifications or drawings can also be obtained from the Federal Aviation Administration, Washington, D.C. 20553.
3 Copies of this specification can be obtained from the Federal Aviation Administration, Washington, D.C. 20553.
The 116-watt, 6000-hour lamp and the 700-watt, 6000-hour lamp may be used instead of the 100-watt and 500-watt lamps whenever possible in view of the extended life, lower maintenance cost, and greater safety which they provide.
------------------------
RF Chokes for Lighting Systems
Broadcast installations in which the tower itself forms the antenna and is insulated from ground (all AM towers except shunt-fed types) must employ a means of preventing the radiation energy from following the tower-lighting system into the ground, thus detuning the tower. This is accomplished by lighting filters consisting of inductors and capacitors.
The filter must present a high impedance to rf while presenting negligible impedance to the 60-Hz ac. Such a filter also serves to drain static charges on grounded ac lines. The coil must be able to carry the amperage of the lighting circuit. Fig. 9-16 illustrates typical lighting-filter circuits.
The choke coils should have an inductance of at least 350 microhenrys at 1000 kHz. The value of each capacitor is 0.01 µF.
Tower To Side Connection Lights
(A) Circuit for tower without flasher. (B) Circuit for tower with flasher.
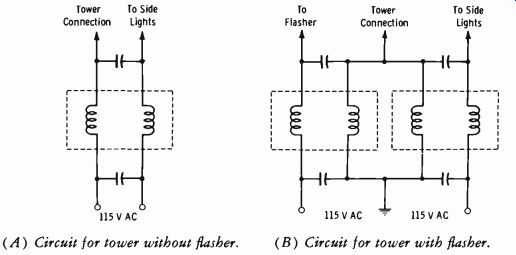
Fig. 9-16. Typical lighting-filter circuits.
A different method uses the Austin-type tower-lighting transformer, which is a transformer of ring-type windings using an air gap between the primary and secondary rings. These rings are oriented at 90° to each other, adding negligible capacitance at the tower insulating zone. This trans former requires no housing, chokes, or filters. The primary is usually attached to the base of the tower insulator or to the pier supporting the insulator. The secondary may be supported by a conduit attached to the top of the insulator or to the tower.
9-12. ANTENNA REMOTE-INDICATING METERS
An indicator of antenna current is normally used inside the transmitter building (Fig. 9-17) . This gives a relative indication of current in a single antenna, and one meter for each element in an array is used. In directional arrays, a means must be provided for insuring the correct relationships between elements, and hence, proper field patterns. When remote control of the transmitter from the studio is involved, additional circuitry is used inside the building. Two basic methods of sampling exist, tuned and non-resonant.
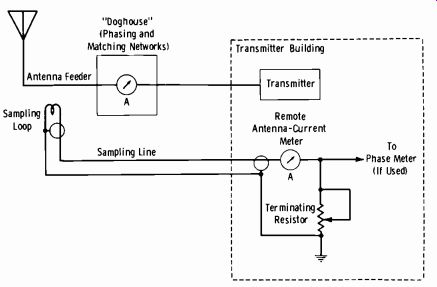
Fig. 9-17. Typical arrangement for remote indication of antenna current.
Use of Tuned Circuits
In many installations, the tuned sampling coil can be coupled at practically any point along the radiator or feed line and still pick up enough voltage to operate the current and phase indicators. The considerations involved in locating the coil are discussed later. The coil can be made small, and if a phase meter is not used, the pickup voltage can be conveniently varied over a limited range by slightly detuning the circuit, rather than by varying the degree of coupling, which presents a mechanical problem in some installations. The tuned coil has one disadvantage for use with a phase meter; unless the coil is kept precisely tuned to the transmitter frequency, errors in phase measurements due to the reactive component in the sampling unit will result.
Since the tuned circuit is more sensitive than a non-resonant loop, care must be exercised in deciding its location. Otherwise, misleading indications may be produced by pickup from adjacent towers or voltages induced by other inductors in the installation. Pickup will cause error in the phase indication, and it may also produce nonlinearity in current indication; therefore, current indications will be in error when a change of operating conditions occurs.
If the sampling equipment is to be located within a tuning house, a shielded compartment can be constructed of copper or copper-lined steel. For outdoor locations, the enclosure can be weatherproofed by the use of 53/8-inch ceramic bowl insulators for powers up to 5 kW and for radiators with operating impedances less than approximately 200 ohms at the sampling point. For higher power, larger insulators should be employed. For 50-kW installations where the radiator is sampled at a point of high impedance, the clearance of the sampling coil from the antenna bus should be increased an additional inch to prevent voltage breakdown.
For satisfactory results, care must be taken in the placement of the pickup coil. A position should be chosen that will eliminate magnetic coupling to all sources except the one which is to be measured. If more than one antenna element is to be monitored, all coils should be placed in the same relative physical location with respect to the antenna leads to which they are coupled; otherwise a 180° error may be introduced. Pickup may be reduced by slightly rotating the coil assembly in the horizontal plane. Ninety degrees of rotation reduces the induced voltage to essentially zero. In cases where the current in the antenna lead is too low to give sufficient output voltage from the coil, the spacing between the coil and the antenna lead may be decreased to increase the output, but in no case should the clearance be less than one inch, in order to minimize the danger from voltage surges. In extreme cases, the antenna lead can be formed into a single-turn loop parallel to the turns of the pickup coil, and the spacing reduced to approximately one inch.
Use of Non-resonant Loops
An un tuned pickup loop is easy to build and usually can be fabricated on the site. Since it requires no tuning, an initial adjustment usually proves satisfactory for longer periods of time than can be expected with a tuned pickup loop. Also, there is little danger of phase shift being introduced in the non-resonant pickup circuit. As previously stated, phase shift in the sampling circuit can cause erroneous indications to be given by the phase meter.
The nonresonant loop must be rigidly mounted, and in cases where it must be coupled to points of low current, the loop might necessarily be very large to provide sufficient pickup. Since the size of the loop limits its rigidity, it is desirable to couple it to points of relatively high current if possible, particularly in high-power installations where high rf voltages may be present.
The shielded nonresonant loop in Fig. 9-18 is made of a single-conductor cable and can be made rigid and rather large to provide adequate pickup.
The shielding must be cut back at the end and taped so that it does not short-circuit the single-turn loop formed by it and the inner conductor.
This part of the loop can be effectively weatherproofed for outdoor installation by using a 1/4-inch copper-tubing T section and insulating hose coupling, as shown in Fig. 9-18. This type of loop can be pressurized along with the transmission line, if air-dielectric lines are employed.
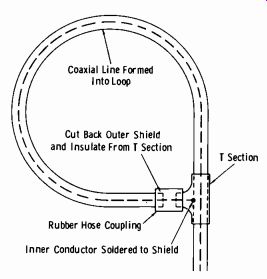
Fig. 9-18. A nonresonant pickup loop.
Location of Sampling Coils
The ideal location for the sampling coil varies with different installations and depends on such factors as the electrical design of the elements of the array and the feed lines, the construction of the towers or other sup ports, and the power used. In high-power installations, sufficient pickup is insured at many points along either the feed line or the antenna elements, but the problem of securing adequate high-voltage insulation between the sampling system and the antenna system requires consideration. In low-power installations, the desired type of sampling coil may not provide sufficient pickup unless it is coupled to a point near a current maximum, which in some installations might be near the center of the antenna elements, thus presenting a problem in mounting and subsequent adjustment of the coil.
In installations where the tower is fed at its base, sufficient current is usually present to induce ample voltage into the sampling system. A sampling unit which is installed at this point is easily weatherproofed and is accessible for frequent readjustment. However, a variety of stray currents usually are encountered at this point. In some installations, these stray base currents may be appreciable compared to the absolute antenna current of the system. For example, in a vertical half-wave antenna, the capacitance of the tower to ground across the base insulator may draw an rf currentcom parable in magnitude to that fed into the antenna (Fig. 9-19) . Moreover, the stray currents at the base of the tower do not always provide accurate antenna-current indications under a change in operating conditions. A decrease in base-feeder current might be indicated, for example, with an increase in absolute antenna current. Before a sampling installation at the base of a tower or mast is made, it is advisable to determine both the magnitude of the base currents and their relationship to the absolute antenna current under different operating conditions.
----------
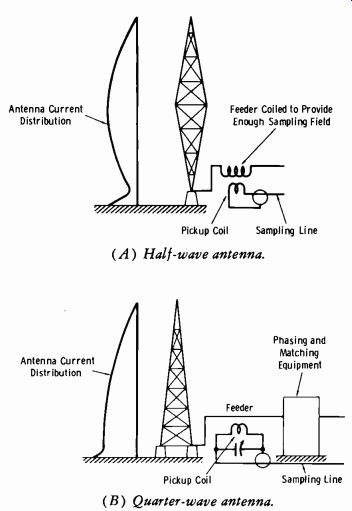
Fig. 9-19. Antenna current distributions.
Antenna Current Distribution Antenna Current Distribution Feeder Coiled to Provide Enough Sampling Field Pickup Coil Sampling Line (A) Half-wave antenna.
Phasing and Matching Equipment Pickup Coil Sampling Line (B) Quarter-wave antenna.
------------
A sampling system installed on the tower structure will indicate the effective value of the antenna current. It is often difficult to determine the absolute current in the tower; therefore, direct correlation between the remote meter reading and the true antenna current is difficult to achieve.
An installation on the tower structure is advantageous in that ample cur rent is usually available for sampling, and indications are not influenced by base currents if the loop is located several feet above the base. But such a system usually is costly and difficult to install. The sampling line, which can be clamped to the tower, must be brought across the tower base insulators. This requires the introduction of a high-impedance circuit at the base of the tower, which is obtained in practice by forming a sufficient length of the sampling line into a coil that can be tuned by a shunt capacitor to the transmitter frequency (Fig. 9-20A) . The tuned circuit must be kept accurately tuned to the transmitter frequency; otherwise the sampling system will disturb the electrical characteristics of the antenna and will pro duce inaccurate phase and current relationships. In some cases, the sampling line can be spaced from the tower by high-voltage insulators and brought across the base without an isolating network.
(A) Coil mounted on tower.
(B) Coil mounted on auxiliary mast.
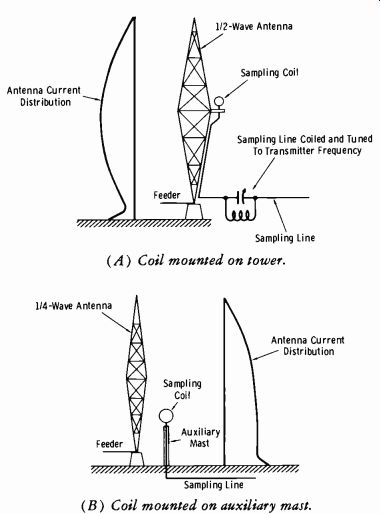
Fig. 9-20. Two methods of installing sampling coils.
To overcome the difficulty of bringing the sampling line across the base of the tower, the sampling coil can be mounted at the top of a special mast erected adjacent to the antenna tower (Fig. 9-20B) . If the height of the antenna tower is one-quarter wavelength at the frequency used, the sampling unit at the top of a short mast erected close to the tower will provide ample voltage for antenna current and phase indications. Moreover, these indications will not be influenced by stray currents existing at the base of the tower. The sampling line can be attached to the mast and its outer shield grounded at the base. Care must be exercised in the location of the mast so that stray fields from other adjacent towers do not induce appreciable current in the sampling system.
The principal disadvantages in this system are mechanical. The auxiliary mast must remain rigid under the most adverse weather conditions to pre- vent variation in the spacing between the pickup coil and the antenna tower. If the mast is laterally supported by the tower structure, the supports must be adequately insulated from the mast, which might prove too costly in some installations. In order to obtain the desired current in the sampling system, some provision must be made at the top of the mast for adjusting the position of the sampling coil and perhaps its distance from the antenna tower. In either case, where the sampling line is mounted near the antenna structure, the effect of the line on the electrical characteristics of the antenna system must be carefully considered.
Sampling Lines
The current induced in the sampling coil by the field surrounding the antenna or its feeder is fed by concentric transmission line to the remote antenna-current and phase indicators. In practice, the degree of coupling between the coil and antenna or feeder is usually adjusted so that the pointer deflection on the scale of the antenna-current indicator is identical to that of the corresponding antenna ammeter.
The sampling line can be any one of a number of types of concentric lines with surge impedances from approximately 50 to 100 ohms. In general, open-wire lines prove unsatisfactory; if they are used in the vicinity of the antenna, objectionable currents will be induced in the lines. Beaded coaxial line is an entirely satisfactory type for sampling. This type of line can be obtained with surge impedances ranging from 70 to 150 ohms. Its construction provides an efficient, low-loss transfer of energy and makes it suitable for long periods of outdoor use. An ideal sampling-line installation would consist of beaded coaxial line installed in gas-filled copper tubing.
Such a line could be depended on to give reliable service for long periods of time. Solid-dielectric coaxial lines which should give long trouble-free service have been developed. They do not require pressurizing. So that a phase shift is not introduced in the sampling system, particularly if a phase meter is used, each sampling line must be terminated in its characteristic impedance.
9-13. COAXIAL TRANSMISSION LINES (AM-FM)
The transmission line connects the transmitter output to the antenna or antenna tuning unit. Details of electrical design characteristics are well covered in existing literature and are not important to this text. The important features to be considered are mechanical construction as it is related to installation problems and the proper choice of line to meet the requirements for power-handling capacity, allowable power loss, proper impedance match, and economic factors. The differences in lines suitable for AM and fm service will be discussed.
The coaxial line uses inner and outer conductors made of rigid or semi-flexible copper tubing, with either air as the dielectric or a solid dielectric of polyethylene. Solid-dielectric cables, although they have the advantages of flexibility and comparative ease of installation, are less efficient in the transmission of rf energy and have less power-carrying capacity.
In the construction of a coaxial line, cross-pin insulators are used to sup port and space the inner conductor. Insulators of steatite are spaced throughout the length of the line at intervals depending on design. Close spacings help to make the line more uniform and are desirable for constant impedance characteristics. Longer spacings, however, minimize insulator loss and give a higher relative efficiency. In practice, the insulator loss is minimized by using insulators as small as possible for the required mechanical strength. At standard broadcast frequencies, the insulator spacing is not extremely important and is usually dictated by mechanical considerations alone. At the higher frequencies used by fm broadcasters, the spacing is usually made such that the impedance at the highest operating frequencies varies no more than 3 percent from the lower-frequency (standard broadcast band) values. This practice has resulted in an average spacing of 12 inches for fm lines.
Impedance Values of Coaxial Lines
Currently, 72-ohm coaxial lines are most common for standard broadcast transmitters, and 51.5-ohm lines are most common for fm transmitters.
This holds true whether air-dielectric or solid-dielectric cables are used.
By means of suitable connectors, it is possible and practical in many cases to connect the rigid type of line to a solid type of cable without a matching section.
NOTE: Many of the latest AM transmitters are designed to feed 51.5-ohm transmission lines.
Power-Handling Capacity
The maximum power that a coaxial cable can carry is limited primarily by the temperature rise in the line when the rf is applied. At standard broadcast frequencies, voltage breakdown is the limiting factor. Above approximately 50 MHz, a maximum temperature rise of 40°C in the outer conductor is considered safe. Aside from the actual rf power applied, various conditions may affect the temperature rise in the line. The amount of ventilation, the nature of any type of enclosure, and, most important, the standing-wave ratio are all contributing factors.
In practice, it is customary to consider the probable standing-wave ratio to be encountered ( which is considered later) and then divide the maxi mum power rating of the line by this ratio. For example, if the standing-wave ratio is 1.5 and a line rated at 5000 watts is considered, the maximum power recommended to be fed into the line is 5000/1.5, or 3333 watts.
The four standard diameters of rigid (air-dielectric) coaxial lines are as follows: ¾ 3, 1/8, 3 1/2, and 6 1/8 inches. Most manufacturers design their equipment to accommodate these standard sizes only. In addition, there is a 3/8-inch line used in some very low-power transmitter installations.
Choosing a Coaxial Line
The choice of the impedance value of the line is, of course, dictated by the application. Choose the impedance value specified by the manufacturer.
The choice of the size of the line depends on the maximum power to be applied and the maximum allowable attenuation. Table 9-5 gives the aver age maximum power ratings, based on possible flashovers, for the standard broadcast band. It should be remembered that for AM service the maximum power occurs at 100-percent modulation and is more than the rated power output of the transmitter. Except when lines are very short, they should not be operated at the maximum power rating.
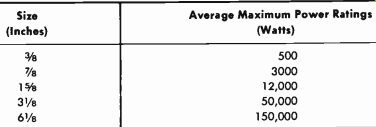
Table 9-5. Typical Maximum-Power Ratings of Air-Dielectric Coaxial Lines
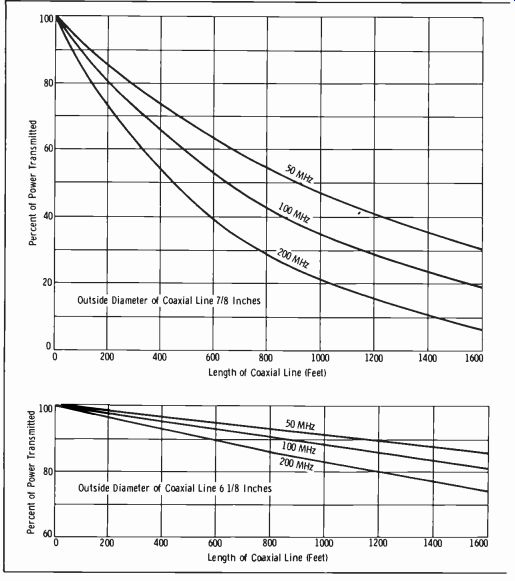
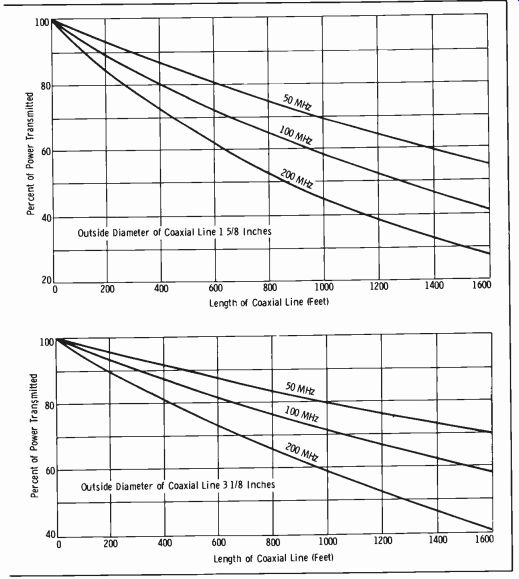
Fig. 9-21. Percent of power
The choice of a coaxial cable for fm broadcast services is somewhat more involved. The procedure may be outlined briefly as follows:
1. To find the power required at the antenna terminals, divide the erp (effective radiated power) by the power gain of the antenna to be used.
2. To find the minimum allowable transmission-line efficiency, divide the antenna input power by the maximum power output of the transmitter.
3. Choose a line from one of the standard sizes that has an efficiency equal to or greater than the minimum allowable value just obtained (Fig. 9-21) .
4. To check the necessary transmitter output power, divide the antenna input power by the efficiency of the line.
5. Check the power rating of the cable. If this rating is less than the necessary transmitter output power, a larger line must be used.
As a practical illustration of this procedure, assume that an erp of 33 kW is required. A 10-kW transmitter will be installed with a 4-bay fm antenna that has a power gain of 3.7. A 200-foot line will be necessary. These values are used in the preceding steps as follows:
1. The erp of 33 kW divided by the antenna power gain of 3.7 = 8920 watts required at the antenna terminals.
2. 8920 watts divided by 10,000 watts = 0.892, or 89 percent.
3. Inspection of Fig. 9-21 shows that the smallest line suitable for a length of 200 feet has a 15/8-inch diameter.
4. 8920 watts divided by 0.89 = 10 kW.
5. Table 9-6 shows that the 1 5/8-inch line is rated at 10 kW at unity power factor.
It was previously shown that to be perfectly safe this power rating must be divided by the probable voltage standing-wave ratio. The antenna in this example has a vswr of less than 1.2, but it is always good practice to assume the maximum allowable vswr of 1.75 in the computations. The average power rating of the 1 5/8-inch line with 1.75 vswr is only 5700 watts. Therefore, we must look to the next larger line, 3 1/2 inches, which is observed to have a power capacity of 24 kW at a vswr of 1.75. The 3 1/8-inch line, then, would be the correct choice in this example. The higher efficiency of this line must then be considered in the computations, and it will be found that a lower transmitter output will be required.
Installation of Coaxial Lines
Fig. 9-21 (cont.) transmitted by coaxial cables.

Table 9-6. Typical Power Ratings of Standard-Size Lines
Semi-flexible, soft-copper lines of the 3/8-inch size usually are manufactured in 100-foot lengths which are spliced together by silver brazing to obtain a gas-tight and electrically secure connection. They are crated in coils and are usually cut to the exact length specified. This type of line is often used in larger stations for rf sampling lines such as those used with remote antenna-current meters and phase monitors.
Rigid lines of hard-temper copper tubing are normally shipped in 20 foot straight lengths. Flanges are usually silver-soldered on both ends of each length at the factory. The flanges have bolt holes so that the lengths of line may be bolted together. Grooves in the faces of the flanges accommodate a round gasket (known as an O-ring) which makes the connection gas-tight and weatherproof. The inner conductors are connected by a slotted bullet spring, which provides a solderless connection necessary for field installation.
When it is necessary to change the direction of line runs, special elbows of 45° or 90° are used. The flange that provides the O-ring groove is silver-soldered to the bend in the usual manner, and the second ring containing the bolt holes is assembled loosely on the bend. This provides a means of rotating the flange so that proper hole alignment may be obtained to accommodate any orientation of the elbow without drilling bolt holes.
It is sometimes necessary to cut a 20-foot section of line in the field.
When this must be done, a device known as a clamp connector may be used to provide a solderless fitting which substitutes for the flange that was cut away. When cutting is necessary, it is preferable to make the cut at the midpoint between the insulators, since cutting the line at any other point will disturb the impedance of the line. This is very important in fm-line installations where the vswr must be kept as low as possible. If a cut is necessary near the transmitter rather than near the antenna end, the effect of the cut is not quite as important. The midpoints between insulators usually are marked by bands on the outside of the line.
Providing for Expansion
Soft-temper coaxial lines in the 3/8- or 7/8-inch size rarely need any special provision for expansion due to temperature changes, since they are somewhat flexible by nature. Rigid lines, however, must have some means of allowing for expansion and contraction. It has been found from experience that in severe climates a temperature range from winter cold to summer heat will cause an effective variation in line length of about 1 1/4 inches per 100 feet. Thus, for example, on a 400-foot run, provisions must be made for a variation of about 5 inches in length.
There are two general types of expansion, one which must be considered in the design and construction of the line itself, and one for which the installation engineer must provide. These two types are known as differential expansion and overall expansion.
Differential expansion results from unequal temperatures of the inner and outer conductors. Under normal operating conditions, the inner conductor develops a temperature rise with respect to the temperature of the outer conductor. This causes an expansion of the inner conductor relative to the outer conductor. Another factor causing differential expansion is that it takes considerably longer for the inner conductor to follow the variations of temperature in the outer conductor due to sudden changes in weather conditions. For example, the outer conductor may be cooled suddenly from 100° to 70°F during a summer shower. It will take longer for the temperature of the inner conductor to change the same amount.
This type of expansion is provided for by making the inner conductor slightly shorter than the outer conductor. Thus when a spring bullet inner connector is used, one end will not fit up tightly against the shoulder, pro viding for relative changes in the lengths of the inner and outer conductors.
The overall expansion must be provided for when the line is installed.
Long horizontal runs must be given some means of relief from such expansion, and when the line runs up a steel tower to feed an fm antenna, consideration must be given to the fact that the expansion coefficient of copper can be as much as 50 percent greater than that of steel. The two metals cannot, therefore, be connected inflexibly together. It is said that several tons of pressure may be developed when no provision for expansion is made, causing failure of transmission-line couplings, supports, or even the tower.
There are several alternative methods of providing for overall expansion.
When the line is located so that it may change directions several times, expansion is allowed by the 45° or 90° elbows. Support standards using roller supports will allow a longitudinal motion of the line. A combination of these two provisions usually allows a sufficient safety factor for the expansion of the line and is widely used for long horizontal runs to the towers.
These methods, however, are not entirely practical on vertical runs up a tower such as those for an fm installation. For such applications, various types of expansion joints have been developed. One type consists of tele scoping outer and inner conductors with a sliding gas-tight seal. This joint is capable of a 4-inch line displacement, which is entirely adequate for a 200-foot line used in an area having temperature variations over a range of-50°F to 150°F. Such expansion joints are often used on horizontal runs as well as vertical runs.
The entire line-support system consists of rigid mounting clamps, sup port brackets or railings allowing axial movement, and sometimes one or more expansion joints. On long vertical runs of more than 150 feet, expansion joints should be considered a prime requirement. On vertical runs of this type, the line is assembled starting at the bottom, the bottom section being rigidly attached to the tower. Additional line sections are supported at approximately 15-foot intervals, preferably with sliding support brackets up to a distance of 200 feet of line. At this point, an expansion joint should be installed, with rigid clamping used on the next 20-foot section. The process is then repeated for each 200 feet of line.
Support brackets may be obtained to fit practically any mounting problem encountered in the field. When it is necessary to insulate the trans mission line from the tower, insulated support brackets are used.
A word of caution should be given. When it is necessary to insulate a transmission line from the tower, the line should be sufficiently separated from the climbing ladder so that a man climbing the tower cannot touch the line. Such a contact could cause severe rf burns. Towers not incorporating a climbing ladder are particularly hazardous to the climber under these circumstances, and he should be cautioned about the danger.
Coaxial-Line Procedures for AM-FM Towers
When an fm antenna must be mounted on an AM tower, it is necessary to mount the transmission line so that the AM electrical characteristics of the tower remain undisturbed. Two practical methods for accomplishing this are the insulated-line method and the bazooka construction.
In either of the methods to be described, it is necessary to provide isolation between the two rf voltages by causing a high impedance to exist be tween the base of the AM tower and the outside surface of the fm transmission line. In the first method, the fm line is insulated from the AM tower by means of insulating brackets for one-quarter wavelength (at the AM frequency) starting at the exact base of the tower. The outer conductor is then shorted to the tower at a point about one-quarter wavelength (at the AM frequency) up from the base. Along the insulated portion of the line, the tower itself is considered to form the outer conductor. In practice, the shorting point is determined by trial and is only approximate. The optimum point is the point at which minimum detuning of the AM tower is obtained. The arrangement is equivalent to a transmission line that is one-quarter wavelength long with the end shorted, and a high impedance exists across the tower base as far as the AM power is concerned. Above the shorting point, the fm line is attached directly to the tower.
In actual installation practice, it is advisable to short the line slightly less than one-quarter wavelength from the tower base and connect a vari able capacitor across the open end at the base ( from outer conductor of line to tower). An exact adjustment may then be made. The capacitor should have a reactance of 400 to 1000 ohms at the AM frequency and should have an adequate voltage rating.
The bazooka method differs from the preceding method only in physical construction and retains the electrical theory of isolation by means of quarter-wave lines. A bazooka is a quarter-wave line (at the AM frequency) assembled along the ground from the base of the tower. It actually consists of a one-quarter wavelength shield installed around a transmission line (Fig. 9-22). The line is insulated from the shield, and the shield is grounded to eliminate radiation at the AM frequency. The fm line runs through the shield as an inner conductor. The line is connected to the tower throughout the entire vertical run, eliminating the need for insulating the line from the tower. The outer shield may be either a metal hood or a wire cage consisting of six wires supported around the line by a metal ring with the wires running through holes around it.
As in the first method, the bazooka section may be cut shorter than an actual quarter wavelength and a variable capacitor shunted across the open end to achieve exact resonance. The reactive and voltage values are the same as in the first case.
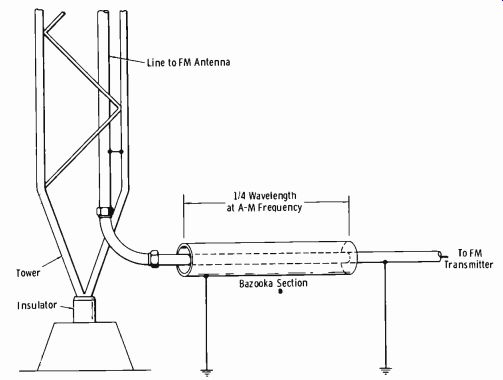
Fig. 9-22. Bazooka used in attaching fm line to AM tower.
Gassing Provisions
In air-dielectric coaxial lines, it is advisable to introduce dry air or nitro gen into the line to prevent moisture condensation. This is done unless the line installed is very large for the applied rf power.
When gassing is used, it also is necessary to bleed the line by using gas-opening flanges at intervals on extremely long lines or at the antenna end.
This means that any moisture which collects may be removed by allowing the dry air or nitrogen to blow through the line, evaporating the moisture.
When lines are run to the top of a tower for an fm antenna, a line is run back down from the gas seal at the antenna to the tower base so that the gas-release valve may be operated there. The gas pressure is not critical, and in practice it may vary from about 1 to 20 pounds per square inch.
Solid-Dielectric Coaxial Line
The advantages of solid-dielectric coaxial line are maximum flexibility, comparatively low initial and installation costs, no gassing requirement, and fewer mounting problems since expansion is not a consideration. The disadvantages are greater attenuation per foot (due to the fact that up to a certain point no further increase in diameter will lower the insulation loss) and less permanency in use when the line is exposed for long periods of time to outdoor weather.
Solid-dielectric lines are composed of a highly resistant vinyl outer jacket and an inner conductor of stranded wire (size determined by type number) separated from an outer conductor of shielded braid by a polyethylene dielectric. The spacing is maintained within close tolerances. Such lines are often used in low-power AM and fm installations where the run may be less than 100 feet and the line is adequately shielded from extreme weather conditions. They are also popularly used for monitoring lines, such as re mote antenna monitor lines.
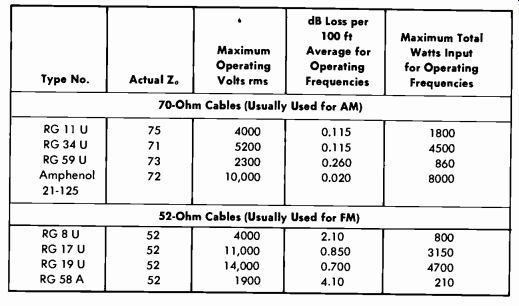
Table 9-7. Solid-Dielectric Coaxial Cable Data
The technical specifications of the most popular sizes of solid-dielectric coaxial lines used in AM and low-power fm transmitter installations are listed in Table 9-7. With regard to the maximum power rating, always re member to divide this rating by the maximum allowable vswr (2 for AM and 1.75 for fm). Although the actual vswr should be lower than these values, this procedure allows a safety factor.
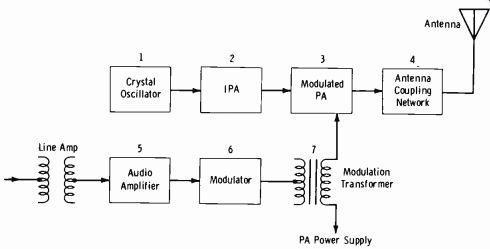
Fig. 9-23. Block diagram of typical 1-kW AM transmitter.
9-14, FUNDAMENTALS OF AM TRANSMITTERS
(A) Operating condition. (B) Screen removed. Courtesy Gates Division Harris-Intertype Corp.
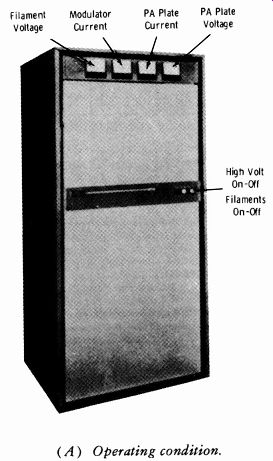
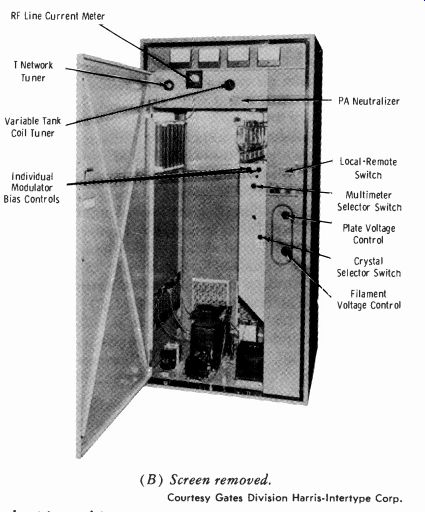
Fig. 9-24. A 1000/250-watt AM broadcast transmitter.
A block diagram of a typical 1000-watt AM transmitter is shown in Fig. 9-23. The functions of each block are as follows:
1. The crystal oscillator generates the carrier frequency. Usually two separate but identical circuits are employed; the extra may be switched in if failure of the other occurs.
2. The intermediate power amplifier (IPA) amplifies the low output from the oscillator stage up to a level sufficient to drive the power amplifier.
3. The power amplifier provides the power to the antenna system. This stage is normally the one which is amplitude-modulated by the audio signal (described under 7) .
4. The antenna coupling network provides the proper load for the power amplifier and the proper driving load to the antenna. In the case of directional antenna systems, the power is divided and phased.
5. In the audio amplifier, audio signals from the studio line output are raised to a level sufficient to drive the modulator stage.
6. The modulator further amplifies the signal to a level sufficient for driving the power amplifier to 100-percent modulation.
7. The modulation-transformer secondary is in series with the power-amplifier plate-voltage feed so that the power-amplifier output amplitude is varied in accordance with the program content.
A typical 1000/250-watt AM transmitter is shown in the normal operating condition with the front door closed in Fig. 9-24A. Behind the front door is a full-length perforated grille, interlocked for personnel protection but affording full view of the components with the transmitter in operation. This shield may be removed in seconds by means of snap locks (Fig. 9-24B) .
Many of the most recent AM transmitters employ all solid-state circuitry in the low-power stages. In transmitters with greater than 5-kW final power output, the intermediate stages, final power amplifier, and modulator still employ vacuum-tube circuitry to meet power requirements.
The block diagram of Fig. 9-23 shows the final amplifier as the modulated stage. When the final rf stage is the one modulated, the process is termed high-level modulation. When an intermediate stage is modulated, followed by linear rf amplifiers, the process is termed intermediate modulation. Low-level modulation is the term applied when a very low-level stage just following the oscillator is modulated.
Fig. 9-25 illustrates the appearance of the modulator and final tube stages of a 50-kW transmitter. The large radiating fins on the tubes are physically connected to the tube anode, and forced air is ducted through these fins to dissipate the heat.
Oscillator and RF Intermediate Stages
Amplitude-modulated transmitters depend on a crystal-controlled oscillator for frequency stability. The crystal is normally operated within a constant-temperature oven to avoid any possible drift caused by changes in ambient temperature.
Intermediate stages prior to modulation are tuned, narrow-band class-C stages for maximum efficiency and minimum harmonic content. Following modulation, all stages are linear rf power amplifiers.
Plate Modulation
Fig. 9-26 shows the basic principle of plate modulation. The rf stage is assumed to have 3000 volts applied to the plate and to have sufficient drive that conduction occurs on the tips of the applied rf signal. Thus plate-cur- rent pulses occur as shown in the diagram; this is typical class-C amplifier operation.
From time T1 to time T2, no audio signal is applied, and the plate cur rent depends on the plate impedance determined by the loading of the out put tank to the antenna transmission line or another stage. The tank circuit, resonant at the operating frequency, converts the plate pulses to a signal that swings on both sides of zero (due to the flywheel effect of charging and discharging the LC combination). The voltage developed in the tank is dependent on the LC ratio and the Q (ratio of reactance to resistance) of the resonant circuit.
At time T2, a positive-going sine-wave voltage is applied from the modulator. This audio-frequency voltage is added to the dc voltage of 3 kV. If the audio voltage peaks at 3 kV, the total voltage applied is 6 kV, doubling the amplitude of the rf plate-current pulse. At the positive peak of the audio signal, the carrier has twice the amplitude of the unmodulated value.
Courtesy RCA
Fig. 9-25. Modulator and final stages of RCA BTA-50F (50 kW) AM broadcast
transmitter.
When the applied audio reaches the negative peak (T3), the 3 kV of audio subtracts from the 3-kV dc voltage applied, resulting in zero plate voltage and zero current. Thus for 100-percent modulation, the carrier swings from zero to twice the unmodulated amplitude.
The plate-current meter measures the average current being drawn by the modulated tube. This reading remains constant for linear modulation (equal positive and negative peaks). At resonance, the tank circuit presents a purely resistive load. Thus, if the unmodulated current in V1 is 500 mA, this meter will indicate the same 500 mA under modulation. If an am meter is inserted in any of the coupled antenna circuitry, the variation of rf energy with modulation will be indicated.
This is illustrated by Fig. 9-27, which shows the relation between antenna current and percent modulation. Thus if 100-percent modulation occurs, the increase in antenna current is 22.5 percent over the unmodulated value.
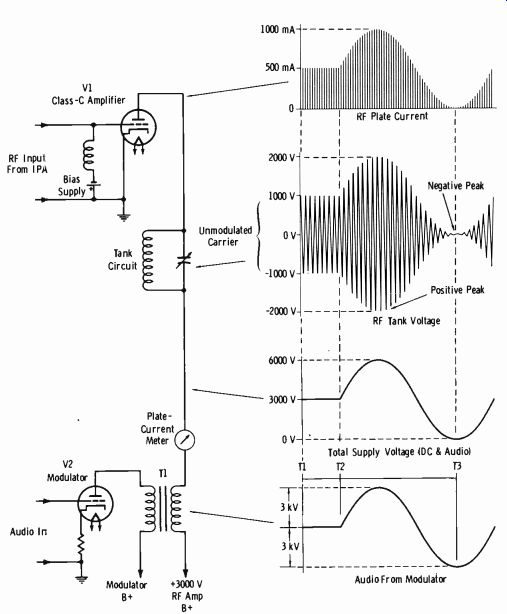
Fig. 9-26. Principle of plate modulation.
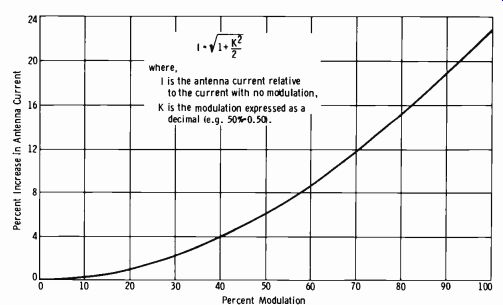
Fig. 9-27. Relation between antenna current and percentage modulation.
To make this relationship clear, bear in mind that when a carrier is modulated 100 percent the total radiated power is 1.5 times the power in the unmodulated carrier. (This is developed in section 9-15.) Now assume an ammeter in the antenna circuit is measuring the rf current in a 50-ohm line with a 100-watt unmodulated carrier.
100 50
_ = 1.414 amperes
When this 100-watt carrier is modulated 100 percent, the power is 150 watts, and the antenna current becomes:
150 50
_ \= 1.732 amperes
Thus a 0.318-ampere increase in antenna current has occurred, and this is equal to a 22.5-percent increase over the unmodulated value of 1.414 amperes.
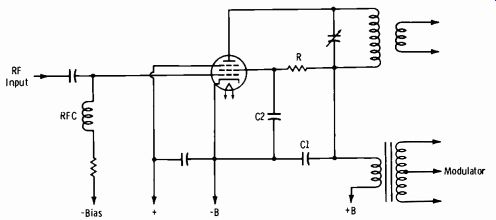
Fig. 9-28. Plate-screen modulation of rf pentode.
Sometimes the rf modulated stage employs a pentode tube. Since the screen voltage also affects the plate current, modulation of the plate alone does not normally allow linear modulation. Therefore, the screen voltage is usually varied in ratio to the plate voltage, resulting in a combination of plate and screen modulation (Fig. 9-28) . Resistor R is the screen dropping resistor, which establishes the proper screen-to-plate voltage ratio. Capacitor C1 presents a high reactance at the highest audio frequency but very low reactance at the radio frequency. The screen bypass capacitor (C2) is normally smaller than 0.002 µF.
Control-Grid Modulation
When modulation occurs in a low-level or intermediate-level stage, grid is class-C amplifier is used with the secondary of the modulation transformer in series with the grid-bias supply rather than the plate supply. The carrier amplitude applied to a grid-modulated stage is less than that normally used for plate modulation, to allow the positive peaks of the carrier wave to shift upward on the transfer curve during the positive alternation of the modulating signal. Thus, when the carrier is not modulated, the peak amplitude of the resulting plate-current pulses is much lower than for corresponding plate-modulation techniques, resulting in less efficiency of operation. This usually is not important, since the necessary number of linear rf stages must be used to obtain the required output power. Grid modulation requires very little power from the modulator.
Diode Modulation
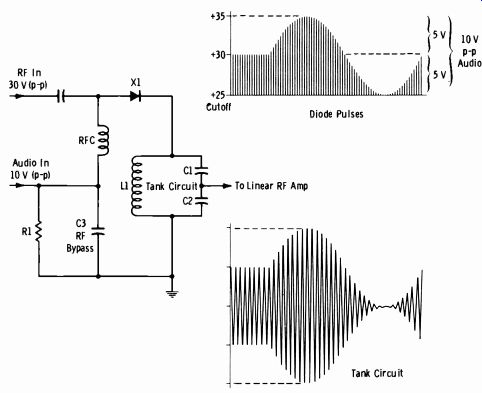
Fig. 9-29. Basic diode modulator.
Fig. 9-30.
A diode modulator is often used in solid-state exciters where modulation occurs at a low level. See Fig. 9-29. A sufficient amplitude of rf is applied to diode X1 to cause conduction on the positive peaks. The modulating audio voltage is applied across R1 and therefore to the same terminal of X1. Capacitor C3 serves as an rf bypass for the audio input.
Due to the high impedance presented by the tank circuit, the diode is cut off until the applied rf reaches a given amplitude. Thus the output of the diode appears as a series of pulses just as in the class-C modulated plate circuit of Fig. 9-26. The applied audio signal then adds to and subtracts from the rf carrier, and the rf pulses are converted to the normal envelope by the tank circuit. For good linear modulation, the ratio of rf to audio must be correct. Typical values in this circuit are 30 volts (p-p) of rf and 10 volts (p-p) of audio for 100-percent modulation.
It may be observed that the action of a diode modulator is exactly the same as the action of a class-C modulated stage, except that no power gain occurs. In fact, the circuit presents a loss of rf power. The stage is always followed by a series of class-AB or-B linear rf amplifiers to achieve the desired power output.
Phase-to-Amplitude Modulation
Phase-to-amplitude modulation, sometimes termed "out-phasing modulation," provides high transmitter efficiency and stability, minimum effect from changes in the characteristics of high-power tubes, and elimination of modulation transformers and reactors. The latest RCA Ampliphase transmitter (RCA's terminology for phase-to-amplitude modulation) uses no iron-core transformers anywhere in the audio system.
Fig. 9-30 is a simplified diagram of one model of RCA Ampliphase ex citer unit. The crystal oscillator is followed by a buffer stage which feeds a center-tapped tank circuit (L1). Since the center tap is grounded, the feeds to the identical rf channels are 180° out of phase. If these signals were recombined, zero output would result. For this reason, "dc modulators" (V3 and V4) provide an appropriate phase relationship and an out put of some desired value of carrier voltage.
This initial phase relationship is obtained by adjusting R1 and R2 (Figs. 9-30 and 9-31) for a 135° phase relationship. These variable resistors in conjunction with the capacitive reactances of the plate circuits allow precise adjustment of the phase between the two identical rf transmitter paths. In this manner, the 180° signals (vectors A and B of Fig. 9-31) are converted to a fixed (unmodulated) carrier voltage (vector C) . Low-Q plate tank circuits are used, and the values of L and C are selected so that variation of R1 or R2 affects only the phase and not the tuning or impedance.
Fig. 9-31. Principle of carrier phase set.
The outputs of the dc modulators feed the first of three cascaded modulator stages. These circuits act in a manner similar to the dc modulators, except that the variable resistance (R3 and R4, Fig. 9-30) is the cathode impedance of an audio cathode follower (V19 and V20). This variable resistance is in series with a capacitive reactance (C3 and C4) in a parallel-resonant circuit, in which L3 and L4 have twice the reactance of the corresponding capacitor. The resulting phase modulation at an audio rate is highly linear because of the linear change in cathode-follower transconductance, with no effect on the magnitude of the impedance seen by the plate of the rf tube.
It will be shown below that a magnitude of phase modulation of ±22.5° for each carrier is required at the output network to represent 100 percent modulation. This is achieved by allowing ±7.5° variation in each of the three modulator stages to result in the desired ±22.5° phase shift.
NOTE: In the earliest RCA Ampliphase transmitters, the carrier frequency generated by the crystal oscillator was divided by three, and a frequency-triplet stage was used following a single phase-modulated stage.
Fig. 9-32A presents a simplified overall block diagram of a typical 50-kW RCA Ampliphase transmitter. The outputs of the modulated stages are fed to a series of conventional broadband amplifiers to achieve 25 kW on each side; the 25-kW outputs combine to result in 50 kW in the combining network. Remember that all rf stages following a modulated stage must present the same impedance from the carrier frequency to the maxi mum sideband frequency. For example, a response to 10 kHz means the amplifier bandwidth must be ±10 kHz, or 20 kHz total.
Each output has its own tank circuit, which is a conventional 90° pi type as shown. The output of the pi network employs a common capacitor for both sides. The input capacitor of each network is adjusted to provide a nonreactive load for the tube, with the characteristic impedance to convert the load resistance to the value required for the tube.
Note the vectors for 100-percent modulation in Fig. 9-32B. The unmodulated carrier is represented as OC1, resulting from the vector addition of Al and B1 (135° phased) . If the two components are changed to A2 and B2 (90° phased), the carrier is 0C2, or twice the amplitude of the un-modulated carrier. This represents the carrier amplitude at 100-percent positive modulation. If the components are changed to A and B, the carrier amplitude reduces to zero, corresponding to 100-percent negative modulation. Thus a total phase excursion of-±-22.5° from the unmodulated carrier phase (on each of the two carriers) results in full modulation.
Fig. 9-32 (A) Unmodulated carrier. (B) 50% modulation. (C) 100% modulation.
(D) Over-modulation.
Fig. 9-33. Oscilloscope waveforms of amplitude-modulated envelope.
9-15. CHARACTERISTICS OF THE MODULATED ENVELOPE
Fig. 9-33 shows oscilloscope presentations of an amplitude-modulated rf envelope. Considerable important information for the engineer is contained in a detailed analysis of this envelope. A carrier wave modulated by voice or music signals contains its information in the resulting upper and lower sidebands, which consist of continuously fluctuating individual frequencies. Thus speech or music modulation results in an envelope that is extremely difficult to analyze. In this section, only single-frequency sine-wave modulation (as shown by Fig. 9-33) will be considered for the purpose of steady-state analysis. Sections 11, 13, and 14 will treat the special and practical problems of operations and maintenance associated with actual program transmission.
Modulation Factor and Percent Modulation
To understand degrees of modulation less than 100 percent, we use a modulation factor (M) to indicate relative magnitudes of rf carrier and audio modulating signal. This modulation factor is:
M= (Eq. 9-1.) where, Em is the peak-to-peak or rms value of modulating voltage, E, is the carrier voltage in the same units as Em.
For example, if a carrier wave with a peak-to-peak amplitude of 1000 volts is modulated with an audio sine wave of 500 volts, the modulation factor is:
500 M 1000
=0.5
Multiplying the modulation factor by 100 gives the percent of modulation (%M):
%M= Ém(100) ( Eq. 9-2.)
Thus the percent modulation in the above example is:
500
%M 000 (100)
= (0.5)(100)
= 50%
Since percent modulation is a ratio, actual voltages need not be measured to find this value. If E,,, and E, of Equation 9-2 are considered to be in peak-to-peak values, the measuring oscilloscope can be set to any convenient gain (Fig. 9-34) . The peak-to-peak value of the modulating voltage (E,,,) is observed to be equal to eo,ex- emir,. Similarly the peak-to-peak carrier voltage (Ea) is seen to be equal to em,z + e,,,1,,. Therefore, substituting these values in Equation 9-2:
%M = etex- e,11, (100) (Eq. 9-3.) emit. + end
In Fig. 9-34, the maximum peak-to-peak amplitude on the scope presentation has been arbitrarily adjusted for 6 graticule divisions. The peak-to-peak minimum carrier amplitude is 2 divisions. Therefore the percent modulation is:
6+2 (100) 8
= (100)
= (0.5) (100)
= 50%
Amplitude-Modulation Sideband Power
The total intelligence of the amplitude-modulated envelope is contained in the sideband frequencies. The greater the sideband energy, the greater the demodulated output in the receiver. The relationship of carrier to modulating voltage was given by equation 9-1. Solving this equation for E,p:
Em = ME, ( Eq. 9-4.)
Thus for a fixed carrier magnitude, the sideband voltage developed across a common impedance varies directly with the modulation factor (M) .
Although the audio modulating voltage (E,,,) is divided between two sidebands (upper and lower) , we will first look at the voltage of a single sideband (EB,), which is one-half the voltage of both sidebands:
E88:= MEr (Eq. 9-5.)
Since power varies as the square of the voltage across a given load resistance (RL) , the power in the single sideband is:
Pee = (ÁL) 2 ( Eq. 9-6.)
Substituting Equation 9-5 into Equation 9-6:
(M E,.1 2 2 138.-eB-
RL and simplifying Equation 9-7:
º Pee = Rt, which can now be written:
Pee( 4z) \RL/
We know that the carrier power (Pr) is:
z Pc RL
Substituting Equation 9-10 in Equation 9-9:
M2 Pee = Pc ( Eq. 9-7.) ( Eq. 9-8.) ( Eq. 9-9.) ( Eq. 9-10.) ( Eq. 9-11.) where, M is the modulation factor, Pes is the average power in one of two equal-amplitude sidebands, Pc is the average carrier power using rms values of voltage and current.
For single-frequency sine-wave modulation, two equal-amplitude side frequencies exist: carrier plus the modulating frequency, and carrier minus the modulating frequency. Thus the total sideband power (Peb) is twice the power given by Equation 9-11.
Therefore:
Peb = 2 Pc (Eq. 9-12.) which can be simplified to:
M2 Peb = Pc where, Peb is the total sideband power, M is the modulation factor, Pc is the average carrier power.
(Eq. 9-13.)
Fig. 9-34. Measurement of percent modulation.
Assume for example that a 5-kW carrier is modulated 100 percent. The sideband power (Eq. 9-13) is:
Pfln = 2 ( 5000 )
_ (0.5) (5000)
= 2500 Watts
This illustrates that 100-percent modulation results in sidebands that contain one-half as much power as the unmodulated carrier.
If the same 5-kW carrier is modulated only 50 percent:
Pan =
0 ( 5000 )
= 0.25 2 (5000)
_ (0.125) (5000)
= 625 Watts
This illustrates that halving the modulation from a given original value reduces the sideband power to one-fourth the original amount.
The total power contained in a modulated wave is equal to the carrier power plus the sideband power. The total power (PT) is:
PT=Pc+Pan ( Eq. 9-14.)
To put this more conveniently in terms of the modulation index (M) , substitute for Psb:
M2 PT = Pe + 2 Pe and factor out Pe:
( Eq. 9-15.) PT=PSI 1+M I ( Eq. 9-16.)
For example, the total power of a 5-kW carrier modulated 100 percent is:
= 7500 Watts
This illustrates that for 100-percent modulation, the total radiated power is 1.5 times the unmodulated carrier power.
As has been stated previously, when a carrier is modulated with a sine wave, sideband energy exists at the carrier frequency plus and minus the modulating frequency. For a 100-percent modulated carrier (Fig. 9-35A), the combined sideband voltage is equal to the carrier voltage and appears as a single set of sidebands above and below the carrier frequency. Since the sideband voltage is divided equally between the two sideband frequencies, each side frequency has one-half the carrier amplitude.
When the modulating voltage exceeds that required for 100-percent modulation, the negative peak of the modulating signal drives the plate voltage of the modulated amplifier negative for a period of time that depends on the degree of overmodulation. For the duration of this negative plate voltage, the carrier is cut off (Fig. 9-35B) . The resultant clipping of the negative peaks of the modulating signal causes spurious frequencies at both odd and even harmonics of the fundamental frequency, above and below the carrier frequency. Depending on the degree of overmodulation, the sideband "splatter" can result in spurious sideband frequency content beyond the fifth or sixth harmonic. Obviously, this not only causes audio distortion in the receiver, but also is a direct violation of FCC rules and results in severe interference to adjacent-channel stations because the added side frequencies overlap the adjacent channels.
At the time of this writing, the FCC allows a maximum of 120-percent modulation on positive peaks, provided the carrier never reaches cutoff on negative program peaks. With speech and program modulation, this is a practical possibility, and it is treated further in the operations sections of this text.
(A) Modulated 100%.
(B) Over-modulated.
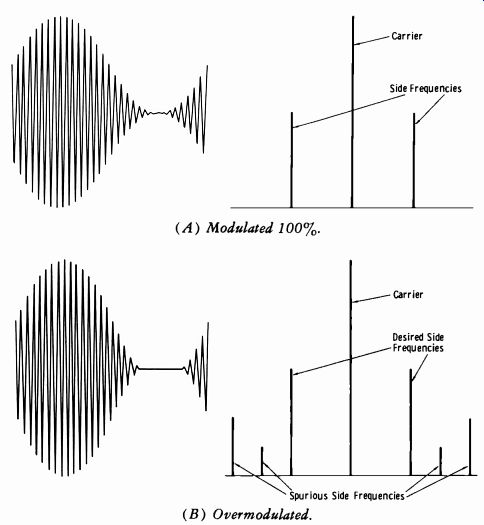
Fig. 9-35. Sidebands of amplitude-modulated carrier.
9-16. TRANSMITTER CONTROL CIRCUITRY
Transmitters employ orderly control-circuit systems for two purposes:
(1) to prevent improper transmitter functioning such as overloaded circuits or inadequate time delays for application of high voltages, and (2) to protect the operating personnel from contacting high-voltage terminals.
The first function also serves to prevent application of voltages to certain elements if they are not receiving a normal flow of cooling medium such as forced air.
A typical sequence of operation is as follows: When the start button is pressed, this action applies filament voltages to the tubes and initiates action in a number of other relay circuits. Blower motors are started, and, until the air stream is of sufficient strength to actuate mercury switches on the air vanes, full filament voltage is not applied (in higher-power transmitters). At the same instant, time-delay relay motors or electrical networks are started. These do not close the high-voltage circuit until a specified time, such as 30 seconds or one minute, has elapsed. Some transmitters employ relays that automatically apply high voltages upon timing out of the delay relay. When the transmitter is first placed on the air, however, switches are normally set to the manual position rather than the automatic position.
This allows an inspection of all operating parameters up to that point before high-voltage application. Door interlock switches prevent application of high voltage if any door is open in a cubicle containing high voltage. An open door also sometimes actuates grounding switches that short the high-voltage supplies to ground so that large capacitors cannot discharge through an operator's body should he accidentally come in contact with a high voltage conductor.
After all filament meters have been checked and normal operation is obtained, the low voltages usually are applied to the rf exciter stages. This permits checking the operation of these stages before application of high voltages to the final stage or series of high-level linear amplifiers.
A description of a typical transmitter control circuit (in this case, for a General Electric 250-watt transmitter) will serve to introduce the student to practical applications. Refer to Fig. 9-36 during the following analysis.
The entire control circuit operates from the secondary of T33, which is energized upon the closing of S3. Assume S3 to be closed. Motor-driven timing relay K1 is energized, and after approximately 30 seconds K1 times out and its normally open contact closes. Its normally closed contact opens and removes power from the relay motor.
Transformer T31, for the green indicating light (IS1), now is energized through the normally closed contact of K2, provided rear-door interlocks S1 and S2 are closed. The green light indicates that the transmitter is ready for the application of plate voltage. The timing relay, K1, prevents application of plate voltage before the tube filaments are warm.
Plate voltage is applied by pressing momentary switch IS1. This energizes relay K3, closing its normally open contact. Relay K2 now energizes through the closed contact of K3, the normally closed contact of K4, and the normally closed contacts of overload relays K7 and K8. As K2 operates, power is removed from green light IS1 and applied to red light IS2; power is applied to the low- and high-voltage rectifier plate transformers; a shunt is placed across the contact of K3 which locks K2 in, and K3 may be de-energized by release of IS1; the plate-contactor interlock between the 250-watt set and an additional power amplifier (if used) closes ( terminals 11-6 and 11-7).

Fig. 9-36. Control circuits in a transmitter.
Momentary-contact switch IS2 serves to remove the plate voltage. De pressing S2 energizes K4. The normally closed contact of this relay opens and de-energizes K2, which falls out; the normally open contact of K4 closes and removes plate voltage from an additional amplifier (if used).
One set of normally closed contacts of low-voltage overload relay K7 and of high-voltage overload relay K8 are in series with K2. Another set of contacts is extended for use in conjunction with a higher-powered amplifier. A set of normally open contacts is extended to a supervisory light circuit, if used. Hence, an overload in the low- or high-voltage supply will cause K2 to drop out, will cause an amplifier plate contactor to drop out, and will cause a supervisory light circuit to operate and indicate in which circuit the overload occurred. The supervisory lights must be operated by auxiliary relays which will lock themselves in when the normally open contacts of K7 or K8 close for an instant. As soon as K2 falls out, K7 or K8 will return to the unenergized position.
Relay K5, when energized, shorts out a surge-limiting resistor (not shown). This resistor limits the peak charging current passed by the high-voltage rectifier tubes to a safe value when plate voltage is applied. Relay K5 is energized through a contact of K6 after K6 is energized. Relay K6 closes when the power-amplifier grid current exceeds approximately 8 milliamperes. Previous to this, a normally closed contact of K6 shorts the power-amplifier screens to ground, thus protecting the tubes from excessive dissipation before the grid excitation is sufficient to produce safe grid bias. By the time the power-amplifier grid current builds up to 8 milliamperes and closes K6, the high-voltage rectifier capacitors are almost fully charged. The subsequent energizing of K5 and shorting of the surge-limiting resistor then results in negligible surge current through the high-voltage rectifier tubes.
Leads may be extended in shunt with IS1 from terminals 11-1 and 11-2 for an external plate "on" control, and in shunt with IS2 from terminals 12-5 and 12-6 for an external plate "off" control. External indicating lights (6.3 volts) may be wired between terminal 12-4 and ground (green) and between terminal 12-3 and ground (red).
The cabinet heater, if used, has a relay coil connected to terminal 11-12 and ground. The normally closed contacts carry power to the heater when power is removed from the transmitter.
An automatic power-failure recloser may be employed. It must be of a nature to place a shunt across terminals 11-11 and 11-12, and also a shunt across terminals 11-1 and 11-2, in case of a brief power failure. These terminals are extended to the amplifier (when used) , which contains an automatic power-failure recloser.
9-17. PARALLEL TRANSMITTER OPERATION
Some AM transmitters employ redundant circuitry to avoid loss of air time or the necessity of purchasing a complete standby transmitter installation, usually of lower power than the main transmitter. Redundancy takes the form either of actual parallel operation of two transmitters, or of a special means of diplexing that allows part of the power amplifier to be used (at reduced output) while the other part ( feeding a dummy load) can be repaired.
Fig. 9-37 is a block diagram of a CCA Dual Reliable AM transmitter.
In this system, two transmitters operating at one-half the authorized power are combined at the output, with an automatic monitoring and switching system. In case of failure in one of the two transmitters, it is automatically disconnected and fed to a test dummy load. The other transmitter can then be fed directly to the antenna transmission line, bypassing the loss incurred in the reject load of the combiner network. This allows servicing of the faulty stage while continuing to operate (at reduced power) , avoiding loss of actual air time. In this case, since the two transmitters are identical, re pair of the faulty unit is facilitated since the electrical characteristics can be compared step-by-step with the correctly operating unit. Obviously, this also reduces the stock of spare tubes and critical components required.
Not shown in the block diagram of Fig. 9-37 is the fact that there are actually two electrically independent oscillators. Both transmitters are fed from the same oscillator through a relay operated by an rf level detector.
In case of failure of the No. 1 oscillator (or the detector system itself) , the relay connects the No. 2 oscillator to feed both transmitters. A manually operated switch allows this type of automatic operation, or the switch may be set for operation of oscillator No. 2. A third position of this selector switch maintains the automatic system but turns oscillator No. 2 on to allow testing and servicing when necessary. Each crystal oscillator employs an independent power supply.
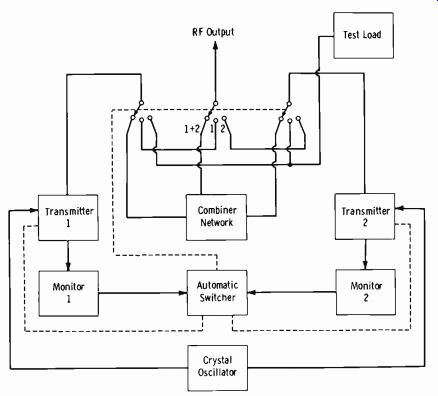
Fig. 9-37. Block diagram of CCA Dual Reliable transmitter.
The rf output of each transmitter is fed to its individual monitoring system which employs a tuned circuit feeding a diode detector. A dc component (proportional to the carrier amplitude) is separated from the demodulated audio envelope. Departure of the carrier level from a preset amount operates relays to remove plate voltage from both transmitters so that no rf arcing can occur in the output switches that are activated. Motor-operated rf switches connect the faulty transmitter to the test load and the operating transmitter to the antenna. Voltages are then automatically re applied to the transmitter feeding the antenna system.
The audio component of the demodulated rf signal in each monitor is also amplified and fed to a peak detector with a very slow decay time constant of about 10 seconds. If this peak rectified signal falls below a preset value, an audio relay will close at the start of this 10-second interval to preset decision-making relays for action. If the 10-second-delayed output of the peak detector shows the output is still missing or low, control relays are enabled to remove the faulty transmitter from the air. The same action occurs in each of the two monitoring systems, which are interconnected in such a way that if one closes when the other does not, the transmitter with the faulty modulator or audio system is removed in 10 seconds, in the same way as for an rf fault. If a similar reduction of modulation occurs in both transmitters, corrective action is not taken, since this condition is interpreted as a lack of modulation due to the signal source.
When the rf switches are in the position shown in Fig. 9-37, the outputs are combined by means of the diplexer circuit shown in Fig. 9-38. The power combination occurs in the two inductive sections, L1 and L2, with common loading capacitor C2. Across this combining network are an RC network (R1C1) and reject power meter M2. When the transmitters are delivering equal power to the combiner, each one is loaded by an impedance equal to that connected at the output terminal, which, with the arms in the position shown in Fig. 9-38, is the antenna system. If one transmitter fails or is reduced in power, the opposite transmitter is still loaded by the same impedance, with part of its power shunted through the reject branch, R1C1. If the transmitter fails completely, the output power of the properly operating transmitter would be split into two equal portions, one-half in the antenna system and one-half in reject load R1. Because of this constant loading characteristic of the diplexer network, the operating transmitter selected can be connected directly to the antenna line without a need for retuning. Thus it is possible to bypass the combining network and eliminate the dissipation of half of the power in the reject load resistor.
9-18. LIMITER AMPLIFIERS
The limiting amplifier, or compression amplifier, is a very important link in a broadcast transmitter installation. The limiting amplifier employed at the transmitter should not be considered as a "volume limiter," but as a peak limiter intended to prevent overloading of transmitter components and carrier cutoff on negative peaks.
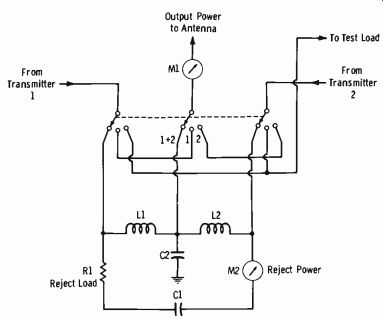
Fig. 9-38. Simplified diagram of combiner network.
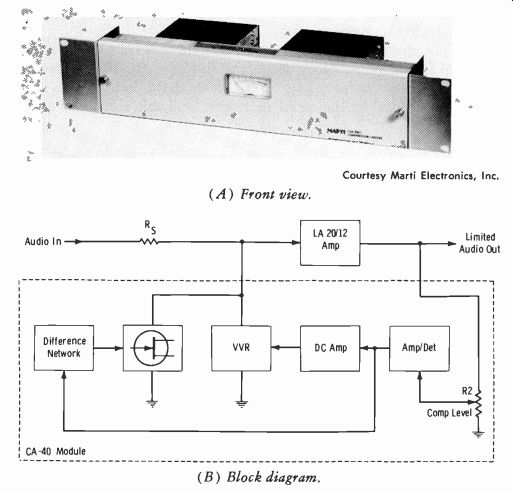
Fig. 9-39A illustrates the Marti CA-40 all solid-state compressor/limiter.
Fig. 9-39B is a simplified block diagram of this unit. The unit operates on the variable-attenuator principle. A full-wave audio detector provides a voltage proportional to the audio peak level, and this voltage controls a voltage-variable resistor (VVR) that acts as an average-level attenuator.
This VVR device has a large dynamic operating range, adds no audio distortion, but has a comparatively slow attack time. For instantaneous control of audio waveforms with short rise times, the control voltage is differentiated and applied to the gate of a field-effect transistor. This device is connected in parallel with the VVR and serves as an extremely fast attenuator, operating only on waveforms with short rise times, thus complementing the slower VVR device. The result is a compressor with a 40-dB dynamic range and a limiter with microseconds attack time.
The release time is adjustable to 800 milliseconds, 2 seconds, or 5 seconds. Control systems allow symmetrical peak limiting for fm and select able asymmetrical or symmetrical peak limiting for AM. The peak limiting level is adjustable.
(A) Front view. (B) Block diagram

Fig. 9-39. Marti CA-40 compressor/limiter.
9-19. MONITORING FACILITIES FOR AM TRANSMITTERS
In addition to conventional audio monitors for checking transmitter in put and demodulated output, two additional monitoring facilities are required. These are the frequency monitor and the modulation monitor.
The Frequency Monitor
A frequency monitor must be included at all transmitter installations to aid in maintaining the frequency within prescribed limits. This device is known as a secondary standard and is normally checked against a primary standard (by a frequency-measuring service) at intervals of 30 to 90 days in order to insure its accuracy.
A station frequency monitor consists essentially of a crystal oscillator which operates at a frequency differing from the transmitter frequency by a given amount. The output of this oscillator is beat with an rf signal picked up from the transmitter, and the amplified beat is applied across a diode circuit which drives the indicating instrument.
The operator at a standard broadcast station must ascertain whether his transmitter is within ± 20 Hz of the assigned frequency, the exact assigned frequency being indicated by zero (center position) on the meter. All oscillator units in transmitters have a small trimmer capacitor which makes exact adjustment of the frequency possible.
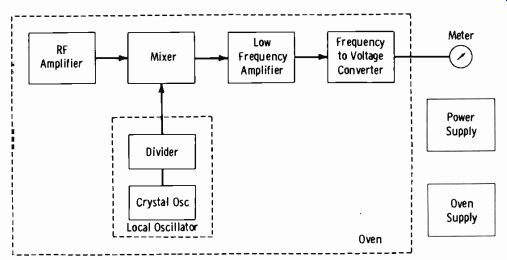
Fig. 9-40. Metron Model 510 analog AM frequency monitor.
A block diagram of the Metron Model 510 analog frequency deviation monitor for AM use is shown in Fig. 9-40. It operates as follows: The transmitter signal (0.1 volt to 3 volts rms) is fed to the rf amplifier and then to the mixer. The signal from the local oscillator, which is set 100 Hz below the transmitter frequency, mixes with the input signal to produce 100 Hz when the transmitter frequency is at zero deviation. The 1007-Hz signal is amplified and fed to a frequency-to-dc converter which produces a dc current. At zero deviation, this current is at the half-scale value of the indicating meter. If the transmitter frequency decreases, the current to the meter decreases, and if the transmitter frequency increases, the current to the meter increases. All circuits except the power supply are located in the oven to give good stability.
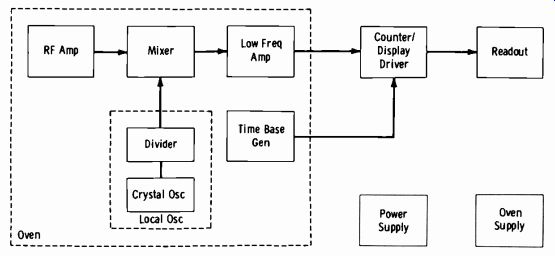
Fig. 9-41. Metron Model 520 digital AM frequency monitor.
The latest AM frequency monitors employ digital techniques to provide electronic numeric readouts directly in plus or minus hertz deviation from the assigned carrier frequency. Fig. 9-41 shows a block diagram of the Metron Model 520 digital AM frequency deviation monitor. This unit has a two-digit electronic numeric readout plus a polarity indicating display.
It incorporates provisions for tuning the transmitter over a frequency range of plus or minus 500 Hz. This is accomplished by the use of a numeral 1 in the polarity-indicating display on the front panel. This 1 flashes once for every 100 Hz deviation in excess of that read on the digital readout.
An image-check push button located on the front panel provides a convenient method of insuring that the frequency read is not an image of the true transmitter frequency.
The monitor in Fig. 9-41 operates as follows: The modulated trans mitted signal (0.1 volt to 3 volts rms) is fed to the rf amplifier and then to the mixer. The signal from the local oscillator, which is set 100 Hz below the transmitted frequency, mixes with the input signal to produce 100 Hz when the transmitter frequency is at zero deviation. This 100-Hz signal is amplified and shaped to produce pulses for the digital logic circuitry. A low-frequency time-base generator produces a stable gate period which is also fed to the digital logic circuitry. During the first half of this gate period, the logic circuit presets to 99, and during the last half of the period, the logic circuit counts down for one second. If the transmitted frequency is correct, the frequency fed to the logic circuitry is 100 Hz, and the countdown is 100, from 99 to 0. The frequency deviation of the trans mitted signal is read every two seconds. The indication on the digital read out tubes remains on constantly except for instantaneously registering any change which occurs during the previous second.
Modulation Monitors
The modulation monitor is designed to give continuous direct reading of percentage modulation of the AM carrier. The unit also normally provides a carrier-level meter to provide constant indication of any carrier shift under modulation (Section 14) .
The CCA Model AMM-1T AM modulation monitor is shown in Fig. 9-42A. This unit provides for the determination of modulation asymmetry through the use of two individually settable peak flashers, one for positive peaks (calibrated from 50 to 130 percent) and one for negative peaks (calibrated from 50 to 100 percent). (In addition, the negative-peak lamp functions as a carrier-off alarm.) Modulation is displayed on a 41/2-inch meter that is switchable to positive or negative modulation as desired. Carrier level is displayed on an expanded scale (80 to 120 percent) for accurate determination of carrier shift.
(A) Front view. (B) Block diagram.
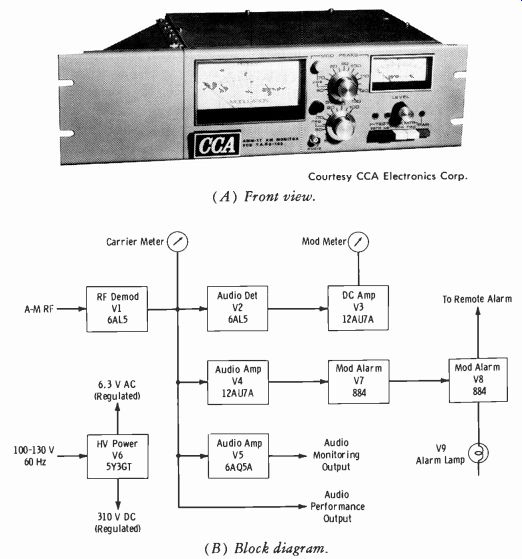
Fig. 9-42. CCA Model AMM-1T AM modulation monitor.
The instrument has built-in test functions which allow it to be calibrated periodically with only an accurate dc voltmeter used as an external reference. Built-in meter drivers can drive an external line of 5000 ohms impedance, and shorting or opening the remote lines will not affect the meters on the monitor.
Refer to the block diagram in Fig. 9-42B. The amplitude-modulated rf is fed to an input level potentiometer and through a wide-band rf matching transformer to the demodulator stage, V1. One-half watt of rf power is sufficient to provide full-scale meter readings. A maximum of four watts of rf can be attenuated by the input potentiometer.
The demodulator consists of two diodes connected in opposite polarity such that two demodulated audio signals of opposite polarity are available.
By means of the front-panel polarity switch, either of these audio signals can be fed to the metering and alarm circuits; the remaining signal is used for monitoring purposes. When the switch is in the positive position, diode 1 of V1 supplies the rectified carrier to the carrier-level meter and demodulated audio to a low-pass filter. This filter eliminates the rf but not the audio frequencies up to 50 kHz.
The output of the filter feeds the audio peak rectifier, V2, which constitutes a peak-reading voltmeter that follows the envelope of the modulation. Between this diode and the dc amplifier, V3, there is a network that over shoots during the rise of the pulse and provides a slow decay during the fall. The time constants of this network, together with the ballistic characteristics of the modulation meter, provide the timing characteristics for the modulation metering specified by the FCC.
Tube V3 is a balanced dc amplifier, which drives the modulation meter.
A zero-set potentiometer is used to balance the two sections of V3 so that the meter will rest at zero when there is no signal applied to the rf input.
It is set at the factory and it will not require resetting until V3 is replaced or has aged considerably. A potentiometer called "audio set" is also set at the factory to provide a 100-percent modulation reading when the transmitter is being modulated 100 percent and the rf input is such that the carrier-level meter reads 100 ( set mark).
The alarm circuit is preceded by a cathode follower, V4, that isolates the thyratron tubes from the audio circuits. It is fed from the same audio source that actuates the carrier meter. The polarity is the same as that set for the modulation meter by means of the polarity switch.
The overmodulation-alarm control thyratron, V7, fires at a voltage deter mined by the bias, which is set by means of the peak-level potentiometer on the front panel. An additional potentiometer determines the audio level fed to V7; it is set at the factory, in conjunction with a resistive network, in order to match the overmodulation flashings with the position of the peak-level control.
Thyratron V7 controls front-panel flashing light V9 and drives switching thyratron V8, which operates the alarm relay. The operation is such that even a brief overmodulation peak will hold the relay closed for a definite length of time. A set of contacts is connected to operate a remote overmodulation indicator or counter. These contacts are rated at 1 ampere, 115 volts ac.
Two indicating meters are provided. The carrier-level meter is graduated from 0 to 120. The 100 mark corresponds to the set position and is near the end of the scale; this allows a better reading of carrier shift.
The modulation-percentage meter is calibrated from 0 to 120-percent modulation and is also calibrated in decibels referred to 100-percent modulation. This meter meets the ballistic characteristics specified by the FCC.
NOTE: The modulation-percentage meter is not a VU meter, nor an instantaneous peak-reading device like an oscilloscope or the peak-level flasher. These devices will not read the same under actual program modulation, but they will coincide under steady modulation.
The frequency response of the modulation metering and alarm circuits is 30 to 15,000 Hz ± 0.5 dB. External meters can be connected.
A second low-pass filter, with a cutoff frequency of 70 kHz, feeds the demodulated audio from diode 2 of V1 to the distortion-meter terminals.
This filter reduces any trace of carrier to below the noise level and allows up to the third harmonic of 15 kHz to reach an external distortion analyzer connected to a terminal board provided. The output level at these terminals is more than 4 volts rms for 100-percent modulation; it is constant ±0.5 dB from 30 to 25,000 Hz; distortion is less than 0.2 percent; and hum and noise is lower than 70 dB below 100-percent modulation.
The same audio signal is fed to the monitoring cathode follower, V5; this cathode follower can drive a 600-ohm line with more than 2 volts rms at 100-percent modulation. Hum and noise is lower than 60 dB below this level; distortion is less than 1 percent. Frequency response is 30 to 25,000 Hz ±0.5 dB.
EXERCISES
Q9-1. Define an angle of one radian.
Q9-2. How would you convert degrees to radians?
Q9-3. For a single cycle, how many radians are there between the maximum positive and maximum negative peaks?
Q9-4. What is the approximate wavelength for (A) 600 kHz, (B) 1600 kHz?
Q9-5. Does the primary service area of a standard broadcast station depend primarily on ground-wave signals or sky-wave signals?
Q9-6. Assuming the same ground conductivity throughout, if the field strength is 100 millivolts/meter at 1 mile, what inverse-distance field strength would you expect at 10 miles?
Q9-7. What is the basic difference between a conventional class-C amplifier and a linear rf amplifier?
Q9-8. What percentage increase occurs in antenna current when the carrier is modulated 100 percent by a pure sine wave?
Q9-9. See Fig. 9-34. If the maximum peak-to-peak value is 6 divisions and the minimum peak-to-peak value is 0.5 division, what is the percent modulation?
Q9-10. What is the total radiated power for a 10-kW carrier when modulated with a sine wave at (A) 100 percent, (B) 50 percent, (C) 25 per cent?