14. The sensation of pitch
Frequency is an objective measure whereas pitch is the subjective near equivalent. Clearly frequency and level are independent, whereas pitch and level are not. FIG. 24 shows the relationship between pitch and level. Place theory indicates that the hearing mechanism can sense a single frequency quite accurately as a function of the place or position of maximum basilar vibration. However, most periodic sounds and real musical instruments produce a series of harmonics in addition to the fundamental. When a harmonically rich sound is present the basilar membrane is excited at spaced locations. FIG. 25 (a) shows all harmonics, (b) shows even harmonics predominating and (c) shows odd harmonics predominating. It would appear that our hearing is accustomed to hearing harmonics in various amounts and the consequent regular pattern of excitation. It’s the overall pattern which contributes to the sensation of pitch even if individual partials vary enormously in relative level.
Experimental signals in which the fundamental has been removed leaving only the harmonics result in unchanged pitch perception. The pattern in the remaining harmonics is enough uniquely to establish the missing fundamental. Imagine the fundamental in (b) to be absent.
Neither the second harmonic nor the third can be mistaken for the fundamental because if they were fundamentals a different pattern of harmonics would result. A similar argument can be put forward in the time domain, where the timing of phase-locked nerve firings responding to a harmonic will periodically coincide with the nerve firings of the fundamental. The ear is used to such time patterns and will use them in conjunction with the place patterns to determine the right pitch. At very low frequencies the place of maximum vibration does not move with frequency yet the pitch sensation is still present because the nerve firing frequency is used.
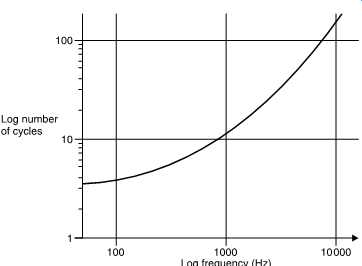
FIG. 26 Pitch discrimination fails as frequency rises. The graph shows the
number of cycles needed to distinguish pitch as a function of frequency.
As the fundamental frequency rises it’s difficult to obtain a full pattern of harmonics as most of them fall outside the range of hearing. The pitch discrimination ability is impaired and needs longer to operate. FIG. 26 shows the number of cycles of excitation needed to discriminate pitch as a function of frequency. Clearly at around 5 kHz performance is failing because there are hardly any audible harmonics left. Phase locking also fails at about the same frequency. Musical instruments have evolved accordingly, with the highest notes of virtually all instruments found below 5 kHz.
15. Frequency response and linearity
It’s a goal in high-quality sound reproduction that the timbre of the original sound shall not be changed by the reproduction process. There are two ways in which timbre can inadvertently be changed, as FIG. 27 shows. In (a) the spectrum of the original shows a particular relationship between harmonics. This signal is passed through a system (b) which has an unequal response at different frequencies. The result is that the harmonic structure (c) has changed, and with it the timbre.
Clearly a fundamental requirement for quality sound reproduction is that the response to all frequencies should be equal.
Frequency response is easily tested using sine waves of constant amplitude at various frequencies as an input and noting the output level for each frequency.
FIG. 28 shows that another way in which timbre can be changed is by non-linearity. All audio equipment has a transfer function between the input and the output which form the two axes of a graph. Unless the transfer function is exactly straight or linear, the output waveform will differ from the input. A non-linear transfer function will cause distortion which changes the distribution of harmonics and changes timbre.
At a real microphone placed before an orchestra a multiplicity of sounds may arrive simultaneously. The microphone diaphragm can only be in one place at a time, so the output waveform must be the sum of all the sounds. An ideal microphone connected by ideal amplification to an ideal loudspeaker will reproduce all of the sounds simultaneously by linear superimposition. However, should there be a lack of linearity anywhere in the system, the sounds will no longer have an independent existence, but will interfere with one another, changing one another's timbre and even creating new sounds which did not previously exist.
This is known as intermodulation. FIG. 29 shows that a linear system will pass two sine waves without interference. If there is any non linearity, the two sine waves will intermodulate to produce sum and difference frequencies which are easily observed in the otherwise pure spectrum.
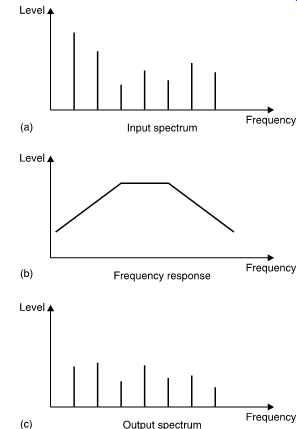
FIG. 27 Why frequency response matters. Original spectrum at (a) determines
timbre of sound. If original signal is passed through a system with deficient
frequency response (b), the timbre will be changed (c).
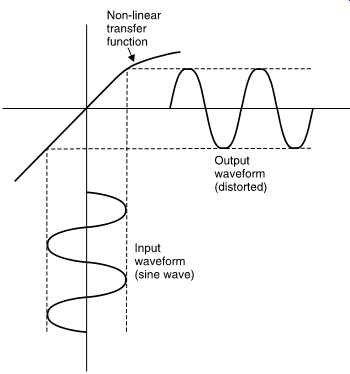
FIG. 28 Non-linearity of the transfer function creates harmonics by distorting
the waveform. Linearity is extremely important in audio equipment.
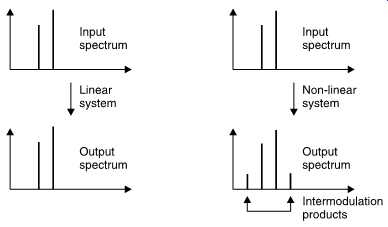
FIG. 29 (a) A perfectly linear system will pass a number of superimposed
waveforms without interference so that the output spectrum does not change.
(b) A non-linear system causes inter-modulation where the output spectrum contains
sum and difference frequencies in addition to the originals.
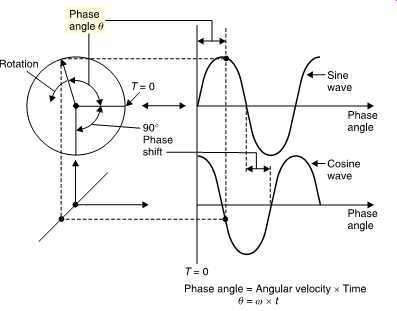
FIG. 30 A sine wave is one component of a rotation. When a rotation is viewed
from two places at right angles, one will see a sine wave and the other will
see a cosine wave. The constant phase shift between sine and cosine is 90°
and should not be confused with the time variant phase angle due to the rotation.
16. The sine wave
As the sine wave is so useful it will be treated here in detail. FIG. 30 shows a constant speed rotation viewed along the axis so that the motion is circular. Imagine, however, the view from one side in the plane of the rotation. From a distance only a vertical oscillation will be observed and if the position is plotted against time the resultant waveform will be a sine wave. Geometrically it’s possible to calculate the height or displacement because it’s the radius multiplied by the sine of the phase angle.
The phase angle is obtained by multiplying the angular velocity w by the time t. Note that the angular velocity is measured in radians per second whereas frequency f is measured in rotations per second or Hertz (Hz). As a radian is unit distance at unit radius (about 57°) then there are 2_ radians in one rotation. Thus the phase angle at a time t is given by sinwt or sin2_ft.
Imagine a second viewer who is at right angles to the first viewer. He will observe the same waveform, but at a different time. The displacement will be given by the radius multiplied by the cosine of the phase angle. When plotted on the same graph, the two waveforms are phase-shifted with respect to one another. In this case the phase-shift is 90° and the two waveforms are said to be in quadrature. Incidentally the motions on each side of a steam locomotive are in quadrature so that it can always get started (the term used is quartering). Note that the phase angle of a signal is constantly changing with time whereas the phase-shift between two signals can be constant. It’s important that these two are not confused.
The velocity of a moving component is often more important in audio than the displacement. The vertical component of velocity is obtained by differentiating the displacement. As the displacement is a sine wave, the velocity will be a cosine wave whose amplitude is proportional to frequency. In other words the displacement and velocity are in quadrature with the velocity lagging. This is consistent with the velocity reaching a minimum as the displacement reaches a maximum and vice versa. FIG. 31 shows the displacement, velocity and acceleration waveforms of a body executing SHM. Note that the acceleration and the displacement are always anti-phase.
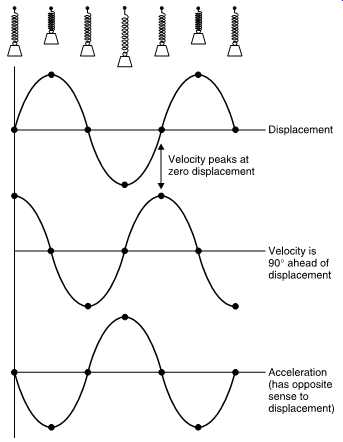
FIG. 31 The displacement, velocity and acceleration of a body executing simple
harmonic motion (SHM).
17. Root mean square measurements
FIG. 32(a) shows that according to Ohm's law, the power dissipated in a resistance is proportional to the square of the applied voltage. This causes no difficulty with direct current (DC), but with alternating signals such as audio it’s harder to calculate the power. Consequently a unit of voltage for alternating signals was devised. FIG. 32(b) shows that the average power delivered during a cycle must be proportional to the mean of the square of the applied voltage. Since power is proportional to the square of applied voltage, the same power would be dissipated by a DC voltage whose value was equal to the square root of the mean of the square of the AC voltage. Thus the Volt rms (root mean square) was specified. An AC signal of a given number of Volts rms will dissipate exactly the same amount of power in a given resistor as the same number of Volts DC.
FIG. 33(a) shows that for a sine wave the rms voltage is obtained by dividing the peak voltage Vpk by the square root of two. However, for a square wave(b) the rms voltage and the peak voltage are the same. Most moving coil AC voltmeters only read correctly on sine waves, whereas many electronic meters incorporate a true rms calculation.
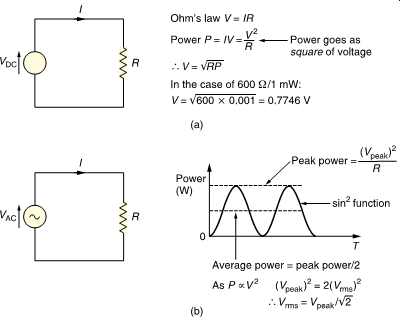
FIG. 32 (a) Ohm's law: the power developed in a resistor is proportional
to the square of the voltage. Consequently, 1mW in 600 _ requires 0.775V. With
a sinusoidal alternating input (b), the power is a sine squared function which
can be averaged over one cycle. A DC voltage which would deliver the same power
has a value which is the square root of the mean of the square of the sinusoidal
input.
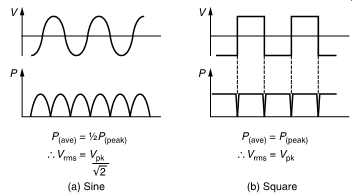
FIG. 33 (a) For a sine wave the conversion factor from peak to rms is __/2.
(b) For a square wave the peak and rms voltage is the same.
On an oscilloscope it’s often easier to measure the peak-to-peak voltage which is twice the peak voltage. The rms voltage cannot be measured directly on an oscilloscope since it depends on the waveform although the calculation is simple in the case of a sine wave.
18. The deciBel (dB)
The first audio signals to be transmitted were on telephone lines. Where the wiring is long compared to the electrical wavelength (not to be confused with the acoustic wavelength) of the signal, a transmission line exists in which the distributed series inductance and the parallel capacitance interact to give the line a characteristic impedance. In telephones this turned out to be about 600 ohms. In transmission lines the best power delivery occurs when the source and the load impedance are the same; this is the process of matching.
It was often required to measure the power in a telephone system, and one milliwatt was chosen as a suitable unit. Thus the reference against which signals could be compared was the dissipation of one milliwatt in 600 ohms. FIG. 32(a) shows that the dissipation of 1mW in 600 ohms will be due to an applied voltage of 0.775V rms. This voltage became the reference against which all audio levels are compared.
The deciBel is a logarithmic measuring system and has its origins in telephony7 where the loss in a cable is a logarithmic function of the length. Human hearing also has a logarithmic response with respect to sound pressure level (SPL). In order to relate to the subjective response audio signal level measurements have also to be logarithmic and so the deciBel was adopted for audio.
FIG. 34 shows the principle of the logarithm. To give an example, if it’s clear that 10^2 is 100 and 10^3 is 1000, then there must be a power between 2 and 3 to which 10 can be raised to give any value between 100 and 1000. That power is the logarithm to base 10 of the value. e.g. log10 300 = 2.5 approx. Note that 100 is 1.
Logarithms were developed by mathematicians before the availability of calculators or computers to ease calculations such as multiplication, squaring, division and extracting roots. The advantage is that, armed with a set of log tables, multiplication can be performed by adding and division by subtracting. FIG. 34 shows some examples. It will be clear that squaring a number is performed by adding two identical logs and the same result will be obtained by multiplying the log by 2.
The slide rule is an early calculator which consists of two logarithmically engraved scales in which the length along the scale is proportional to the log of the engraved number. By sliding the moving scale two lengths can easily be added or subtracted and as a result multiplication and division is readily obtained.
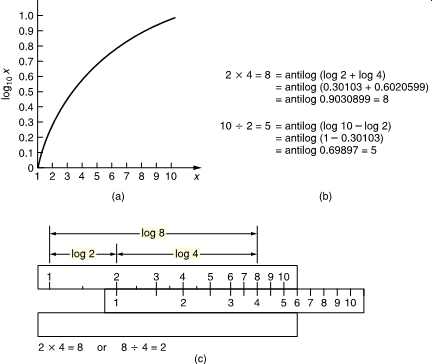
FIG. 34 (a) The logarithm of a number is the power to which the base (in
this case 10) must be raised to obtain the number. (b) Multiplication is obtained
by adding logs, division by subtracting. (c) The slide rule has two logarithmic
scales whose length can easily be added or subtracted.
[figure unavail.] FIG. 35 (a) The Bel is the log of the ratio between two powers, that to be measured and the reference. The Bel is too large so the deciBel is used in practice. (b) As the dB is defined as a power ratio, voltage ratios have to be squared. This is conveniently done by doubling the logs so the ratio is now multiplied by 20.
The logarithmic unit of measurement in telephones was called the Bel after Alexander Graham Bell, the inventor. FIG. 35(a) shows that the Bel was defined as the log of the power ratio between the power to be measured and some reference power. Clearly the reference power must have a level of 0 Bels since log10 1 is 0.
The Bel was found to be an excessively large unit for practical purposes and so it was divided into 10 deciBels, abbreviated dB with a small d and a large B and pronounced deebee. Consequently the number of dB is ten times the log of the power ratio. A device such as an amplifier can have a fixed power gain which is independent of signal level and this can be measured in dB. However, when measuring the power of a signal, it must be appreciated that the dB is a ratio and to quote the number of dBs without stating the reference is about as senseless as describing the height of a mountain as 2000 without specifying whether this is feet or meters.
To show that the reference is one milliwatt into 600 ohm, the units will be dB(m). In radio engineering, the dB(W) will be found which is power relative to one watt.
Although the dB(m) is defined as a power ratio, level measurements in audio are often done by measuring the signal voltage using 0.775V as a reference in a circuit whose impedance is not necessarily 600 ohm. FIG. 35(b) shows that as the power is proportional to the square of the voltage, the power ratio will be obtained by squaring the voltage ratio. As squaring in logs is performed by doubling, the squared term of the voltages can be replaced by multiplying the log by a factor of two. To give a result in deciBels, the log of the voltage ratio now has to be multiplied by 20.
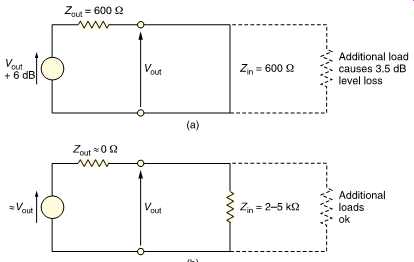
FIG. 36 (a) Traditional impedance matched source wastes half the signal voltage
in the potential divider due to the source impedance and the cable. (b) Modern
practice is to use low-output impedance sources with high-impedance loads.
Whilst 600 ohm matched impedance working is essential for the long distances encountered with telephones, it’s quite inappropriate for analog audio wiring in a studio. The wavelength of audio in wires at 20 kHz is 15 km. Studios are built on a smaller scale than this and clearly analog audio cables are not transmission lines and their characteristic impedance is not relevant.
In professional analog audio systems impedance matching is not only unnecessary it’s also undesirable. FIG. 36(a) shows that when impedance matching is required the output impedance of a signal source must be artificially raised so that a potential divider is formed with the load. The actual drive voltage must be twice that needed on the cable as the potential divider effect wastes 6 dB of signal level and requires unnecessarily high power supply rail voltages in equipment. A further problem is that cable capacitance can cause an undesirable HF roll-off in conjunction with the high source impedance.
In modern professional analog audio equipment, shown in FIG. 36(b), the source has the lowest output impedance practicable. This means that any ambient interference is attempting to drive what amounts to a short circuit and can only develop very small voltages. Furthermore shunt capacitance in the cable has very little effect. The destination has a somewhat higher impedance (generally a few k_ ) to avoid excessive currents flowing and to allow several loads to be placed across one driver.
In the absence of a fixed impedance it’s meaningless to consider power. Consequently only signal voltages are measured. The reference remains at 0.775V, but power and impedance are irrelevant. Voltages measured in this way are expressed in dB(u); the most common unit of level in modern analog systems. Most installations boost the signals on interface cables by 4 dB. As the gain of receiving devices is reduced by 4 dB, the result is a useful noise advantage without risking distortion due to the drivers having to produce high voltages.
In order to make the difference between dB(m) and dB(u) clear, consider the lossless matching transformer shown in FIG. 37. The turns ratio is 2:1 therefore the impedance matching ratio is 4:1. As there is no loss in the transformer, the input power is the same as the output power so that the transformer shows a gain of 0 dB(m). However, the turns ratio of 2:1 provides a voltage gain of 6 dB(u). The doubled output voltage will deliver the same power to the quadrupled load impedance.
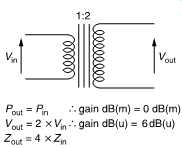
FIG. 37 A lossless transformer has no power gain so the level in dB(m) on
input and output is the same. However, there is a voltage gain when measurements
are made in dB(u).
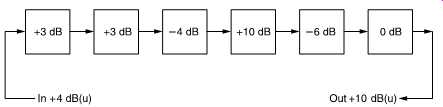
FIG. 38 In complex systems each stage may have voltage gain measured in dB.
By adding all of these gains together and adding to the input level in dB(u),
the output level in dB(u) can be obtained.
In a complex system signals may pass through a large number of processes, each of which may have a different gain. If one stays in the linear domain and measures the input level in volts rms, the output level will be obtained by multiplying by the gains of all the stages involved.
This is a complex calculation.
The difference between the signal level with and without the presence of a device in a chain is called the insertion loss measured in dB. However, if the input is measured in dB(u), the output level of the first stage can be obtained by adding the insertion loss in dB. This is shown in FIG. 38.
The output level of the second stage can be obtained by further adding the loss of the second stage in dB and so on. The final result is obtained by adding together all the insertion losses in dB and adding them to the input level in dB(u) to give the output level in dB(u). As the dB is a pure ratio it can multiply anything (by addition of logs) without changing the units. Thus dB(u) of level added to dB of gain are still dB(u).
In acoustic measurements, the sound pressure level (SPL) is measured in deciBels relative to a reference pressure of 2 _ 10-5 Pascals (Pa) rms. In order to make the reference clear the units are dB(SPL). In measurements which are intended to convey an impression of subjective loudness, a weighting filter is used prior to the level measurement which reproduces the frequency response of human hearing which is most sensitive in the midrange. The most common standard frequency response is the so called A-weighting filter, hence the term dB(A) used when a weighted level is being measured. At high or low frequencies, a lower reading will be obtained in dB(A) than in dB(SPL).
19. Audio level metering
There are two main reasons for having level meters in audio equipment: to line up or adjust the gain of equipment, and to assess the amplitude of the program material.
Line-up is often done using a 1 kHz sine wave generated at an agreed level such as 0 dB(u). If a receiving device does not display the same level, then its input sensitivity must be adjusted. Tape recorders and other devices which pass signals through are usually lined up so that their input and output levels are identical, i.e. their insertion loss is 0 dB. Line up is important in large systems because it ensures that inadvertent level changes don’t occur.
In measuring the level of a sine wave for the purposes of line-up, the dynamics of the meter are of no consequence, whereas on program material the dynamics matter a great deal. The simplest (and cheapest) level meter is essentially an AC voltmeter with a logarithmic response. As the ear is logarithmic, the deflection of the meter is roughly proportional to the perceived volume, hence the term volume unit (VU) meter.
In audio recording and broadcasting, the worst sin is to overmodulate the tape or the transmitter by allowing a signal of excessive amplitude to pass. Real audio signals are rich in short transients which pass before the sluggish VU meter responds. Consequently the VU meter is also called the virtually useless meter in professional circles.
Broadcasters developed the peak program meter (PPM) which is also logarithmic, but which is designed to respond to peaks as quickly as the ear responds to distortion. Consequently the attack time of the PPM is carefully specified. If a peak is so short that the PPM fails to indicate its true level, the resulting overload will also be so brief that the ear won’t hear it. A further feature of the PPM is that the decay time of the meter is very slow, so that any peaks are visible for much longer and the meter is easier to read because the meter movement is less violent.
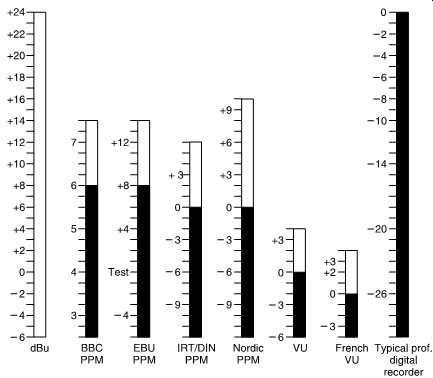
FIG. 39 Some of the scales used in conjunction with the PPM dynamics. (After
Francis Rumsey, with permission.).
The original PPM as developed by the BBC was sparsely calibrated, but other users have adopted the same dynamics and added dB scales, FIG. 39 shows some of the scales in use.
In broadcasting, the use of level metering and line-up procedures ensures that the level experienced by the listener does not change significantly from program to program. Consequently in a transmission suite, the goal would be to broadcast recordings at a level identical to that which was obtained during production. However, when making a recording prior to any production process, the goal would be to modulate the recording as fully as possible without clipping as this would then give the best signal-to-noise ratio. The level would then be reduced if necessary in the production process.
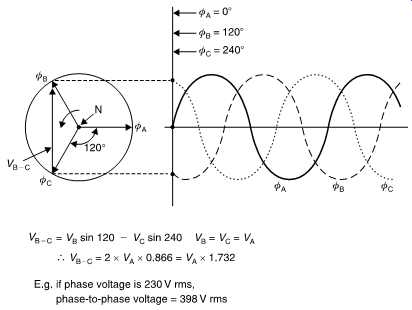
FIG. 40 Three-phase electricity uses three signals mutually at 120°. Thus
the phase-to-phase voltage has to be calculated vectorally from the phase-to-neutral
voltage as shown.
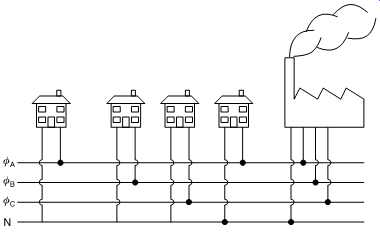
FIG. 41 The possibility of a phase-to-phase shock is reduced in suburban
housing by rotating phases between adjacent buildings. This also balances the
loading on the three phases.
20. Vectors
Often several signals of the same frequency but with differing phases need to be added. When the two phases are identical, the amplitudes are simply added. When the two phases are 180° apart the amplitudes are subtracted. When there is an arbitrary phase relationship, vector addition is needed. A vector is simply an arrow whose length represents the amplitude and whose direction represents the phase-shift. FIG. 40 shows a vector diagram showing the phase relationship in the common three-phase electricity supply. The length of each vector represents the phase-to-neutral voltage which in many countries is about 230V rms. As each phase is at 120° from the next, what will the phase-to-phase voltage be? FIG. 40 shows that the answer can be found geometrically to be about 380V rms. Consequently whilst a phase-to-neutral shock is not recommended, getting a phase-to-phase shock is recommended even less! The three-phase electricity supply has the characteristic that although each phase passes through zero power twice a cycle, the total power is constant. This results in less vibration at the generator and in large motors. When a three-phase system is balanced (i.e. there is an equal load on each phase) there is no neutral current. FIG. 41 shows that most suburban power installations each house only has a single-phase supply for safety. The houses are connected in rotation to balance the load.
Business premises such as recording studios and broadcasters will take a three-phase supply which should be reasonably balanced by connecting equal loading to each phase.
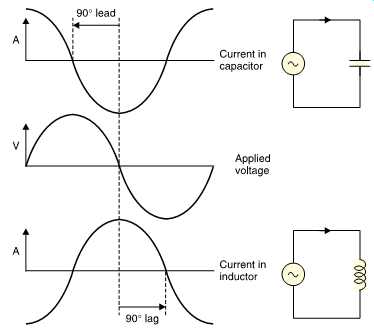
FIG. 42 Ideal capacitors conduct current with a quadrature phase lead whereas
inductors have a quadrature phase lag. In both cases the quadrature makes the
product of current and voltage zero so no power is dissipated.
21. Phase angle and power factor
The power is only obtained by multiplying the voltage by the current when the load is resistive. Only with a resistive load will the voltage and the current be in the same phase. In both electrical and audio power distribution systems, the load may be reactive which means that the current and voltage waveforms have a relative phase-shift. Mathematicians would describe the load as complex.
In a reactive load, the power in Watts, W, is given by multiplying the rms voltage, the rms current and the cosine of the relative phase angle θ.
Clearly if the voltage and current are in quadrature there can be no power dissipated because cosθ is zero. Cos θ is called the power factor. FIG. 42 shows that this happens with perfect capacitors and perfect inductors connected to an AC supply. With a perfect capacitor, the current leads the voltage by 90°, whereas with a perfect inductor the current lags the voltage by 90°.
A power factor significantly less than one is undesirable because it means that larger currents are flowing than are necessary to deliver the power. The losses in distribution are proportional to the current and so a reactive load is an inefficient load. Lightly loaded transformers and induction motors act as inductive loads with a poor power factor. In some industrial installations it’s economic to install power factor correction units which are usually capacitor banks that balance the lagging inductive load with a capacitive lead.
As the power factor of a load cannot be anticipated, AC distribution equipment is often rated in Volt-Amps (VA) instead of Watts. With a resistive load, the two are identical, but with a reactive load the power which can be delivered falls. As loudspeakers are almost always reactive, audio amplifiers should be rated in VA. Instead amplifiers are rated in Watts leaving the unfortunate user to find out for himself what reactive load can be driven.
22. Audio cabling
Balanced line working was developed for professional analog audio as a means to reject noise. This is particularly important for microphone signals because of the low levels, but is also important for both line level analog and digital signals where interference may be encountered from electrical and radio installations. FIG. 43 shows how balanced audio should be connected. The receiver subtracts one input from the other which rejects any common mode noise or hum picked up on the wiring.
Twisting the wires tightly together ensures that both pick up the same amount of interference.
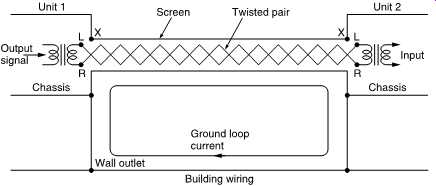
FIG. 43 Balanced analog audio interface. Note that the braid plays no part
in transmitting the audio signal, but bonds the two units together and acts
as a screen.
Loop currents flowing in the screen are harmless.
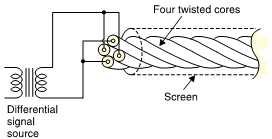
FIG. 44 In star-quad cabling each leg of the balanced signal is connected
to two conductors which are on opposite sides of a four-phase helix. The pickup
of interference on the two legs is then as equal as possible so that the differential
receiver can reject it.
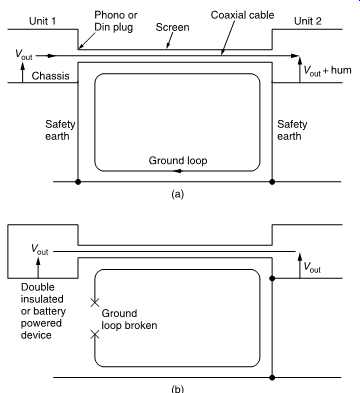
FIG. 45 (a) Unbalanced consumer equipment cannot be protected from hum loops
because the signal return and the screen are the same conductor. (b) With a
floating signal source there will be no current in the screen. Source must
be double insulated for safety.
The star-quad technique is possibly the ultimate interference rejecting cable construction. FIG. 44 shows that in star-quad cable four conductors are twisted together. Diametrically opposite pairs are connected together at both ends of the cable and used as the two legs of a differential system. The interference pickup on the two legs is rendered as identical as possible by the construction so that it can be perfectly rejected at a well-engineered differential receiver.
The standard connector which has been used for professional audio for many years is the XLR which has three pins. It’s easy to remember that pins 1, 2 and 3 connect to eXternal, Live and Return respectively. EXternal is the cable screen, Live is the in-phase leg of the balanced signal and Return is self-explanatory. The metal body shell of the XLR connector should be connected to both the cable screen and pin 1 although cheaper connectors don’t provide a tag for the user to make this connection and rely on contact with the chassis socket to ground the shell. Oddly, the male connector (the one with pins) is used for equipment signal outputs, whereas the female (the one with receptacles) is used with signal inputs.
This is so that when phantom power is used, the live parts are insulated.
When making balanced cables it’s important to ensure that the twisted pair is connected identically at both ends. If the two wires are inadvertently interchanged, the cable will still work, but a phase reversal will result, causing problems in analog stereo installations. Digital cables are unaffected by a phase reversal.
In consumer equipment differential working is considered too expensive. Instead single-ended analog signals using coax cable are found using phono, DIN and single-pole jack connectors. Whilst these are acceptable in permanent installations, they won’t stand repeated connection and disconnection and become unreliable.
Effective unbalanced transmission of analog or digital signals over long distances is very difficult. When the signal return, the chassis ground and the safety ground are one and the same as in FIG. 45(a), ground loop currents cannot be rejected. The only solution is to use equipment which is double insulated so that no safety ground is needed. Then each item can be grounded by the coax screen. As FIG. 45(b) shows, there can then be no ground current as there is no loop. However, unbalanced working also uses higher impedances and lower signal levels and is more prone to interference. For these reasons some better-quality consumer equipment will be found using balanced signals.
23. EMC
EMC stands for electromagnetic compatibility which is a way of making electronic equipment more reliable by limiting both the amount of spurious energy radiated and the sensitivity to extraneous radiation. As electronic equipment becomes more common and more of our daily life depends upon its correct operation it becomes important to contain the unwanted effects of interference.
In audio equipment external interference can cause unwanted signals to be superimposed on the wanted audio signal. This is most likely to happen in sensitive stages handling small signals; e.g. microphone preamplifiers and tape replay stages. Interference can enter through any cables, including the power cable, or by radiation. Such stages must be designed from the outset with the idea that radio frequency energy may be present which must be rejected. Whilst one could argue that RF energy from an arcing switch should be suppressed at source one cannot argue that cellular telephones should be banned as they can only operate using RF radiation. When designing from the outset, RF rejection is not too difficult. Putting it in afterwards is often impossible without an uneconomic redesign.
There have been some complaints from the high-end Hi-Fi community that the necessary RF suppression components will impair the sound quality of audio systems but this is nonsense. In fact good EMC design actually improves sound quality because by eliminating common impedances which pick up interference distortion is also reduced.
In balanced signaling the screen does not carry the audio, but serves to extend the screened cabinets of the two pieces of equipment with a metallic tunnel. For this to be effective against RF interference it has to be connected at both ends. This is also essential for electrical safety so that no dangerous potential difference can build up between the units. FIG. 43 showed that connecting the screen at both ends causes an earth loop with the building ground wiring. Loop currents will circulate as shown but this is not a problem because by shunting loop currents into the screen, they are kept out of the audio wiring.
Some poorly designed equipment routes the X-pin of the XLR via the pcb instead of direct to the equipment frame. As FIG. 46 shows, this effectively routes loop currents through the circuitry and is prone to interference. This approach does not comply with recent EMC regulations but there is a lot of old equipment still in service which could be put right.
A simple track cut and a new chassis-bonded XLR socket is often all that is necessary. Another false economy is the use of plastic XLR shells which cannot provide continuity of screening.
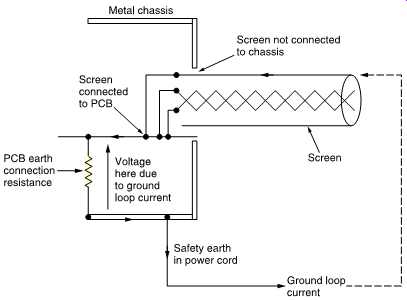
FIG. 46 Poorly designed product in which screen currents pass to chassis
via circuit board. Currents flowing in ground lead will raise voltages which
interfere with the audio signal.
Differential working with twisted pairs is designed to reject hum and noise, but it only works properly if both signal legs have identical frequency/impedance characteristics at both ends. The easiest way of achieving this is to use transformers which give much better RF rejection than electronic balancing. Whilst an effective electronic differential receiver can be designed with care, a floating balanced electronic driver cannot compete with a transformer. An advantage of digital audio is that these transformers can be very small and inexpensive, whereas a high quality analog transformer is very expensive indeed.
Analog audio equipment works at moderate frequencies and seldom has a radiation problem. However, any equipment controlled by a microprocessor or containing digital processing is a potential source of interference and once more steps must be taken in the design stage to ensure that radiation is minimized. It should be borne in mind that poor layout may result in radiation from the digital circuitry actually impairing the performance of analog circuits in the same device. This is a critical issue in convertor design. It’s consequently most unlikely that a convertor which could not meet the EMC regulations would meet its audio quality specification.
All AC-powered audio devices contain some kind of power supply which rectifies the AC line to provide DC power. This rectification process is non-linear and can produce harmonics which leave the equipment via the power cable and cause interference elsewhere. Suitable power cord filtering must be provided to limit harmonic generation.
24. Electrical safety
Under fault conditions an excess of current can flow and the resulting heat can cause fire. Practical equipment must be fused so that excessive current causes the fuse element to melt, cutting off the supply. In many electronic devices the initial current exceeds the steady current because capacitors need to charge. Safe fusing requires the use of slow-blow fuses which have increased thermal mass. The switch-on surge won’t blow the fuse, whereas a steady current of the same value will. Slow blow fuses can be identified by the (T) after the rating, e.g. 3.15A(T). Blown fuses should only be replaced with items of the same type and rating. Fuses do occasionally blow from old age, but any blown fuse should be regarded as indicating a potential problem. Replacing a fuse with one of a higher rating is the height of folly as no protection against fire is available. When dual-voltage 115/230 equipment is set to a different range a different fuse will often be necessary. In some small power supplies the power taken is small and the use of a fuse is not practicable. Instead a thermal switch is built into the transformer. In the case of overheating this will melt.
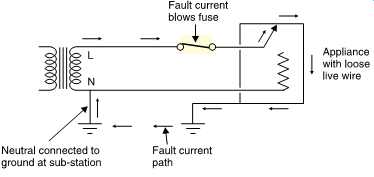
FIG. 47 For electrical safety the metallic housing of equipment is connected
to ground, preventing a dangerous potential existing in the case of a fault.
Generally these switches are designed to work once only after which the transformer must be replaced.
Except for low-voltage battery-powered devices, electrically powered equipment has to be considered a shock hazard to the user and steps must be taken to minimize the hazard. There are two main ways in which this is achieved. FIG. 47 shows that the equipment is made with a conductive case which is connected to earth via a third conductor. In the event that a fault causes live wiring to contact the case, current is conducted to ground which will blow the fuse. Clearly disconnecting the earth for any purpose could allow the case to become live. The alternative is to construct the equipment in such a way that live wiring physically cannot cause the body to become live. In a double-insulated product all the live components are encased in plastic so that even if a part such as a transformer or motor becomes live it’s still insulated from the outside.
Double-insulated devices need no safety earth.
Where there is a risk of cables being damaged or cut, earthing and double insulation are of no help because the live conductor in the cable may be exposed. Safety can be enhanced by the use of a residual current breaker (RCB) which detects any imbalance in live and neutral current.
An imbalance means that current is flowing somewhere it shouldn't and this results in the breaker cutting off the power.
References:
1. Moore, B.C.J., An Introduction to the Psychology of Hearing, London: Academic Press (1989)
2. Muraoka, T., Iwahara, M. and Yamada, Y., Examination of audio bandwidth requirements for optimum sound signal transmission. J. Audio Eng. Soc., 29, 2-9 (1982)
3. Muraoka, T., Yamada, Y. and Yamazaki, M., Sampling frequency considerations in digital audio. J. Audio Eng. Soc., 26, 252-256 (1978)
4. Fincham, L.R., The subjective importance of uniform group delay at low frequencies.
Presented at the 74th Audio Engineering Society Convention (New York, 1983), Preprint 2056(H-1)
5. Fletcher, H., Auditory patterns. Rev. Modern Physics, 12, 47-65 (1940)
6. Carterette, E.C. and Friedman, M.P., Handbook of Perception, 305-319. New York:
Academic Press (1978)
7. Martin, W.H., Decibel - the new name for the transmission unit. Bell System Tech. J., (January 1929)