Andrew R. Collins [Acoustical Mfg. Co. Ltd. (Quad), Huntington, England.]
THE AMPLIFIER is an essential part of any sound reproducing system and it can be argued that the high quality present-day amplifier is the component least likely to degrade the realism of the reproduced sound. However, it is in the nature of things that some amplifiers will be good and some bad, and thus comparing various amplifiers often introduces difficulty.
In general terms, two basic forms of testing are available to us-listening tests and measuring tests. The listening test is useful for assessing background noise level under no-signal conditions and little else. The resolving power of the ear is just not adequate to give any reasonable indication of frequency response, distortion, etc. in the presence of other signals unless the faults in these areas are gross. However, even though such faults are not readily detectable, their presence may give rise to a subtle feeling of unease after a period, and this indicates that these faults are audible but well masked by the program material.
The technical tests are easier to carry out and tend to give more reliable results than the purely subjective interpretations of listening tests. In particular, the measurement of frequency response can be carried out under steady-state conditions with no trouble whatever in about five minutes using an automatic curve-tracer. Distortion measurements in their simplest form are made by feeding the amplifier with a sine wave of high purity, loading the amplifier output with a suitable resistor and examining the shape of the output waveform. The harmonic distortion analyzer is fed with this waveform, a filter in the analyzer removes the original sine wave, and the remaining signal-which has been added by the amplifier-is displayed on an oscilloscope and its magnitude indicated by a meter as a percentage of the total output.
In practice, however, the listener will not use the amplifier for listening to pure steady tones of constant frequency and amplitude. Instead he will listen to a complex musical program made up of an infinite variety of signal frequencies and amplitudes. The inter modulation distortion test attempts to simulate these conditions by feeding the amplifier a mixture of two sine waves, one low frequency and one high frequency. The amplitude of the low frequency component is usually 10 to 20 dB higher than that of the high frequency component. (EDITOR'S NOTE: AUDIO regularly uses the SMPTE test, 60 and 7,000 Hz mixed four to one, respectively.) The inter modulation distortion analyzer examines the effect that the low frequency signal has on the way in which the amplifier operates on the high frequency signal. In effect, the high frequency signal is used as a probe tone to measure the slope of the amplifier's input-output transfer characteristic while the low frequency tone sweeps up and down this transfer characteristic.
Tests of this nature can become more and more elaborate but a limit is set on the complexity of the input signal as the output signal must always be processed by an electronic network that will remove the original signal to enable the contribution due to the amplifier to be examined in isolation. These conventional tests will therefore never tell the whole story about how an amplifier will actually sound when reproducing music, and furthermore the results that are obtained are not easy to interpret. For example, we have no real idea of how low distortion should be before it is no longer offensive.
Again, we have no agreement on the relative annoyance values of 1% third harmonic distortion at 8 kHz against 0.1% seventh harmonic at 1 kHz. Obviously, there are other examples.
To carry out a meaningful distortion test, we must feed the amplifier with the kind of signal it will receive in use and compare the output from the amplifier with the original input by subtraction. We can then listen to the distortion introduced by the amplifier without the masking effect of the music, and this is very useful as the performance of an amplifier under dynamic conditions may be significantly worse than its performance under steady state conditions, particularly in class B transistor amplifiers which have not been subject to the most rigorous design procedures. In such an amplifier a loud passage in the program can cause the temperature of the output transistor junctions to rise considerably even though these transistors may be fitted on an efficient heat sink. The thermal resistance between the junction itself and the cool heat sink prevents the device reaching thermal equilibrium in the short periods under consideration. The junction temperature rises, the base-emitter voltage therefore falls, and the bias conditions for the output stage alter. The failure of amplifier designers to appreciate these changes under dynamic conditions was one reason for the poor audible performance of early class B transistor amplifiers which appeared to give good results when measured under steady-state conditions. It is probably safe to say that five years ago the best transistor amplifiers in mass production were significantly worse than the best tube amplifiers then current, and the serious music listener would understandably eschew the new amplifiers in favor of the proven tube designs.
The situation has now changed, and certain transistor amplifiers are considerably better than the best tube designs, though in some circles prejudice lingers on.
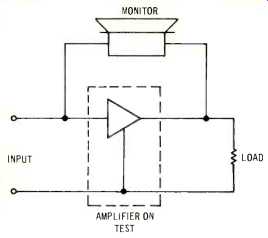
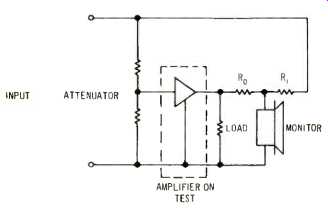
The distortion measurement technique described here allows it to be shown that on any input signal--simple, composite, or musical--the distortion introduced by the transistor amplifier in question is well below audibility at any output level up to the onset of clipping and is 20 or 30 dB less than the distortion introduced by its highly regarded tube predecessor. The basic test setup is shown in Fig. 1, where a unity-gain non-inverting amplifier is tested. The signal on the monitor is the difference between the amplifier input signal and its output signal. Clearly, with an ideal amplifier, this will be zero and no sound will be heard from the monitor. For testing an inverting amplifier which has gain, the circuit is rearranged as in Fig. 2. The input attenuator reduces the input signal to the power amplifier such that its output voltage is the same in magnitude as the input signal to the attenuator. In the ideal case the currents in the two resistors R. and R will be equal in magnitude and opposite in phase, thus no current will flow in the monitor and it will produce no sound. If the amplifier distorts, the current in Ro will differ from the current in. It and a resultant current will flow in the monitor.
In practice the circuit used is more complex than that shown in Fig. 2, as the output from the amplifier is not exactly 180 degrees out of phase with the input at all frequencies and the amplifier gain is not independent of frequency. At the high and low ends of the frequency spectrum, the gain falls and the input-output phase shift alters.
The phase and frequency response characteristics of the amplifier can be measured quite easily by steady-state tests and can be compensated for by adding a completely passive circuit, using only resistors and capacitors, in the reference signal path. The added circuit has the same phase and frequency characteristics as the amplifier on test but, as it is passive, it is completely linear and cannot introduce distortion.

Fig. 1--Basic test set-up for unity-gain non-inverting amplifier.

Fig. 2--Test set-up for inverting amplifier which has gain.

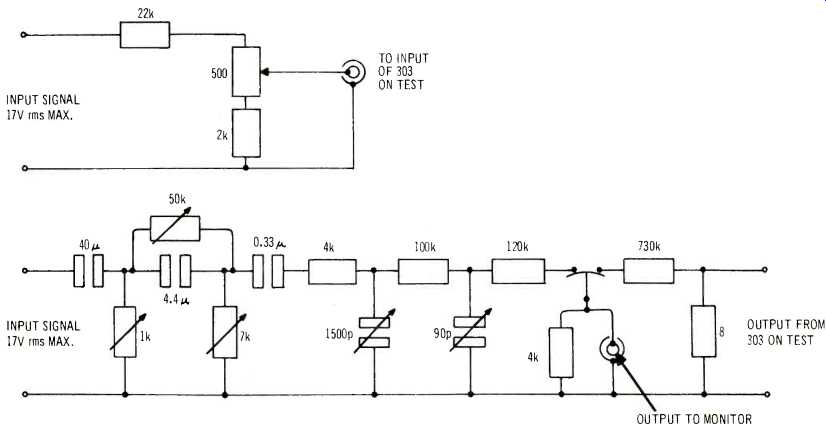
Fig. 3--Input attenuator and correction circuit for Quad
303.

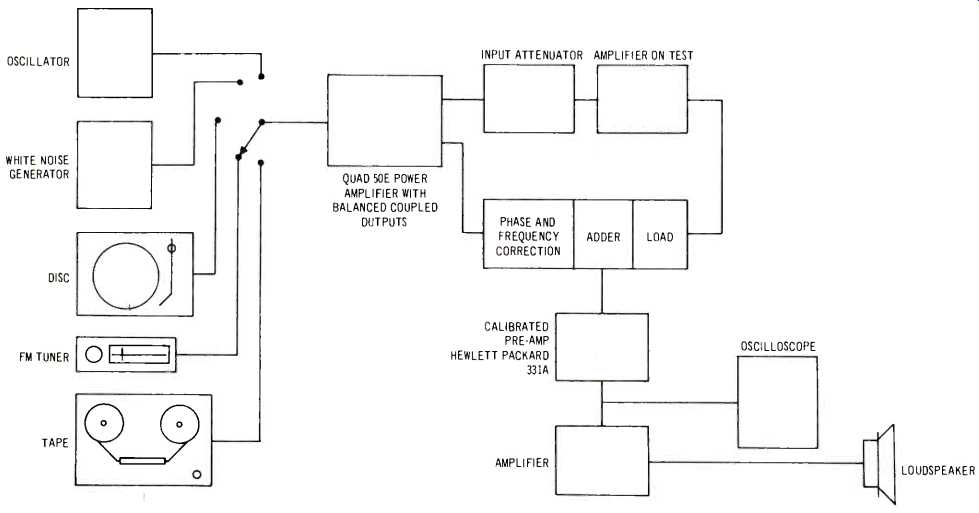
Fig.
4--Complete
test equipment.
By way of example, the complete circuit used for testing the Quad 303 power amplifier is shown in Fig. 3.
The three low-frequency roll-offs in the network simulate the effect in the amplifier of the input and output coupling capacitors and the feedback decoupling capacitor, the two high frequency roll-offs simulate the predominant two high frequency roll-offs in the closed loop. There are five variable controls to allow adjustment of the network to compensate for component tolerances in the amplifier on test. The insertion loss of the input attenuator is variable over small limits; the voltage gain of the amplifier can be between 32 dB and 33 dB and provision must be made for this in the test equipment. The switch fitted on the input to the monitor chain allows the monitor to be fed with the output from the amplifier, the input signal via the R-C network, or the sum of these.
When in use, it is generally found easiest to adjust the variable elements in the R-C network using a white-noise program source. Even then the setting up can be quite time-consuming until experience is gained, as the controls are to some extent interdependent. The monitor chain consists of a high quality calibrated preamplifier with switched gain control feeding a power amplifier and a loudspeaker. As the variable elements are adjusted towards balance, the preamplifier gain is increased to allow more sensitive adjustment. Thus if we wish to examine the distortion products 70 dB below the output level, then the phase response of the network must match the phase response of the amplifier within one minute of arc at all audible frequencies. Similarly the amplitude response of the network must match the amplifier within 0.003 dB at all frequencies. After adjusting the network, a steady signal is applied to the input terminals and its level adjusted to produce an output of 5 volts or so across the load resistor. The monitor switch is set to the "amplifier output" position and the gain of the calibrated preamplifier adjusted so that the voltage delivered to the monitor loudspeaker is also 5 volts. A music signal applied to the input terminals will naturally be reproduced on the monitor loudspeaker at the same level as if this loudspeaker were connected to the output of the Quad 303 on test.
The input signal level is adjusted to reproduce the program at a realistic level. If the monitor switch is now moved to the center position, to listen to the amplifier distortion, the monitor loudspeaker becomes completely silent.
The input level can now be increased to the point where the amplifier overloads and the noises now produced by the monitor loudspeaker are most objectionable.
With the input level set so that the amplifier is just on the verge of overload on the loudest passages, the distortion is still inaudible and it becomes necessary to introduce more gain in the monitor chain. With up to 20 dB extra gain, the loudspeaker is quite silent; with 30 dB gain a signal becomes audible. Listening closely, it is apparent that this is mostly clean program present due to inaccuracies in the R-C compensating network, and it is still relatively undistorted. If the R-C network is patiently adjusted, it is possible to introduce 60 dB of gain in the monitor preamplifier before the signal from the monitor loudspeaker is comparable in loudness to the original signal with no extra gain. The amplifier distortion will now be audible and may still be just detectable with the gain reduced to 40 or 50 dB. Even so, this shows without ambiguity that the distortion introduced by the Quad 303 at any level up to the onset of clipping is 40 dB below audibility. Indeed, if perfection were achieved and the amplifier introduced no distortion whatever, it would sound no different. Looking at the results in another way, by increasing the distortion of a 45 watt amplifier by 40 dB, we are in effect listening to the distortion produced by a similar 450 kW amplifier at its true level.
By altering component values in the R-C network, the test can be applied to any amplifier and has been repeated with the Quad II power amplifier, a tube design which was tried, tested, and accepted by private and professional users during its 15 year production run. This proved to have a distortion content 20 to 30 dB greater than the Quad 303. This background noise level of the Quad II is also higher than the Quad 303 and with no extra gain in the monitor chain, the residual output is just audible.
As the technique is usable regardless of the nature of the input program, it is possible to carry out conventional harmonic distortion measurements using a sine wave generator with a high distortion content. For this application the monitor loudspeaker is replaced with a voltmeter and the "set 100%" function performed by switching the monitor switch to the "amplifier output" position. In the same way the amplifier distortion can be measured on square waves, white noise, and on a swept tone without the need for a tracking filter.
Having shown that one can produce an amplifier that does not produce audible distortion of the program, it may well be realistic at this time to devote some energy to reducing inaccuracies elsewhere in the reproducing chain.
(Audio magazine, Mar. 1972)
Also see:
Intermodulation Distortion: A Powerful Tool for Evaluating Modern Audio Amplifiers (Feb. 1972)
Fail-Safe Audio Amplifier Design (Feb. 1973)
Buying Watts and Other Things (Feb. 1973)
Transient IM Distortion in Power Amplifiers (Feb. 1975)
FTC Power Ratings: An Optimistic View (Feb. 1975)
Amplifier Q's and A's--Mainly For Beginners (Feb. 1972)
= = = =