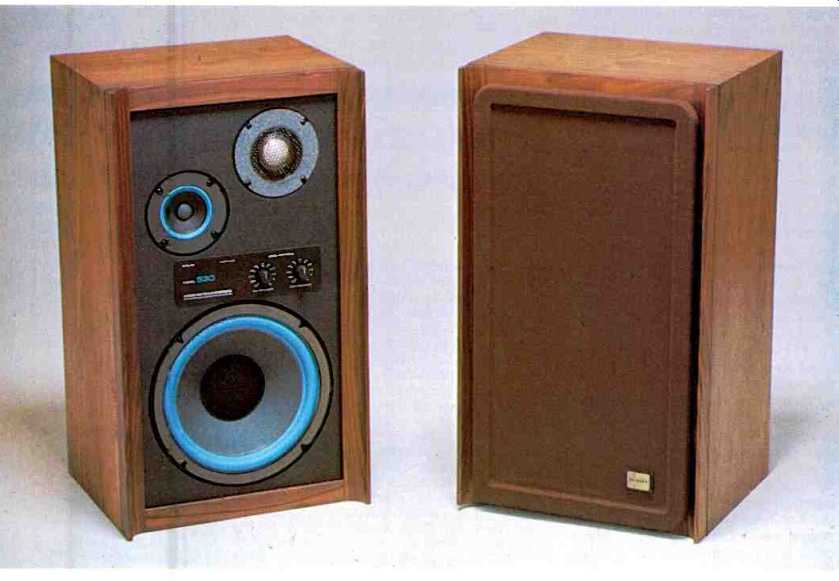
MANUFACTURER'S SPECIFICATIONS
Speaker Complement: 10-in. woofer, 3-in. mid-range, 1 1/2 in. tweeter.
Frequency Range: 27 Hz to 25 kHz.
Impedance: 8 ohms, nominal.
Crossovers: 1&5 kHz.
Dispersion: 170°. Minimum Power: 10 watts.
Maximum Power: 60 watts.
Dimensions: 24 1/2 in. (62.2 cm) Hx 14 in. (35.6 cm) Wx 12 in. (30.5 cm) D. Shipping
Weight: 42 lbs (19 kg).
Price: $189.95 (west of the Rockies $199.95).
The Jensen Model 530 is a three-way loudspeaker system using a 25 cm (10 -in.) woofer, 9 cm (3-1/2 in.) cone midrange, and a 4 cm (1-1/2 in.) dome tweeter. Mounted in an attractive walnut finished enclosure measuring 35.5 cm (14 in.) by 31 cm (12-1/2 in.) by 62 cm (24-1/2 in.), this system reproduces the audio range from 50 Hz to 18 kHz.
The sound may be balanced, to user satisfaction, by means of midrange and tweeter level controls, which are reached by pulling off the front grille. After adjusting these controls, the grille may be re -attached by simply pressing it back in place.
Electrical connection is made to binding posts mounted in a recessed cavity at the rear of the enclosure. Instructions supplied with the system, while not overly detailed, are sufficient to allow proper setup with little chance for mistake.
Technical Measurements
The magnitude of the impedance which the Jensen Model 530 presents to a power amplifier is shown in Fig. 1. In this measurement the two front -panel equalizer controls, which set the middle and high frequency balance, are adjusted to their mid -rotation values. Following a bass rise at 58 Hz, the impedance reaches a second peak near 1 kHz. The lowest impedance is reached at around 10 kHz and lies slightly over 6 ohms.
A polar plot of the impedance for the same equalizer settings is shown in Fig. 2. The nature of this plot indicates a smooth impedance variation throughout the audio frequency range. There is, however, a potential problem which some amplifiers may have when driving this loudspeaker near their peak limit. The phase angle of impedance has a 42 degree lag at 1.8 kHz with a net impedance around 12 ohms.
While this impedance should cause no problems with quality amplifiers, it could possibly trigger the protection circuitry of some amplifiers into audible distress when these amps are driven near their limit on musical material with wide dynamics such as voice and piano. The solution is to use quality amplifiers with the Jensen 530. Measurements made on the frequency response demonstrate that the equalizer controls have a strong influence.
Figure 3 is a plot of the one -meter axial response for three equalizer positions: both at maximum, both at minimum, and both at a halfway position, shown as -10 on the calibrated panel markings. There is very little effect below 1 kHz, but substantial influence above that frequency.
Bass response extends down to 55 Hz, then falls uniformly below that frequency. Midrange is relatively smooth, with a broad peak around 600 Hz, while the response above 1 kHz is most uniform only for the maximum equalizer positions.
Figure 4 is the phase plot corresponding to the maximum equalizer measurement of Fig. 3. The Jensen Model 530 is a three-way loudspeaker system, and the acoustic time delay is different for each driver comprising this system. For this measurement, as with the anechoic test, the microphone is always placed one meter in front of the loudspeaker front panel and directly on the system's central axis. Three measurements were made to show the complete phase response of this system. A time delay corresponding to a path length of 1.028 meters is needed to give the measurement corrected for the tweeter acoustic position. The midrange measurement from 200 Hz to 20 kHz is made with a path length of 1.05 meters. And the lowest frequency needs a path delay of 1.40 meters to yield the phase plot shown here. In short, this means that the sound from the three drivers arrives at the listening location at slightly different times.
The woofer and tweeter are in phase with the voltage waveform, while the midrange unit is shifted 190 degrees. A positive-going speaker voltage applied to the speaker terminal indicated by the red post will arrive at the listening location as a pressure increase when the sound is due to the woofer and tweeter.
The acoustic crossover frequencies are indicated to be around 600 Hz and 11 kHz by this phase measurement. In general, the response due to each driver is of minimum phase type, although the complete system must be classed as non-minimum phase due to the time delay differences.
The three -meter room test is shown in Fig. 5. This is the spectral distribution for the first 13 milliseconds of sound which is heard when the Jensen Model 530 is placed in a room. The physical placement of the speaker for this test is against a wall and raised off the floor by an amount which places the center of the enclosure one meter from the floor.
The measurement position is one meter above the floor and three meters away from the front of the speaker. The room has a floor -to -ceiling height of 2.5 meters, and there's a rug on the floor. No furniture reflections are allowed within the time window of this measurement, which is mathematically changed (apodized) to prevent clipped transients interfering with the frequency measurement. The speaker is placed directly in front of the microphone for one measurement and 30 degrees to the left of the microphone in the other measurement to simulate probable stereo listening locations. Both the tweeter and midrange controls were placed in their maximum clockwise position for this measurement.
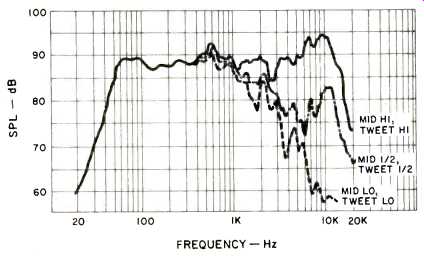
Fig. 3-Magnitude of sound pressure level, anechoic response one meter on
axis with one watt average drive.
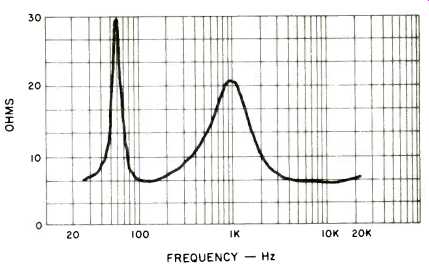
Fig. 1-Magnitude of impedance.
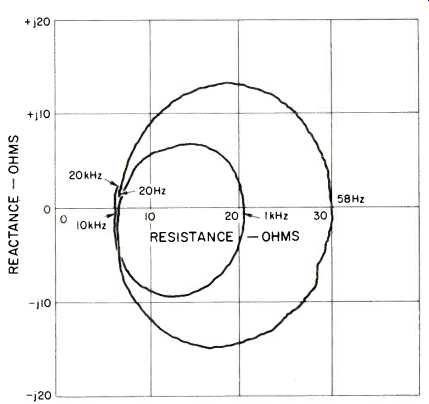
Fig. 2--Complex impedance.
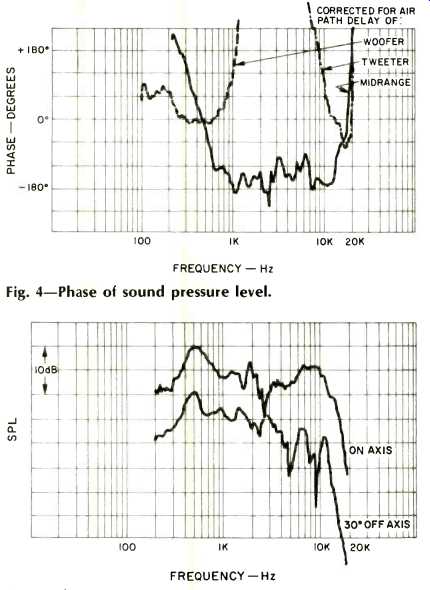
Fig. 4--Phase of sound pressure level.
Fig. 5--Three-meter room response, plots displaced 10 dB for clarity.
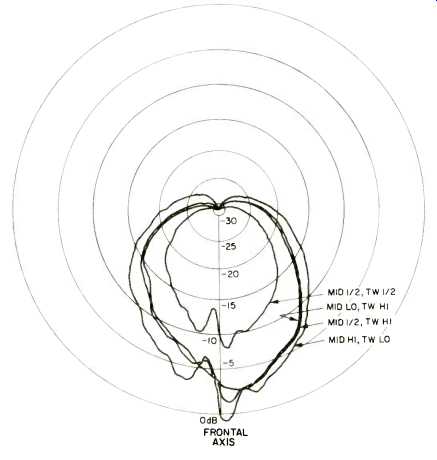
Fig. 6-Horizontal polar energy.
The room response is similar to the anechoic response in that there is an emphasis of frequencies around 500 Hz and 9 kHz. This measurement indicates that the speakers should be rotated toward the listening position for a more uniform balance of high frequency energy.
The polar energy response is shown in Figs. 6 and 7 for the horizontal and vertical dispersion of sound around the Jensen Model 530. This is a measure of the total energy in the full 20 Hz to 20 kHz band, and five equalizer positions were used for each measurement.
The most uniform polar response is obtained with the midrange set Low and the tweeter set to its High position, with other combinations of equalizer position resulting in some polar "fingering" which indicates a change of sound timbre with seating position. The polar measurements verify the suitability of rotating the speakers toward the listening area. The strong upward projection of sound energy indicates that the Model 530 should not be placed immediately beneath a ceiling or shelf that projects beyond the front of the enclosure and this speaker will sound best placed in an open unconfined space.
The measured harmonic distortion for the musical tones E1 (41.2 Hz), A2 (110 Hz), and A4 (440 Hz) is shown in Fig. 8.
This type of distortion is moderately low in the Jensen for the middle and upper tones but rapidly rises with increasing drive power for extremely low bass.
Intermodulation distortion is plotted in Fig. 9 for the effect of E1 on A4, or 41.2 Hz on 440 Hz, mixed one to one. At 10 watts average power, the modulation of A4 by E1 amounts to 4 degrees peak -to -peak phase modulation and 3 per cent amplitude modulation. As with all loudspeakers, there is a small but measurable migration of the cone away from its rest position when signal is applied. This is a d.c. effect which shifts the average position of the acoustic source.
For the Jensen Model 530, the mean average position of the woofer moves inward by an amount corresponding to 4 degrees phase shift of 440 Hz when 10 watts average drive is sustained with combined E1 and A4. Percussive bass will therefore cause a small time smear of the higher musical frequencies carried by the woofer.
A perfect loudspeaker will cause an increase in sound pressure level which precisely matches the increase in electrical drive causing that sound, hence a one dB increase in drive should cause a one dB increase in sound pressure. In the real world, however, no loudspeaker is perfect. This transfer function linearity is measured by starting from a reference level of 0.1 watts and measuring the sound pressure level change as drive power is stepped upward. The amount by which the sound pressure level is greater or less than what it should be at a given power is a measure of transfer linearity.
The musical tones of A2, middle C, and A4 (110, 261.6, and 440 Hz) were used for checking the transfer gain of the Jensen. Relative to 0.1 watt, the gain first increases above unity by a small amount as power increases, then drops below unity for the two lower tones. The higher frequency of A4 (440 Hz) does not behave in this manner but gradually drops in gain with increasing drive. The greatest spread in gain occurs at 10 watts average drive with unity gain for A2, negative 0.3 dB for middle C, and negative 0.8 dB for A4. This indicates there will be a small change in timbre as a function of drive level with higher partials becoming relatively reduced.
In the crescendo test neither middle C nor A4 were changed by greater than 0.5 dB when incoherent signals 20 dB larger were superimposed, even up to peak power levels of 250 watts. Thus, the Jensen Model 530 can be rated as handling massed sounds very well.
The final measurement performed on this speaker is the plot of total sound energy as a function of time following excitation by an impulse. This is the envelope of impulse response, and the measurement is shown in Fig. 10. The equalizer controls were both set to their high position.
The first large peak is due to the sound arriving from the tweeter, while the energy extending out to 4 milliseconds is principally due to the midrange speaker. Some evidence of diffraction scattering is seen in this measurement and this is possibly due to the physically attractive, but acoustically difficult wood structure on the front of the enclosure. An otherwise good transient response appears to be marred by some time delay and acoustic scattering effects.
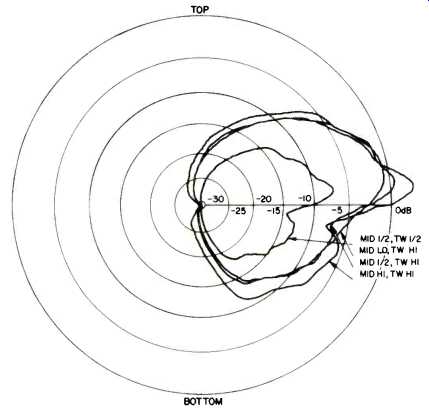
Fig. 7--Vertical polar energy response.
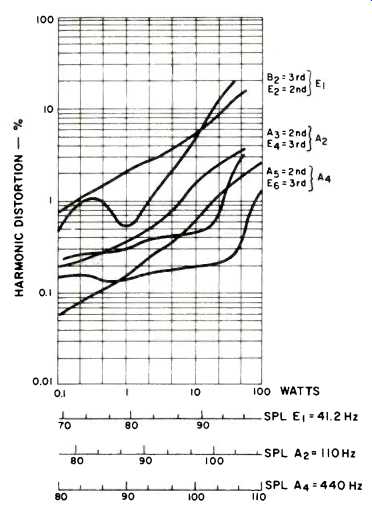
Fig. 8--Harmonic distortion for the tones E1 (41.2 Hz), A2 (110 Hz), and
A4 (440 Hz).
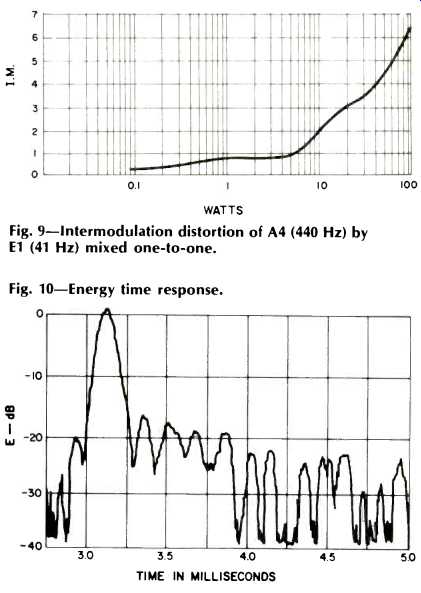
Fig. 9-Intermodulation distortion of A4 (440 Hz) by E1 (41 Hz) mixed one-to-one.
Fig. 10-Energy time response.
Listening Test
The Jensen Model 530 was auditioned against a wall and clear of the floor by about 2/3 meter (2.2 ft). This, to my personal tastes, gave a more balanced sound than other positions I tried.
One problem I found on setting up this system was that both the tweeter and midrange potentiometers were intermittent. Fortunately a standard solution exists-you rapidly rotate the shafts back and forth to burnish off the contact corrosion. This worked with the Jensen, and I recommend it be done as the unit is set up, particularly in this area. Use off-station FM receiver noise, at low level, and listen to the speakers as the pots are turned.
My personal preference on balance was that the midrange potentiometer be set to the mark indicated as -5 and the tweeter set to its maximum position.
My overall impression of the sound of the Jensen was that there was no super low bass, there was coloration at the bottom end, and the top end needed some boost with preamp tone controls. I also found that I preferred having the speakers rotated towards my listening area.
With the human voice, I had the impression that some vocalists were farther back from the stereo stage center than they should be, and I was not particularly pleased with reproduction of the piano, which is, of course, a very difficult instrument to make sound lifelike.
On the positive side, I felt that electronic music sounded pretty good on the Jensen.
-Richard C. Heyser
(Source: Audio magazine, July 1977)
Also see:
Jensen Sound Laboratories (ad, July 1977)
= = = =