Sources:
- Auditory Demonstrations is available from the Acoustical Society of America, 500 Sunnyside Blvd., Woodbury, N.Y. 11797; $20 postpaid.
- Anechoic Orchestral Music Recording is available from Denon, 222 New Rd., Parsippany, N.J. 07054; $52.95 postpaid; Calif. and N.J. residents must include applicable state sales tax.
The readers of Audio are certainly more analytical in their listening than most. There was a time, not too many years ago, when numerous readers were drawn to using test LPs to help align and otherwise optimize their turntable/cartridge combinations. You could always improve the system with a better cartridge, or through better isolation of the turntable and the fine-tuning of tracking and anti-skating adjustments.
The CD ended all of that. You can always get better performance by buying a better CD player or ancillary digital processor, but there are absolutely no adjustments you can make on a given player to improve it. Not even the most expensive CD rings or special conical feet will make any improvement in the performance of a system as stable and internally controlled as digital-to-analog conversion with robust error correction.
There are, of course, many test CDs containing tones and signals intended primarily for use by manufacturers in the design and check-out stages of production. They are also used by equipment reviewers to verify manufacturers' specifications. But the two discs reviewed here are not of that kind. Rather, they are intended to demonstrate and elucidate many of the psychological aspects of how we hear.
The first of these is called Auditory Demonstrations, and it was co-produced by the Acoustical Society of America, Northern Illinois University, and the Institute for Perception Research in Holland. The second disc, Anechoic Orchestral Music Recording, was produced by Denon of Japan.
Both discs are packaged in slip cases, complete with detailed booklets explaining what the tests are all about and what the listener should be alert for. The discs are available only from the manufacturers.
Auditory Demonstrations is based on a set of demonstration tapes produced at Harvard University in 1978.
These were immensely popular and were soon distributed in their entirety.
In 1984, the Acoustical Society of America set about to reissue the material, adding new items where appropriate. A working group--consisting of Thomas Rossing of Northern Illinois University, the Institute for Perception Research, and other interested parties of the Acoustical Society--devoted about three years to the project. All the demonstrations were done anew, and many were digitally synthesized for the lowest possible distortion and background noise. The result is a near-masterpiece. Those of us who have, over the years, heard sine waves on LPs or cassettes have cringed at the effects of noise, flutter, and wow. Here, there is none of that. The performance will be limited only by the noise floor of your living room-and if that is too high, you can always use headphones.
The CD contains 39 demonstrations, and its total running time is 65:25. The major sections deal with critical bands, loudness, masking, pitch perception, timbre, beats, and various binaural effects. All sections except the last can be played over either loudspeakers or headphones; the last, of course, must be heard over headphones for full appreciation. All examples are explained by to-the-point narration.
In this review, I will not cover each test but, rather, will discuss those which, in my opinion, relate most immediately to the listening of recordings at home.
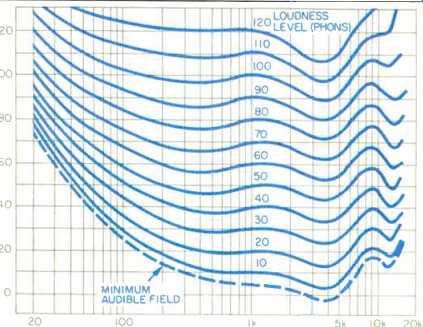
Fig. 1A--Equal-loudness contours, showing how average human hearing sensitivity
varies with frequency and level. (After Robinson and Dadson.)
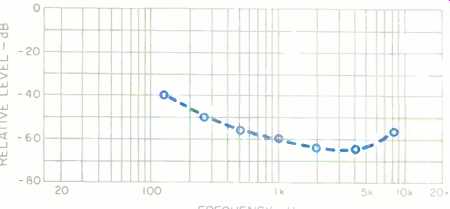
Fig. 1B--Author's response to test of equal loudness near threshold.
Most readers are aware that music played back at low levels sounds bass-shy. The reason for this is explained by subjective loudness contours (Fig. 1A). The contours indicate that at lower levels, low frequencies must be considerably stronger than mid-frequencies if they are to be heard at an equal subjective level. For in stance, at the threshold of hearing, if two tones are to be of equivalent loudness, a 30-Hz tone must be some 50 dB greater in level than a 1-kHz tone.
The basic research in loudness contours was carried out by Fletcher and Munson during the 1930s. Later tests, made in the 1950s by Robinson and Dadson, relate more closely to how we hear in a normal stereo context. In effect, Auditory Demonstrations lets the listener plot his own loudness contours in the region of threshold. The test consists of setting a mid-band reference tone so that it is barely audible. If your listening space is noisy for any reason, use headphones for this test.
Having set the calibration tone accordingly, you then hear "stair stepped" levels going downward in 5 dB increments, beginning at 125 Hz and repeating at 250, 500, 1000, 2000, 4000, and 8000 Hz. You are told to write down the number of stair stepped tones you hear at each frequency. For example, assume that you hear only four steps with the 125-Hz tone and six steps with the 250-Hz tone. This means that your hearing threshold is 10 dB more acute at 250 Hz than at 125 Hz. In fact, this is what most people will hear, and a quick reference to the equal loudness contours (on page 21 of the disc's accompanying booklet) will show that this is the case. Moving on to 500 Hz, if you hear seven steps, your threshold at 500 Hz is another 5 dB more acute than at 250 Hz. And so the test goes.
Typically, there is nothing surprising here. You will probably find that you hear the same as just about everyone else. The real satisfaction you will get from this exercise simply comes from knowing that you have tested yourself and found that you belong in the middle of that big bell curve! My own response to this test is shown in Fig. 1B. My hearing threshold-as observed in my listening room, with its low residual noise floor--fairly matches the lowest contours of the Robinson-Dadson curves in Fig. 1A. In a practical sense, the test tells us that there may be large subjective differences between music played back at a good, room-filling level and the same music played back at low levels.
There are certainly more variations in home listening levels than you would discern between front and rear seats in a concert hall. Accordingly, many manufacturers of preamps and receivers have routinely included loudness controls. These are equalization networks which add bass boost as the playback level is turned down. The correction provided by this is, at best, only an approximation of what might be required, but it is certainly a step in the right direction.
A corollary to this is the bass boost which most people prefer in the automotive listening environment. Here, there is masking due to low-frequency road noise, and most listeners prefer the bass boost simply because it raises the signal above the masking spectrum.
While most of us are in close agreement on what constitutes equal loudness across the frequency band at a given mid-band reference level, we are not all in agreement as to what is meant by the terms "twice as loud" and "half as loud." In general, is has been observed that a 10-dB increase in level will be judged as a doubling of loudness, while a 10-dB decrease in level will be judged as a halving of loudness.
Table 1--Reviewer's response to loudness scaling test.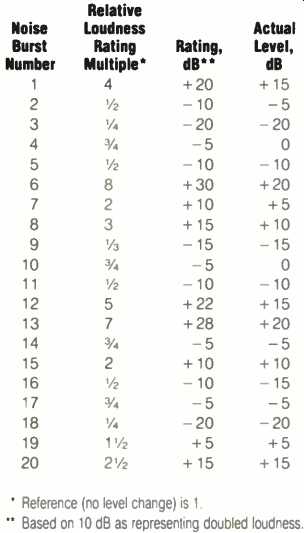
The test presented here consists of 20 short noise bursts. Each burst is preceded by a reference burst, and the listener is asked to make a judgment about the loudness of the test signal with respect to the reference burst. Any convenient grading scale may be used. In my response to this test, I simply judged the test signals, relative to the reference signal, as half as loud, three times as loud, and so forth. The results are shown in Table I. Note that most of my subjective level judgments were within 5 dB of the actual level changes, but three of my level judgments proved to be off by up to 10 dB. There is no special knack in taking such a test, and it is likely that even naive subjects will do quite well. Some evidence suggests that acclimation will improve your overall accuracy, but it is amazing how well listeners agree on what "twice as loud" really means! The total range of levels in this demonstration is 40 dB. In taking this test, you will be impressed by both how loud and how soft those signals can be. In fact, I don't think most listeners would want their music to vary over a range of levels much greater than those presented here. Bearing this in mind, you may wonder if CD's maximum signal-to-noise ratio of 90 dB or greater is truly necessary. As a matter of fact, such wide system dynamic range is necessary, for the following reasons: Even if music itself is normally "contained" within a range of about 40 dB, its softest passages must be heard against a noise floor some 25 to 30 dB lower in order to be realistic. At high levels, another 10 to 15 dB must be available for handling short-term transient signals. This gets us to a requirement of 85 dB, which is not too much less than the range that the CD actually handles.
Stated in a different way, the noise floor of a good concert hall may be about 15 dB (weighted to take the ear's reduced sensitivity to low-level bass into account), and the maximum orchestral peak levels at seats toward the front of the hall may top out in the range of 105 dB SPL (unweighted, as the ear's response is fairly flat at these levels). This is a total range of about 90 dB, and we should be grateful that the system can accommodate it.
Further examples on the disc point out the fact that the ears will "manufacture" fundamental frequencies from an ensemble of overtones when the fundamentals are, in fact, absent. This is the phenomenon which enables us to hear music with reasonable satisfaction even when it is played over a tiny loudspeaker. Related to this is our ability to recognize acquaintances over a normal telephone connection, even though it has little response below about 300 Hz.
Another demonstration shows the ability of the ear to place normal reverberation, or room sound, into context.
Speech samples and a hammer stroke are recorded in an anechoic room (no reverberation), a conference room (slight reverberation), and a highly reverberant space. In the anechoic room, there will be no evidence of reverberation. Even in the conference room, a listener is not readily aware of reverb. But in the highly reverberant space, the listener is quite aware. The three examples are then played backwards. Again, in the anechoic space, the listener is aware of no reverberation. In the conference room, however, the listener is quite aware of reverb preceding the reversed speech signals. And certainly in the third example, the listener is aware of reverberation preceding the reversed speech.
The big difference here is observed in the recording made in the conference room. In real time, the reverberation effects are masked by the direct speech signals reaching our ears first.
We have adjusted to this over time and take no note of it. When the same recording is played in reverse, there is nothing to mask the reverberation component, and it sticks out quite clearly.
The relevance here is to our music listening rooms. We would not want to listen to music or speech in an anechoic room, as a moderate amount of room reflection is desirable. Most of us are hardly aware of any reverberation at all behind the voice of a radio announcer, as reproduced in our listening room. But as the test shows, a reversed recording would show just how much reverb is really there. When we play recorded music, we are largely unaware that our listening rooms are putting "reverberation on top of reverberation," yet that's exactly what is happening.
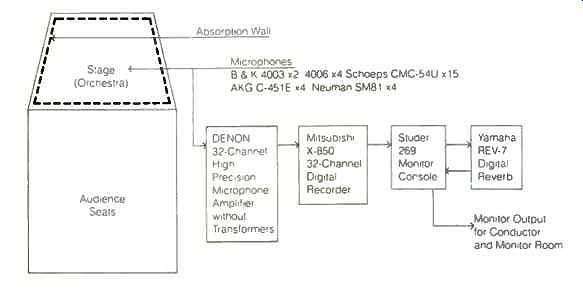
Fig. 2--Setup for Denon's anechoic recording.
The final two demonstrations to be discussed require stereo headphones.
The first relates to perceived directionality at low frequencies. For the most part, our directional cues come from transient and high-frequency information, for which the chief mechanism for assigning directionality is a sound's relative levels at our two ears. At low frequencies, phase relationships provide directional cues, and even continuous sine waves can be localized. In the test on this CD, a 500-Hz signal is presented to the ears, leading in phase by 45° in one ear and then leading by the same amount in the other ear. The listener clearly assigns directionality to the signal with the leading phase. The same experiment at 2000 Hz leads to no such conclusion.
The last example involves the ability of the ears to sort out different signals coming from various directions. In one test, a pulsed 500-Hz tone is heard against a noise floor, both heard only in the left ear. The 500-Hz tone is stair stepped downward in 3-dB steps and the listener is asked to identify the last tone he can hear. Then, the noise signal is switched to the right ear, and the procedure is repeated. This time, the listener can quite easily hear the tone as it is reduced to even lower levels at the left ear, inasmuch as the masking signal (the noise) and the tones are now perceived as coming from different directions. Several variations of this phenomenon are presented.
The relevance here has to do with normal stereo listening. The spatial relationships in stereo help us sort out musical and textural details. In mono, these are often lost, as everything is perceived to be coming from the same direction. Our ability to sort out signals according to direction is one of our best assets-both in the home listening experience and in the concert hall.
The Denon CD, Anechoic Orchestral Music Recording, is the result of successful efforts to create, indoors, an anechoic environment large enough to accommodate a symphony orchestra.
The accompanying booklet describes how the stage of a concert hall was blocked off from the hall itself, and how all wall and ceiling boundaries in the orchestra enclosure were made absorptive; see Fig. 2. The playing is by the Osaka Philharmonic Orchestra, and the musical examples and excerpts are taken from the classical and Romantic eras. Total running time of the disc is 64:58.
As an interesting aside, performing in the anechoic environment was such a difficult task for the players that they were all outfitted with headphones so they could monitor themselves with both direct and artificially reverberated sound during actual recording! Realizing the necessity for picking up a completely "dry" signal which truly represented the section-by-section "power response" of the ensemble, 32 microphones were deployed over the orchestra, and each microphone was fed to a separate track on a digital multi-track recorder.
Ideally, we would want to play back the 32-track tape via 32 amplifiers and loudspeakers, each placed in its appropriate position on stage. In so doing, we would virtually simulate an orchestra on stage, and we could make subjective judgments ad infinitum. Per haps Denon will make the 32-track tape available for such purposes, but in the real world of stereo, a two-channel mixdown had to be made for general application. With some care in set ting up the loudspeakers on stage, many aspects of stage-to-hall transfer characteristics can be measured using this program material. For example, the suitability of a new venue for concerts or symphonic recordings could be evaluated, at least preliminarily, with this disc.
Another section of the Denon disc gives examples of the dry orchestral recording as "treated" to the simulated acoustics of the Vienna Musikvereinsaal, the Amsterdam Concertgebouw, and Boston's Symphony Hall. These examples place the orchestra a little too far in the reverberant field for my taste.
Another very useful section of this disc shows the effects of various stereo microphone philosophies. Enough microphones were deployed so that these techniques could be re-created after the multi-track recording was made. Some of the techniques demonstrated are: Omnidirectional, single point stereo pickup; omnidirectional, single-point stereo pickup with time coherent (delayed) accent mikes; unidirectional, single-point stereo pickup; multi-microphone pickup, and multi mike pickup delayed for time coherence with rear microphones.
For the most part, these examples show only subtle differences. If such a comparison were made in a live recording environment, we would expect greater difference, since these basic microphone arrays respond quite differently to room sound. In any event, there is considerable tutorial value here.
The last section of the Denon disc contains various tones and signals which will be useful in field evaluation of room reverberation and other acoustical characteristics.
The chief value in this disc is, of course, the anechoic examples, and I am surprised that no one has attempted it before. My only quibble is that there was ample room on the disc to have included many examples of chamber music and so on, for evaluating smaller performance and recording venues. Such examples have been recorded before, but I am not aware of any of them having made their way onto CD. The analytical listener will want to acquire both discs. What is to be learned from them goes way beyond just a few listenings. They are a must for any audio educational activity.
-John Eargle
(Audio magazine, July 1989)
Also see:
Test CDs--ESX, Sheffield, and Stereophile test CDs (Jan. 1995)
Telarc OmniDisc Test Record (Feb. 1983)
= = = =