By G. J. ADAMS [B&W Loudspeakers, Worthing, Sussex, England]
Laser interferometry allows for the first time accurate measurement of speaker cone vibrations at high frequencies without any attachments or modifications to the cone.
The loudspeaker industry has always been quick to recognize the usefulness of new measuring instruments and techniques in its struggle to unravel the mysteries of the loudspeaker. This article describes a measuring tool which is new to the industry, the laser interferometer, which for the first time allows accurate quantitative measurements of loudspeaker cone vibration to be made at high frequencies with out the need for mechanical attachments or modifications to the loudspeaker cone. Before describing this new instrument, I would like to present a brief historical background of the invention and development of the moving-coil loudspeaker, together with a simple description of its operating principles and the techniques used previously for the measurement of loudspeaker cone vibration.
Historical Background
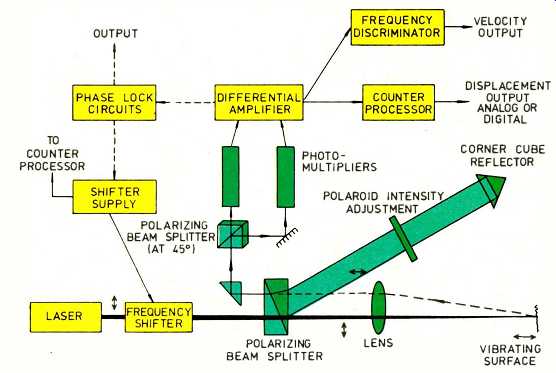
Fig. 1--Block diagram showing the main components of the Harwell laser
interferometer.
The moving-coil loudspeaker driver began its record of commercial success in the early 1920s with the introduction of the Phonetron loudspeaker [1, 2, 3]. This device consisted of a large conical diaphragm supported at its base by a free-standing framework, and driven at its apex by a moving-coil type motor system attached to the same framework.
The Phonetron was followed a few years later by the introduction of the Radiola 104 loudspeaker [4, p. 80] by the American General Electric Co. This loudspeaker proved to be a notable commercial success thanks to the ingenuity of its designers, Rice and Kellogg [5], and their foresight in building into the loudspeaker an audio power amplifier (of about 1 watt maximum output power) to overcome the inherent low efficiency of their direct-radiator loudspeaker. Although the invention of the moving-coil driver can be attributed to a number of the inventors of the late nineteenth century (e.g., Siemens [6, 7], Cuttriss and Redding [8], and Lodge [9]), there is little doubt that Rice and Kellogg were responsible for the first widespread commercial success of the moving-coil loudspeaker driver.
Rice and Kellogg's investigations of the feasibility of constructing an effective "hornless" loudspeaker involved some theoretical work in addition to much experimentation. Their simple theoretical analysis revealed a feature of the moving-coil driver, not mentioned by the inventors, which with correct design enabled a far superior frequency response to be obtained than was achievable with the then-popular moving-iron driven horn loudspeaker. Hunt's clear and concise explanation of this feature [4, p.81] is difficult to improve:
"Sound radiation gives rise to a mechanical resistance to the vibratory motion of a small diaphragm mounted in a baffle; this radiation resistance, and hence the radiated sound power, would increase with the square of the frequency if the vibratory velocity were maintained constant; but the square of the vibratory velocity (on which the sound power also depends) will decrease with the square of the frequency throughout the frequency range above resonance, where the motion of the system is primarily controlled by mass reactance. It follows that if the fundamental resonance of the diaphragm system is made to occur below the lowest frequency of interest, the complementary variation with frequency of the two factors that jointly control the sound output will yield a uniform response throughout the middle range and up to some higher frequencies at which the assumptions begin to fail." This acoustical virtue that Rice and Kellogg recognized and put to work, continues, after a period of more than half a century, to be the basic precept that guides the design of direct-radiator loudspeakers.
Present-day moving-coil loudspeaker drivers show only minor design changes over the original Rice-Kellogg design--a fitting tribute to the ingenuity of these two engineers. Although several other types of loudspeaker driver have been developed commercially, often in an attempt to improve upon the moving-coil driver, the latter still remains the main stay of the loudspeaker industry. Its continued popularity is evident from the vast quantity of loudspeaker cones manufactured each week--one major European manufacturer alone produces over half a million cones per week! Many of the design changes made to the moving-coil driver have been a result of endeavors to improve the uniformity of the sound-output versus frequency response of the driver in the high-frequency range where the assumptions mentioned by Hunt fail. At these frequencies the loudspeaker cone no longer vibrates as a rigid whole, as it does at low frequencies, but exhibits vibrational modes such that different parts of the cone vibrate with different amplitudes and phases with respect to the driving signal (in put voltage). In addition, the radiation resistance becomes dependent on the cone geometry and the distribution of the modes on the cone surface. As a result of these effects the sound output of the driver at different frequencies in the high-frequency range is generally non-uniform--clearly an undesirable feature.
The distribution of the vibrational modes on the cone surface (commonly referred to as the "breakup pattern") is a function of the frequency of the driving signal, the geometry of the cone, and the material parameters (e.g., the density, stiffness, etc.) of the cone. Because calculation of the breakup pattern, and hence calculation of the sound output, of a loudspeaker cone has only recently become possible using high-speed digital computers, the choice of the geometrical and material parameters of a loudspeaker cone to give the most uniform high-frequency response has been largely an empirical art. Loudspeaker de signers have thus spent many hours in the past experimenting with different cone shapes and materials. The technique used to measure performance in these experiments was usually the frequency response taken under free-field conditions using a microphone to sense the sound output and a variable-frequency sine-wave voltage to excite the loudspeaker. However, with the growing interest in the mechanical behavior of the cone in the high-frequency range, workers in the loudspeaker field began to seek and make use of methods for measuring the cone vibration pattern.
Probably the first technique to be used to observe the cone vibration pat tern followed on from the method used by Chladni (in about 1790) to examine the modes of vibration of a glass plate. A sprinkling of fine sand or dust on the vibrating cone migrates to those areas of the cone which show the least vibration [10, 11]. Using sine-wave excitation, any standing waves of sufficient amplitude to disturb the dust are revealed by piles of dust lying at the nodes. Some good examples of the patterns obtained using lycopodium powder are given in [12, 13 and 14]. The invention of the electronic stroboscope provided a rather more convenient method of observing the vibration pattern. Here the cone is illuminated during vibration by an intermittent light source whose frequency is slightly less than, or greater than, that of the driving signal. The mode of vibration is thus revealed to the naked eye as if in slow motion [15, 16]. An example of the result that can be obtained using a stroboscope is given in [17]. Unfortunately, the dust and stroboscope methods are only successful where the amplitude of vibration is reasonably large. Because the vibration amplitude is roughly proportional to the inverse of frequency squared, these methods are usually limited to the observation of the lowest frequency modes only. N. W. McLachlan in his as yet unsurpassed treatise on The Loud Speaker [15] describes several imaginative schemes for measuring vibrational modes of large amplitude including the use of an "acoustic compass" consisting of a small, light propeller suspended on a delicate thread. McLachlan also describes the use of an a.c. bridge for measuring the "apparent" radiation resistance of the cone. This resistance is dependent upon the mechanical behavior of the cone and thus gives some indication of the frequencies at which vibrational modes occur. Unfortunately, this measurement is not sufficient in itself to enable one to deduce the modes of vibration.
Corrington and Kidd [18] made what would appear to be the first serious at tempt to measure the modes of vibration of the cone at high frequencies. Their measurement apparatus consisted of a small capacitor probe positioned just above the point of interest on the cone surface. The capacitance of this probe was made to be a function of the cone displacement by virtue of a coat of con ducting paint given to the rear surface of the cone. The displacement at any point on the cone surface could thus be found by measuring the variation in capacitance of the probe positioned above that point. Using this apparatus, Corrington and Kidd took measurements of the amplitude and phase (relative to the driving signal) at about a dozen points spaced along a radius of the loudspeaker cone.
Nimura and Kido [19] describe the use of a similar capacitance probe to investigate the motion of the cone and the outer suspension at a few points as a function of frequency. They also de scribe the investigation of the sound-pressure distribution over the surface of the loudspeaker cone using a probe microphone in an attempt to identify the modes of vibration.
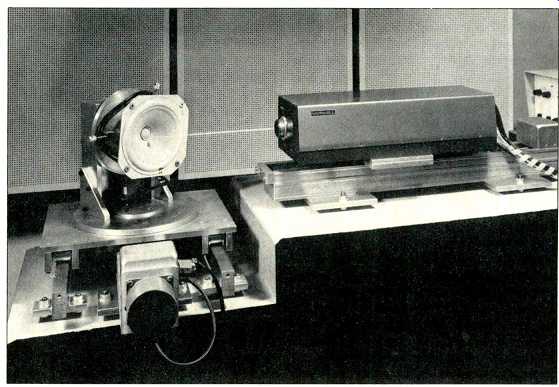
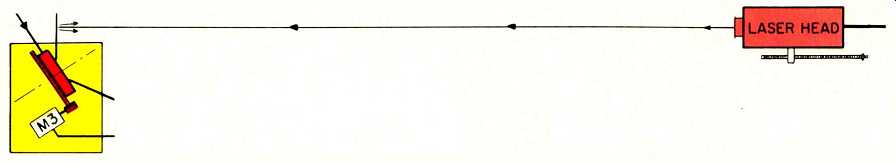
Fig. 2--The laser head and the loudspeaker driver under test are firmly
mounted onto a concrete block. The latter is mounted on vibration isolators
to reduce the transmission of ground vibration noise to the measuring system.
In the early 1960s Yorke [13] constructed an ingenious apparatus for measuring the cone displacement at a point using a small rectangular light beam. The beam was directed at the point of interest on the cone surface in such a way that it was reflected off the surface into a beam splitter. The two output beams of the beam splitter were directed onto photocells whose electrical output signals were subtracted to yield a voltage dependent on the cone displacement. To facilitate speedy and consistent positioning of the light spot on the cone surface, Yorke constructed servo motor systems to control the radial spot position and to control the distance between the light source and the cone surface. The latter control was made to be automatic such that the sum of the photocell outputs was always optimized.
Thus, as the light spot traversed across the cone, the light source and photocell assembly automatically "followed" the shape of the cone surface. Using this apparatus, Yorke took measurements of the amplitude and phase at 18 points along a radius of a 12-inch diameter loudspeaker cone as a function of frequency. Although Yorke's apparatus was the first to enable quantitative measurements of cone vibration to be made without the need to treat or modify the cone surface in any way, it was unfortunately only effective for frequencies up to about 4 kHz due to S/N limitations.
Measurement of the cone displacement becomes more difficult as the frequency of the driving signal is increased because under mass control the displacement amplitude varies inversely with the square of the frequency. The difficulty of making displacement measurements at high frequencies was partly overcome by using holography to record an image of the cone breakup pattern [17, 20, 21, 22, 23]. In one technique the whole of the cone is illuminated with laser light such that the light reflected from the vibrating surface falls on a photographic plate. By also illuminating the plate with part of the incident beam, a continuously changing interference pat tern is exposed on the plate (over a period of several seconds). After development, the plate, or "hologram," can be viewed in laser light to reveal a time average of the interference pattern. Cone parts at rest (e.g., nodal lines or circles) appear light, while those parts in motion appear dark. Because the wavelength of laser light is very small (e.g., about 0.6 µm for a helium-neon laser), the holographic technique enables measurement of displacement amplitudes down to the order of 1µm. This degree of sensitivity means that vibration patterns for frequencies extending above the audible range can normally be obtained. The only major drawback of the holographic technique is the difficulty of obtaining quantitative data of the displacement amplitude from the hologram. While this is possible in theory [21], the correct estimation of the amplitude of displacement at any point relies on one's person al interpretation of the contrast between the light and dark areas surrounding the point. The estimates are thus open to some doubt.

Laser Interferometry
The desire of the B&W research department to make quantitative measurements of the amplitude and phase of the cone vibration at high frequencies was satisfied in 1978 by the purchase of a vibration interferometer developed and built by the Atomic Energy Research Establishment at Harwell, England [24,25].
This device also makes use of the interference of laser light but differs considerably from the holographic technique in its principle of operation. A simplified block diagram of the measuring system is shown in Fig. 1. A polarized light beam from a low-power (about 5 mW) helium-neon laser is passed through an electro-optic frequency-shifting device and a lens onto the point of interest on the loudspeaker cone's surface. Scattered light from the cone surface is collected by the same lens and is mixed with a reference light beam derived from the main light beam. The mixed beam is then converted to an electrical signal by a pair of photomultipliers. This electrical signal is in turn fed to a frequency discriminator whose electrical output signal is dependent on the velocity of the cone surface. The electro-optic frequency-shifting device is a type of Kerr cell [26] which allows most of the light passing through the cell to retain its original polarization and frequency, but in addition generates a component whose polarization axis is at 90 degrees to that of the main beam and whose frequency is shifted. This component, which is about 5 percent of the total, is separated from the main beam using a polarizing beam splitter to form the reference beam. The intensity of the reference beam can be controlled by a rotatable polarized plate in the path of the reference beam. An intensity of five to ten times that of the scattered light is generally found to give the best results. The scattered light and the reference beam when recombined have orthogonal polarizations and thus they will not interfere directly. This problem is solved by directing the mixed beam at a polarizing beam splitter whose axes are at 45 degrees to the polarization axes of the scattered light and reference beam components. The two outputs of the beam splitter both have components of the scattered light and the reference beam which are polarized along the same axis, and thus interference occurs in these output beams. The resulting interference signal components in the two output beams differ in phase by 180 degrees. This effect is used to advantage by converting the two output beams to electrical signals using two separate photomultipliers (see Fig. 1) and then subtracting these electrical signals using a difference amplifier to form the input signal to the discriminator. The balanced arrangement so formed has the advantage of being less sensitive to fluctuations in the intensity of the beams than a single detector arrangement.
In normal operation of the interferometer, a constant shift in frequency of about 5 MHz is applied to the reference beam. When the cone surface is stationary, the scattered light and the reference beam differ in frequency by the value of the shift frequency only. The output of the difference amplifier thus contains a 5-MHz beat signal arising from the interference of the scattered light and the reference beam. If the cone surface is in motion, the frequency of the scattered light is frequency modulated as a function of the surface velocity because of the Doppler effect. This modulation of the scattered light gives rise to modulation of the 5-MHz beat signal output from the difference amplifier. Conversion of the frequency of the beat signal to a corresponding voltage (by the discriminator) yields a signal voltage which is proportional to the velocity of the illuminated part of the cone surface.
The use of a constant shift in the frequency of the reference beam enables the interferometer to sense the direction in which the cone surface is moving (i.e, away from or towards the light source).
Without such a shift in frequency, the velocity output waveform from the discriminator would appear as if it had been "full-wave rectified." The ability to sense the direction of movement of the surface also enables the displacement of the cone surface to be obtained by counting the cycles of the beat frequency and the cycles of the shift frequency and finding their difference by subtraction. The sub traction can be done virtually continuously and the difference converted to an analog voltage. In the Harwell system the "zero crossings" of the cycles are counted, and thus the limit of resolution of the measuring system is about a quarter of the wavelength of the laser light, i.e. about 0.16 µm for a helium-neon laser.
Mechanical Considerations
Meaningful measurements of displacements as small as 1µm or less can only be obtained if the laser source and associated optics and the loudspeaker driver under test are solidly mounted onto a common base. Where only velocity measurements are of interest, the mounting requirements are somewhat less important, although the use of a sol id base does offer some improvement in the signal-to-noise r output signal by virtue of the increased positional stability of the scattered light relative to the laser.
The main optical components of the Harwell laser are mounted in a head assembly measuring approximately 150 mm square by 500 mm long. The electronics and power supplies required are mounted in a separate housing connected to the laser head via several meters of cable. A solid base for the laser head and loudspeaker was constructed by casting a block of concrete approximately 0.5 m square by 1.3 m long. A number of lag bolts were set into this block during the casting process to enable firm fixing of the laser head and loudspeaker.
To isolate the block from ground vibration noise, the block is positioned on vibration isolators whose stiffness was selected to give a resonance with the mass of the block of about 10 Hz. Figure 2 shows the completed block.
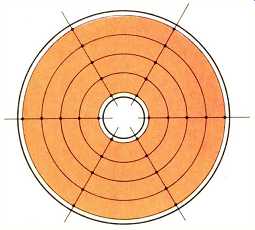
Fig. 3--A grid of points on the cone which can the motion is to be
measured be conveniently defined by a set of imaginary radial lines and
concentric circles.
Both the laser head and the loudspeaker driver are mounted onto the block via precision lead screw-type slide assemblies in which the lead screws are by stepping motors. These slides allow adjustment of the laser head-to-cone surface distance and the radial position of the point of illumination on the cone surface. The former adjustment is required for focusing of the laser beam;
this adjustment is not critical within a few centimeters and is thus normally re only at the commencement of taking a set of measurements. The circumferential position of the light spot on the cone surface is made easily adjustable by mounting the loudspeaker driver onto the radial slide assembly via a rotary positioning table. The latter is also controlled by a stepping motor. The rotary table is provided with a three-jaw chuck-type of arrangement to enable drivers of different shapes and sizes to be clamped in position with little effort.
The maximum driver diameter that can be accommodated is about 350 mm. The mounting base of the rotary positioning table is provided with a rotary adjustment about a vertical axis so that the part of the cone surface which is under examination can be placed approximately at right angles to the incident laser beam. This ensures that the scattered light is directed mainly back towards the laser head, and that the measurements of displacement or velocity taken are the transverse (i.e., perpendicular to the cone surface) values of these quantities.
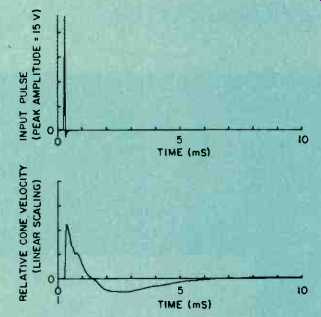
Fig. 4--The input voltage pulse, top, applied to the loudspeaker and the
output voltage pulse of the interferometer measured at one position on
the loudspeaker cone.
Interface to Computer
The system described so far enables the motion at any point on the cone surface to be measured as a function of the excitation (or driving signal) applied to the voice-coil of the driver. Where the cone surface motion is of interest at discrete frequencies, the driving signal can be a sine-wave voltage. At any particular frequency the cone breakup pattern can be observed by noting the variation of the amplitude of the cone motion as the point of illumination is moved over the cone surface. To make a more thorough investigation of the cone behavior re quires that the motion be measured and recorded at a number of discrete frequencies for each of several positions defined by, for example as shown in Fig. 3, the intersections of imaginary radial lines and concentric circles drawn on the cone surface. This type of grid is convenient because the point of illumination on the cone surface can be moved along a line or circle by driving the motors of the radial slide assembly or the rotary positioning table respectively. The spacing of the lines and circles defining the grid defines the "resolution" of the measured breakup pattern; thus complicated breakup patterns require a finer spacing for good definition than do simple breakup patterns. Because the complexity of the breakup pattern generally increases with increasing frequency, the minimum number of measurement positions required to correctly define the cone motion will depend on the highest frequency of interest. By way of example, a 16-cm diameter paper cone would probably require about 300 measurement positions for frequencies up to about 3 kHz. Bearing in mind the need to repeat such a number of measurements for each discrete frequency of interest, it soon becomes clear that the quantity of data to be recorded can be come rather excessive. This is where the computer proves to be an invaluable aid to the measurement system.
The PDP-11 computer system in stalled at the B&W research department is equipped with data acquisition facilities together with the software required to enable the measurement and storage of time-varying voltages. Both the input voltage to the loudspeaker voice-coil and the velocity output voltage of the laser measurement system are interfaced to the computer system. Simultaneous acquisition of the input and output signals is possible for a sampling rate of up to 50,000 samples per second. Measurement and storage of the cone breakup pattern by the computer can be carried out using sine-wave excitation as described previously; however, the time taken to store measurements for a large number of frequencies can be reduced considerably by measuring the velocity impulse response at each position on the cone surface. This single measurement contains information about the amplitude and phase of the cone surface motion at all frequencies. A modified form of this impulse response can be measured by exciting the loudspeaker with a narrow (10-25 µS wide) rectangular input voltage pulse, as shown in Fig. 4. Both this input pulse and the velocity output pulse of the measuring system are sampled and stored in the computer. The transfer function between the input voltage to the loudspeaker and the cone surface velocity can then be found by transforming the pulses to the frequency domain using a Fast Fourier Transform (FFT) pro gram installed in the computer, and performing a division of the output pulse spectrum by the input pulse spectrum.
To improve the signal-to-noise ratio of the measurement technique, the input pulse can be repeated (at a rate of, say, 1 Hz) and the output pulses measured and stored as an average in the computer. If n pulses are averaged, any random noise present in the pulse signal is reduced by a factor of relative to the main signal content.
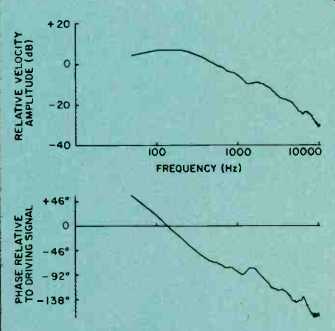
Fig. 5--The amplitude-frequency response and the phase-frequency response
of the cone velocity calculated from the pulses shown in Fig. 4 using an
FFT computer program.
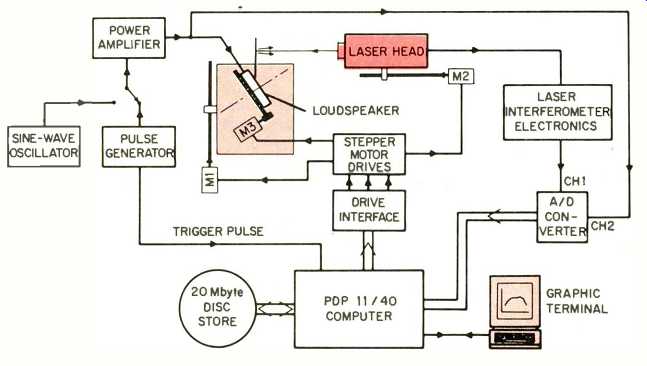
Fig. 6--Block diagram showing the main components of the complete measuring
system. The input voltage applied to the loudspeaker and the velocity output
voltage of the interferometer are interfaced to the computer via an analog-to-digital
converter. The stepping motor drives, controlling the position of the point
of illumination on the cone surface, are also interfaced to the computer
to enable them to be controlled by a computer program.
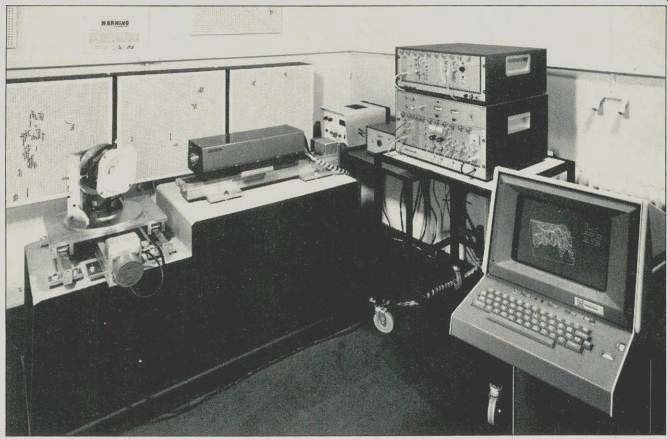
Fig. 7--The complete laser interferometry system, from left to right,
includes the loudspeaker and the laser head mounted on the concrete block,
the stepping motor drives and interface, the interferometer electronics,
and the computer terminal.
The FFT program produces frequency response data at a number of discrete frequencies determined by the number of samples of the input and output pulses which are stored and then trans formed to the frequency domain. The considerable time-saving advantage gained by using a computer to measure and store the frequency response data can be seen from the following example.
Figure 4 shows the averaged input voltage and output voltage pulses of the measurement system taken for one position on a loudspeaker cone. The pulses were sampled at a rate of 50,000 samples per second for 1024 samples and were repeated at a rate of about one per second for just over half a minute. During the following minute the FFTs were performed, the division carried out to determine the transfer function, and the amplitude and phase of the cone surface velocity calculated and displayed on the computer terminal for over 500 discrete frequencies.
Figure 5 shows the calculated amplitude and phase responses at different frequencies that are obtained from the pulses shown in Fig. 4. The values of the amplitude and phase calculated at each discrete frequency are stored in the computer (on a magnetic disc) for use at some later date.
The positioning of the point of illumination on the cone surface can be carried out by manual control of the step ping motor drives. While this is satisfactory when only a small number of positions are to be investigated, the task becomes rather laborious for large numbers of positions. To ease this task, an interface between the stepping motor drives and the computer was construct ed. This enables the three drives control ling the focusing and the radial and circumferential movement of the point of illumination to be controlled by software statements, which can be executed directly by typing them into the computer terminal or can be included within a computer program. Thus, for example, a program could be written to acquire a number of input and output pulses at one position, compute and store the transfer function for this position, move the point of illumination a certain distance in a radial direction, compute and store the transfer function for this position, and so on.
A block diagram showing the main components of the measuring system and the interface to the computer is given in Fig. 6. The complete measurement system and interfaces are illustrated in Fig. 7. The interfaces and the computer terminal are connected to the computer which is located in a nearby room.
In the second and last installment of this article, I will cover some analysis of the displays of the breakup patterns, distortion, and calculation of the sound-pressure response. References will be given at the end of the article.
(adapted from Audio magazine, Aug. 1981)
= = = =
Also see:
Measuring Speaker Motion With A Laser--PART TWO (Sept. 1981)
KEF 105 Series II Loudspeaker (Feb. 1982)
The Roots of High Fidelity Sound (June 1981)
Build A High Performance THD Analyzer Part 1 / 2 (July/Aug 1981)