MANUFACTURER'S SPECIFICATIONS:
Oscillator:
Output Voltage: 1.2 V.
Level Deviation: ±0.2 dB.
Distortion: 0.3 percent, less than 0.01 percent at 400 Hz for THD tests.
Frequencies: 21 steps from 20 Hz to 20 kHz.
Frequency Accuracy: ±2 percent.
Pink Noise Output: 20 Hz to 20 kHz, ±2dB
Output Impedance: 600 ohms.
Level Measurement:
Range: -80 dBV to +30 dBV.
Frequency Response: 20 Hz to 20 kHz, ±0.3 dB.
Display Ballistics: VU or peak, select able.
Wow & Flutter Measurement:
Input Range: 3 mV to 30 V.
Indication: DIN peak.
Test Signal: 3000, ±4.5 Hz.
Speed Range: ±3 percent.
Distortion Meter:
Test Frequency: 400 Hz.
Input Range: 0.1 to 30 V.
THD Range: 0.01 to 3.0 percent.
Noise Measurement Weighting: IEC A.
Range: -100 to -10 dBV.
Dimensions: 13 1/2 in. (34.3 cm) W x 3 in. (7.5 cm) H x 9 1/2 in. (24 cm) D.
Weight: 9.5 lbs. (4.3 kg) .
Price: $800.00
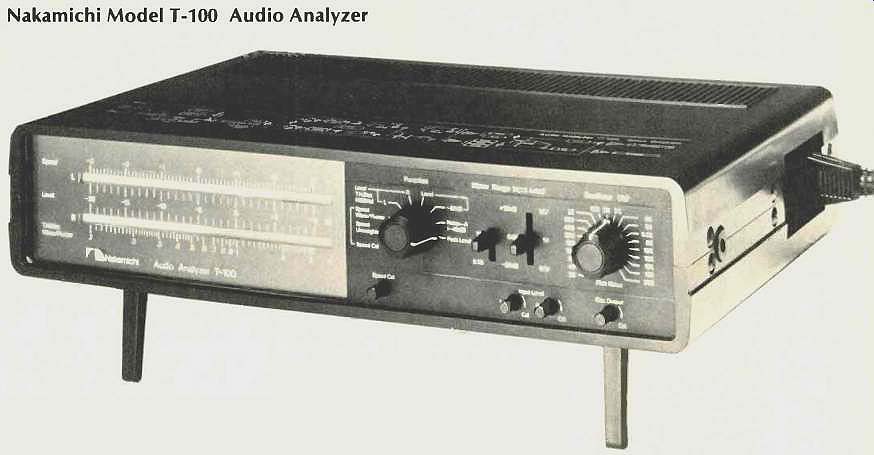
The Nakamichi T-100 audio analyzer provides a well-thought-out combination of audio test capabilities in a compact package. It is best to examine the unit when turned on, for then the two parallel bar graphs will be illuminated (with input signals). One is immediately struck, not just by the novelty, but by the great ease in reading the orange bars against the horizontal 4.5-in. scales. The topmost scale is for tape speed, from -3 to +3 percent. The middle level is in linear dB from -20 to +10 dB, and it applies to both top (L) and bottom (R) bar graphs. The bottom scale is for THD and W&F in percent and for signal level in volts, and it is scaled from 0.1 to 3.2, with 1.0 at 0 dB. The selectable functions are:
Speed Cal, Speed (L), and Unweighted W&F (R), Speed and W&F (Wtd), left channel Level and THD (400 Hz), right channel Level and THD, Level (both channels),-20 dB level, Noise-A (40 dB reference), and Peak Level. In the Speed Cal position, a multi-turn adjust pot on the front panel is used to set zero reference to any source or tape playback as desired.
The meter range switch adds 20 dB of gain in the 0.1 percent position, relative to the reference 1 percent position. The input level switch decreases gain by 20 dB in the 10-V (+20 dB) position and increases gain 20 dB in the 0.1 V (-20 dB) position. Multi-turn input level pots allow setting peak levels for lower indications as desired, but the pots are inoperative in other positions of the function switch, a good way to keep from putting the instrument out of calibration with other switch settings.
The oscillator has a total of 21 step frequencies: 20, 40, 63, 100, 160, 250, 400, 630, 1k, 1.5k, 2k, 3k, 4k, 5k, 6.3k, 8k, 10k, 12k, 15k, 18k, and 20 kHz. Most of the steps are at specific ISO-recommended 1/3-octave center frequencies. There is no complaint about not having each and every one of them, but my own preference would be for added steps at the lower end, dropping out a couple in the middle. The inclusion of a pink-noise source is sizable plus for the T-100, much more useful than discrete tones for listening checks. The oscillator output level can be lowered from its calibrated setting with a front-panel multi-turn pot.
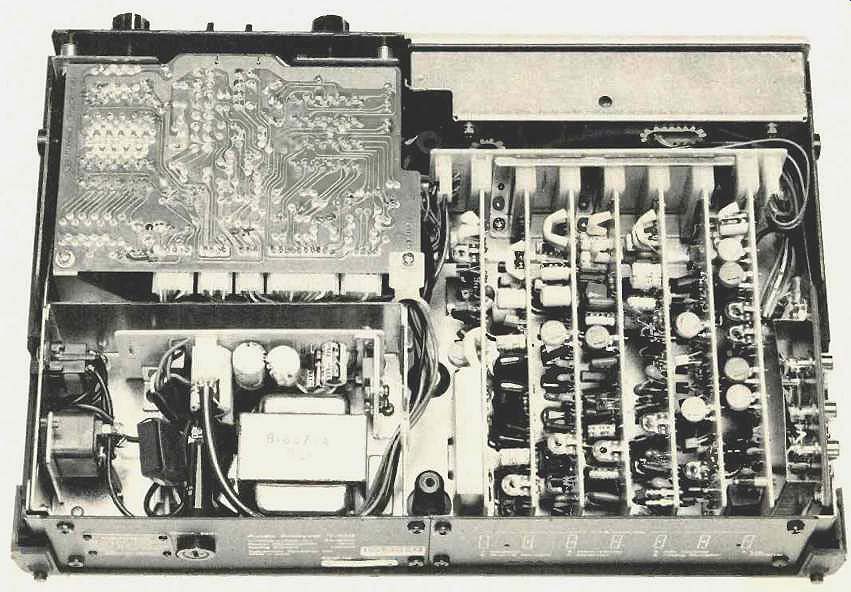
The top of the high-impact plastic, wrap-around case has a block schematic for handy reference. Near the back on one side are the left and right channel inputs, the paralleled out puts and the two scope connections, all phono jacks. On the other side is the power switch and the socket for the detachable cord. Feet on the bottom of the case can be swung down to tilt the front of the T-100 upwards for better viewing. Gaining access to the interior was straightforward, but it is not recommended to the curious. Soldering and wiring were excellent with all connections very neat. Construction was compact with shielding used in a number of places. A shoulder-carry strap facilitates transporting the unit in its case, which has space for cables.

------------ Inside, bottom view

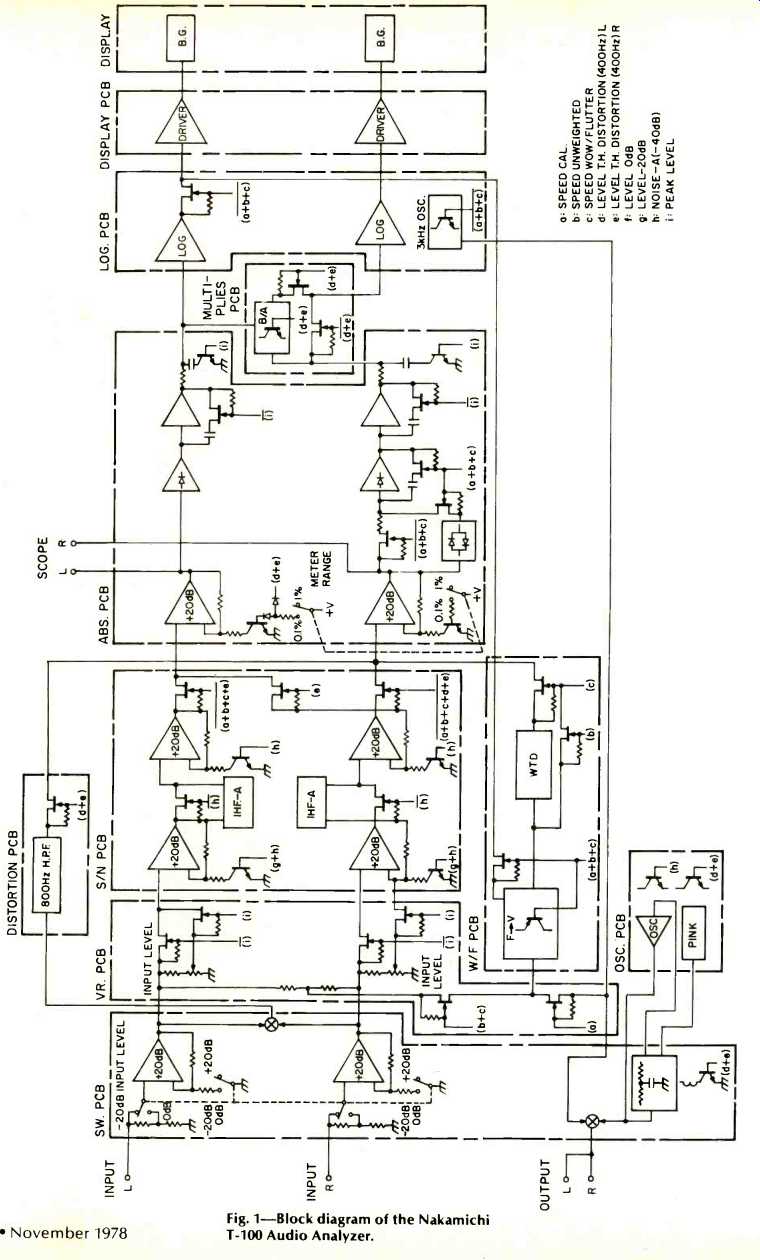
Fig. 1-- Block diagram

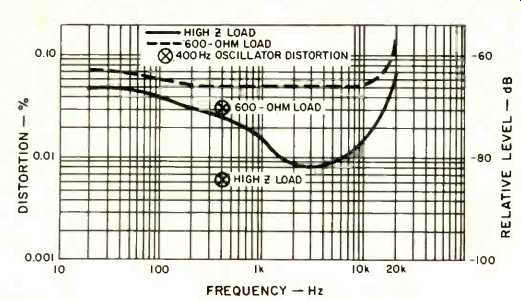
Fig. 2--Oscillator THD vs. frequency with high-Z and 600-ohm loads.
Performance
All of the oscillator step frequencies were within 1 percent of setting with the exception of 20k which was 1.8 percent low (19.648 kHz). The majority of steps were within 0.3 percent, which is excellent and much better than the 2 percent specification. The output level was constant within 0.1 dB in most cases with a gentle increase with frequency, up 0.15 dB at 15 kHz and above. The maximum output was 1.2V, as specified, 0.6V with a 600-ohm load (the expected result with a 600-ohm source impedance). With 1.000 V in, the L bar graph was slightly low, 0.98 V, and the R display was as close as could be read. At the low-frequency end, the indications reached a "peak" of +0.2 dB at 6 Hz, with some following of the waveform. The metering was not down 1 dB until 1.5 Hz with-3 dB at 0.8 Hz, with the slow amplitude cycling easily observed. At the high end, the display was flat within 0.15 dB out of 60 kHz and 1 dB down at 90 kHz. This is outstanding performance, heightened by the fact that the two bar graphs matched each other exactly. The extended low-end response was superb, one of the best ever observed.
THD was measured for the oscillator at each of its step frequencies and with the switch set for THD tests. The use of a spectrum analyzer revealed certain operating conditions as being requisite for best results. It was determined, for example, that distortion for the step-frequency oscillator was much lower with a high-impedance load, although it was still within spec with a 600-ohm load. The 400-Hz oscillator for THD checks had distortion products of 0.006 percent at most with high-Z load, but 0.03 percent with 600 ohms on the output. The other observation was that 60 and 180 Hz from the power supply were at low level (less than 0.03 percent) and were eliminated with the ground pin lifted. The THD function was very convenient with its auto-level feature. An input level of 50 mV was quite sufficient to measure a case of 0.017 percent THD, markedly less than the specified 100 mV minimum. The pink noise output was 0.95 V on a wide-band meter. The majority of the spectrum was within ± 1 dB on the 40 Hz to 16 kHz RTA display, with just a couple points a fraction of a dB higher. The spectrum was consistent with changes in output level and loading, adding to the excellent performance.
In Level, the two bar graphs were not quite a dB low with 300 mS bursts with frequencies anywhere from less than 5 Hz to greater than 40 kHz, basically meeting the VU meter standards. In Peak, the same indication was obtained with a 8.5 mS burst, accompanied by a two-second fall time, excel lent for music. Slightly longer burst times obtained full indications. The output control and peak level pots provided a total of 40-dB attenuation with about 10 dB in the first half (about five turns CCW) adjustment from Cal (maximum).
This aids in accurately setting to the levels most likely to be encountered.
The bar graph segments were each 1/3 dB, but it was possible to read consistently to about ± 0.1 dB by noting the intensity of the topmost segment. The design had inherently lower parallax than needle meters. The performance of the log converters and the attenuator/gain changes was shown to be outstanding with a maximum discrepancy of 0.2 dB from +20 dBV (10 V) to -100 dBV (10 microvolts). In the switch from Level to -20 dB, the oscillator/pink noise output was simultaneously switched an exact -20 dB. Clipping as seen at the scope output occurred at 5 dB above F.S. and was about 9.2 V p-p at that point. The input impedance for each channel was 560 kilohms, constant across the audio band.
The output in W&F was 3000 Hz on the nose, but 3150 Hz would have been more in keeping with the weighted-peak spec. The speed indication was within 1 Hz anywhere on the display, for a maximum error of 0.03 percent. The response curves were completely to standard, usually within a fraction of a dB. Measurements were possible to the maximum meter indication (30V) and down to 1 mV with 0.1 percent flutter, to less than 3 mV with 0.01 percent, very impressive performance. The A-weighting curve switched in at -40 dB met the tolerances for ANSI Type I precision sound level meters from 315 to 16 kHz and was still very good at lower frequencies.
It was interesting to check test setups against the block diagram for the T-100. The imaginative use of FET switches and their logic control is judged to be a good feature of the analyzer that could contribute to long-term reliability.
In-Use Tests
The Nakamichi analyzer was used for a number of tasks and performed very well each time. The bar graph displays were very easy to use, judged to be rugged and quite superior in use to needle chasing, particularly with fluctuating signals. Having two channels, one above the other, facilitated a number of tests, run with great difficulty in the past. Tracking of pots, for example, could be checked over 60 dB or more with just two level switches. The job of checking machines for Recording for the Blind was not only more efficient, but easier on the back. The easy-carry T-100 replaced the oscillator, the pink-noise source, the level meter, and the wow and flutter meter, plus adding the THD capability. Because of noise in the tape recording process, it was not possible to obtain any benefit from the low-distortion properties, but the auto-level operation was a great time saver.
Although the T-100 does not match the very best of the low-distortion oscillators, the THD is less than 0.1 percent across the band with high impedance loads. Spectrum analysis may be necessary to check very low-level distortion, as a regular HD meter may respond to ground-loop effects. For checks at one frequency, the THD tests at lower distortion 400 Hz should reveal if an equipment problem is developing.
The knobs on the level pots are very small, but adjustment may be a sometime thing, and the multi-turn construction allows very accurate setting.
The instruction book gives detailed information on per forming tests on various types of equipment, with the emphasis on tape recorders. Data sheets are provided for plot ting results. A display overlay is also included which has scales for voltage and power across 8 ohms, up to 100 watts.
The Nakamichi T-100 audio analyzer is truly synergistic, providing a number of inter-related signal generation and measurement functions in one compact, convenient pack age. The output is single-ended, and the levels are slightly low for some professional uses, so high-impedance loads should be the rule. The excellent performance should be of interest to serious audiophiles who want to acquire test instrumentation and to professionals where its constraints are not limiting. The price tag makes the unit quite acceptable to touring bands, small studios, and others who need such an all-in-one unit.
-Howard A. Roberson
(Audio magazine, Nov. 1978 )
Also see:
Nakamichi NR-100 Dolby C Noise Reduction Processor (Aug. 1982)
Nakamichi cassette decks (Dec. 1982)
Realistic Sound Level Meter (Nov. 1978)
Leader Model LBO-301 Oscilloscope (May 1973)
= = = =