MANUFACTURER'S SPECIFICATIONS
Frequency Response: 38 to 20,000 Hz ± 3 dB, down 10 dB at 28 Hz, free field. Dispersion: 180° at 10 kHz. Impedance: 8 ohms. Drivers: 12-in. woofer, 5-in. midrange, 3/4-in. tweeter, two angled 2-in. super tweeters. Crossover Frequencies: 700 Hz, 3 kHz, and 7.5 kHz. Enclosure: Oiled walnut finish, fully sealed.
Dimensions: 27 in. H x 15 in. W x 13 1/4, in. D.
Shipping Weight: 53 lbs.
Price: $279.95.
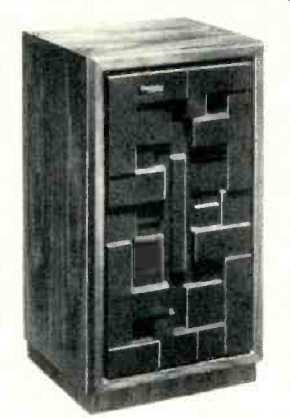
Technics by Panasonic is not new in high-quality consumer audio. One of the better loudspeaker systems made under this trademark is the Model T-400, a four-way, five driver system intended for floor mounting. The enclosure measures 68.6 cm. H x 38.1 cm. W x 33.7 cm. D. (27 in x 15 in. x 13 1/4 in) and weighs 24 kg. (53 lbs.).
The sides and top are finished in oiled walnut, and a colorful sculptured foam and cloth grille accents the darker wood tones. Since the T-400 is generally intended for mounting adjacent to a wall, the rear of the cabinet is stained but not furniture finished.
Speaker connection is made to two well-marked terminals in a recessed cavity on the rear of the enclosure. Tweeter and midrange-level switches are placed directly above the terminals. Each of these is a two-position switch, with the up position corresponding to normal equalization and the down position corresponding to a 3-dB level reduction.
A 30.5-cm (12-in.), high-compliance woofer is mounted on the bottom of the front panel and works into a sealed enclosure. A 13-cm (5-in.) midrange driver and 9-cm. (31-in.) tweeter share the central portion of the front panel, while two 5-cm. (2-in.) super tweeters are mounted at the top, angled away from the front axis for broader dispersion of the highest frequencies A very clearly-written instruction manual accompanies each speaker.
Measurements
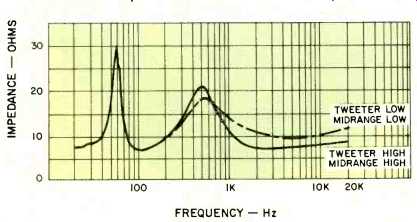
Fig. 1-Impedance versus frequency.
Impedance as a function of frequency is shown in Fig. 1. The two extreme positions of level control are plotted since this represents the greatest impedance variation that will be seen by a power amplifier. The highest impedance is presented when the midrange and tweeter switches are both in the down or low position. The lowest impedance occurs for the switches placed upward. The T-400 is rated at 8 ohms, and the lowest value measured was approximately 7 ohms.
The polar impedance plot for the downward switch positions is shown in Fig. 2. In a sense, this polar measurement is a duplication of the impedance plot of Fig. 1. However, Fig. 1 is a plot of the magnitude of impedance and is a rapid overall look at the highest and lowest values of impedance and how they relate to frequency. Figure 2 goes a bit further and shows the nature of load which the speaker presents to an amplifier, including where it is capacitive reactive and where it is inductive reactive.
Two basic resonances exist, one at 58 Hz, the other at 490 Hz. Two worst-case capacitive-reactive loads for power amps occur at 65 Hz and 940 Hz. These are low enough in frequency that any well-designed amplifier should be capable of driving the T-400 without undue stress at high levels.
To check for impedance nonlinearities, a constant-voltage sine-wave signal is applied to the speaker terminals and a spectrum analysis made of the current demanded by the speaker. Impedance nonlinearities show up as distortion of this current and indicate the nature of load which constant voltage power amplifiers must be able to control. A worst case nonlinearity in impedance was measured at the bass resonance of 58 Hz. At a constant peak-to-peak voltage drive of 8 volts, corresponding to a drive level of one watt into the rated 8 ohms, speaker-drive current measures 3.2 % second harmonic content (106 Hz) and 1 % third-harmonic content (168 Hz). With the drive voltage increased to ten watts, the second harmonic rises to 5.5 % while the third harmonic drops to 0.8 %. While this indicates a small amount of magnetic field nonlinearity in the woofer for moderate cone excursion, the load current can be readily controlled by any well-designed amplifier, since it occurs at such a low frequency.
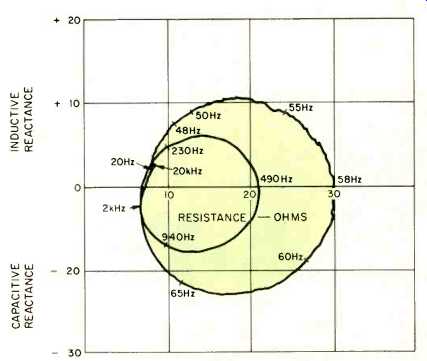
Fig. 2-Complex impedance polar plot.
The free-field (anechoic) frequency response is shown in Fig. 3 for the amplitude of sound pressure at one-watt drive and a one-meter axial position, and in Fig. 4 for the phase of the sound pressure under the same conditions. The amplitude of sound pressure is plotted for the two extreme equalizer positions. The effect of the equalizers is approximately 3 dB, as specified by Panasonic.
Low frequency response extends down to about 55 Hz, dropping off smoothly below that frequency. Response up through the range of musical instrument fundamentals is smooth and uniform. A dip in response at around 1500 Hz is followed by strengthening of the output at around 7000 Hz. The response drops rapidly above 14 kHz for an axial one meter microphone position.
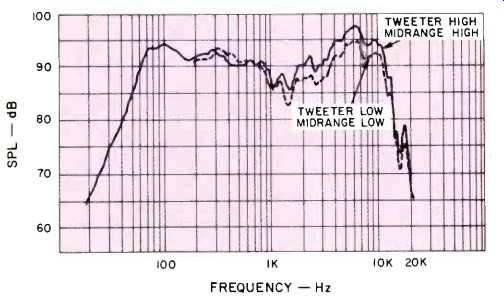
Fig. 3-One-watt, one-meter anechoic amplitude response.
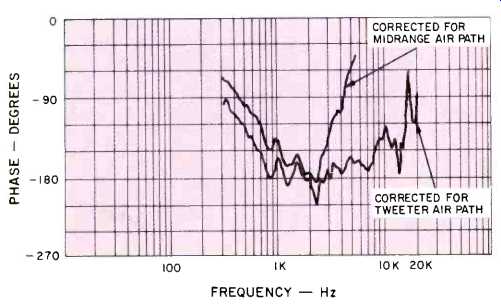
Fig. 4-One-meter anechoic phase response.
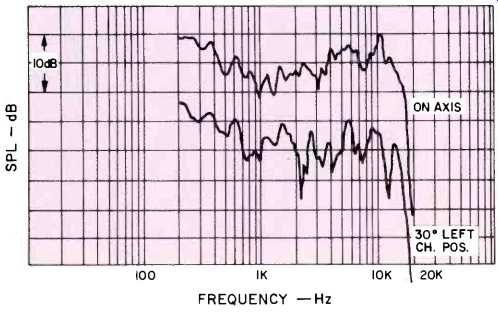
Fig. 5-Three-meter "room" response, range controls in high positions.
From the phase response, it is evident that the sound from the tweeters arrives before the sound from the other speakers in this four-way system with frequencies above 8 kHz arriving first. Shortly afterward the sound from the 2.5-kHz to 8-kHz range arrives to reinforce the super-tweeter signal.
One-tenth millisecond later, the 800-Hz to 2.5-kHz sound is heard, and 0.25 milliseconds after this, the sound spectrum below 700 Hz is received. The phase response is shown for two time delays; the curve marked "corrected for tweeter air path" is plotted for the arrival of sound from 2.5 kHz to 8 kHz, the other curve is plotted for 800 Hz to 2.5 kHz arrival.
The sound from all drivers above about 800 Hz is uniform in phase transition but is 180 degrees out of phase with frequencies below that. This will not be significant when T-400s are used throughout the sound system, but indicates that some care may be needed if this speaker is used for a quadraphonic addition to an existing stereo installation.
The phase transitions are smooth and uniform, however, the arrival time differences make the response non minimum phase. The basic frequency response changes with off-axis angle. At 15 degrees from the direct on-axis position, the high-frequency drivers interfere with each other and create a non-minimum phase characteristic with 540 degrees of acoustic phase angle change at 6.6 kHz.
The way a speaker sounds in a room is far more important to a listener than its anechoic chamber response. Figures 5 and 6 show more nearly the way the T-400 measures in a room. The unit was placed along a wall, as recommended by Panasonic, the listening position located 3 meters away from the speakers and one meter above the floor. The frequency response corresponding to the first 13 milliseconds of sound due to an impulse is shown in these figures. Both a direct front listening position and a 30-degree left-channel-stereo seating position were measured. The curves are displaced 10 dB on this plot to prevent confusion.
These measurements indicate that the T-400 will tend toward a lower pitch dominance in its timbre at around 200 Hz, a sound some would describe as "chesty." This may be partially corrected by pulling the T-400 away from the wall.
The midrange level is down with respect to the extreme top end.
The T-400 is definitely hotter in high-frequency response when pointed toward the listening position than when a normal off-axis stereo listening position is taken. The "chesty" sound may be somewhat offset by rotating the speakers slightly so they point more nearly toward the listening position. The effect of floor and ceiling scatter is minimal in this early sound as is shown by the similarity of this response and the anechoic measurement.
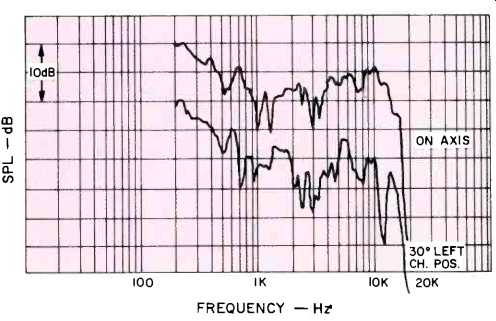
Fig. 6-Three-meter "room" response, range controls in low position.
The polar energy response is shown in Fig. 7 for a horizontal pattern and in Fig. 8 for the vertical pattern. This measures the angular dependence of the total sound energy from 20 Hz to 20 kHz. The T-400 has a preferred left-versus right horizontal directivity, as shown. The sound is also directional in its vertical characteristics, with an upward launch angle that is about right for floor-mounted listening.
This correlates well with the observation that the room response is similar to the anechoic response, the exception being the 200-Hz reinforcement commonly noted for wall placement with enclosures of this size. In many listening situations, it would appear that better stereo imagery could be obtained by rotating the speakers toward the average listening location. The directional characteristics may prove to be a mixed blessing. Normal room decor will not materially affect the sound, but the stereo image will tend to "walk" with you as you move about the listening area and will also tend to constrict the area.
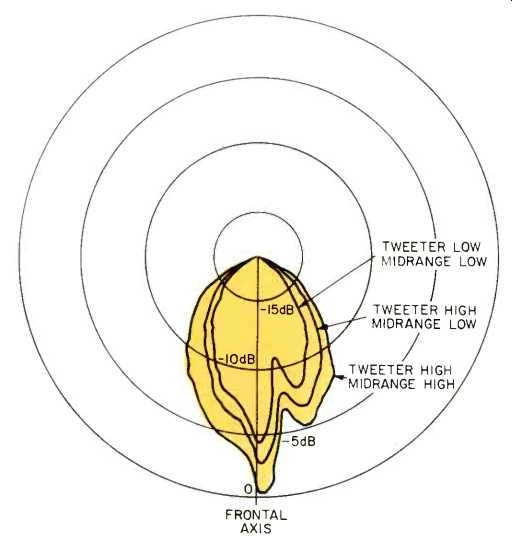
Fig. 7-Horizontal polar amplitude response.
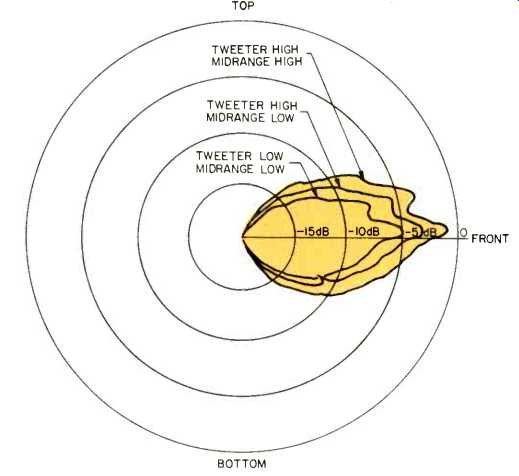
Fig. 8-Vertical polar amplitude response.
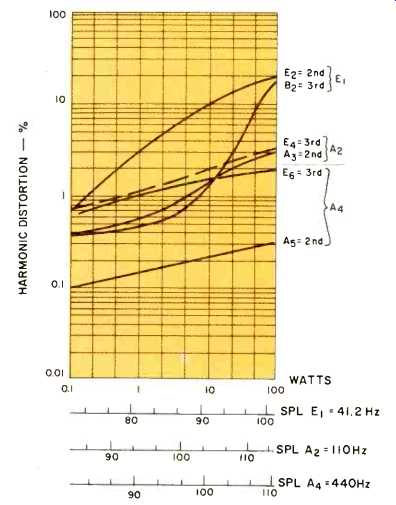
Fig. 9-Harmonic distortion for the musical tones E1 or 41 Hz, A2 or 110
Hz, and A4 or 440 Hz.
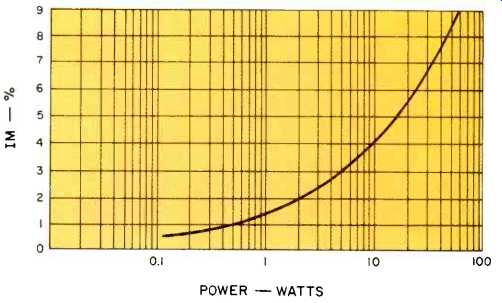
Fig. 10-Intermodulation of A4 or 440 Hz by E1 or 41 Hz, mixed one to one.
Harmonic distortion for the musical tones E1, A2, and A4 is shown in Fig. 9. Third harmonic distortion, which corresponds to the creation of the fifth in the octave higher, is stronger in the T-400 than the second harmonic for A2 and A4. At E1 or 41 Hz, the woofer is having some difficulty, which indicates some nonuniformity of cone motion. At 440 Hz the harmonic distortion is acceptably low, however the average position of the woofer cone moves outward from its no-signal physical location as the sound level is increased.
At the maximum drive level of Fig. 9, the net displacement is 1.3 cm. at 440 Hz. This very slight breathing of average physical position with drive is very common in loudspeakers and can account for some stereo image wander under rapidly changing musical program dynamics.
Intermodulation distortion was measured by mixing the tones E1 (41.2 Hz) and A4 (440 Hz) in equal portion. These tones are chosen because of their musical significance and because they are shared by the same driver in the T-400. The measured modulation of A4 by E1 is shown in Fig. 10. The intermodulation is primarily amplitude modulation with very little phase modulation. As the power level is raised, the average position of the cone moves outward and accounts, at 60 watts, for a 15-degree static phase advance of the 440-Hz tone due to the presence of the 41-Hz tone.
The ability of the T-400 to handle broad-band peaks such as applause, is measured in the crescendo test. A representative inner musical voice, such as A4 (440 Hz) or middle C (262 Hz), is measured by itself, and then in the presence of wideband Gaussian noise with an average power (measured over a 20 kHz band) 20 dB higher than that of the musical voice. A crescendo limit is defined when the inner voice is reduced 1 dB in level by the presence of the incoherent noise. In the T-400 the crescendo limit was reached at a peak noise power of approximately 125 watts for the tone A4, and a peak power of 312 watts for tone middle C. This indicates a moderately strong power-handling capability.
The ability of a loudspeaker to provide good reproduction of transient sounds is measured with a perfect transient--the impulse. In the tests performed by Audio, the impulse response is computed from the frequency response, that is, the analytic signal is computed and its magnitude is plotted in dB versus time, in a form called the energy-time curve. The energy-time curve for the T-400 is shown in Fig. 11 for a one-meter axial microphone position and in Fig. 12 for a one-meter 30-degree off-axis position-the direction the listener would assume in the left-channel stereo position.
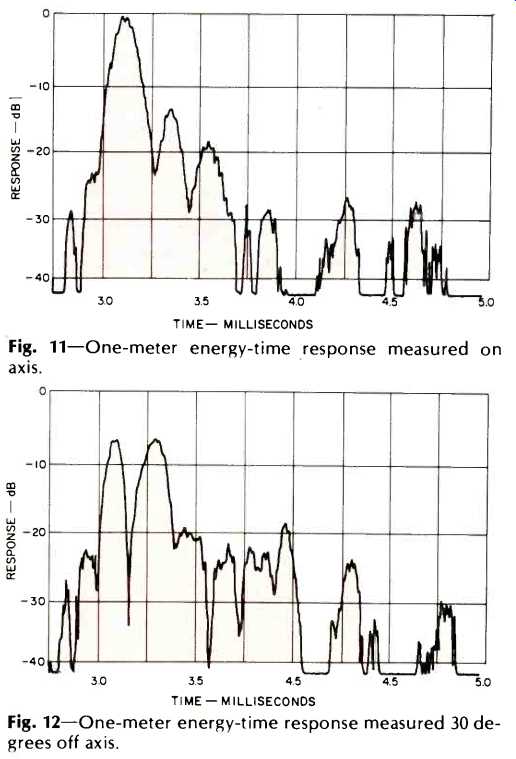
Fig. 11-One-meter energy-time response measured on axis
Fig. 12-One-meter energy-time response measured 30 degrees off axis.
The super tweeters and the main tweeter are positioned on the front panel of the enclosure so that their sounds coincide and reinforce, for a direct front listening position.
This is shown in Fig. 11 by the single energy peak at 3.1 milliseconds. The subsequent peaks at 3.3, 3.6, and 3.8 milliseconds are reverberation components falling off at a rate of about 32 dB per millisecond. These will not significantly color the impulse behavior on-axis because of their rapid decay. The enclosure edge-diffraction components at 4.25 and 5.64 milliseconds are also well down, at levels of 28 dB below the first sound.
The off-axis transient response does not fare as well as the on-axis response because of the lateral spacing between the average acoustic centers of the super tweeters and the center of the midrange and tweeter speakers. This causes a spread of energy over a range of one millisecond from first arrival. The result is a loss of clarity of sharp transient sounds and a change in the timbre between off-axis and on-axis listening positions for frequency components above 1 kHz.
The edge-diffraction components are slightly displaced, due to the change in geometry, but remain at a reasonably low level at 4.3 and 4.8 milliseconds. In spite of the difference in appearance between the on-axis and off-axis energy-time curves, 95 percent of the sound energy from both positions arrives within 0.45 milliseconds of the first sound arrival.
These measurements lead this reviewer to recommend rotating the T-400 toward the listening position to improve its transient reproduction.
Listening Test
The T-400 speakers were initially placed against a flat wall, as recommended by Panasonic. The listening geometry chosen for stereo material consisted of an equilateral triangle with the spacing between speakers approximately 3 meters.
In this position there was a distinct midbass peak that caused an unnatural emphasis of male vocals and midbass instruments. This was partially cured by pulling the speakers away from the walls about a half meter, but the bass was still considered too hot. The T-400 is a good reproducer of organ music, but has a distinct tendency to make you aware of any rumble or hum in your system. A small bass cut with the pre amp equalizer finally achieved what was considered the best balance. At high sound levels the bass has a tendency to become less distinct in percussive articulation.
After considerable adjusting and listening, final adjustment positions were the midrange equalizer switch in the high position and the tweeter switch in the low position.
The extreme high frequencies were down in level when this was done, but a more uniform balance resulted without top end spit or annoying levels of audible record scratch.
The T-400 delivers good kick drum sound and can handle a lot of horn and brass peak power without caving in. Solo vocals are well placed and clear in the stereo image. Choral groups seemed spatially smeared and indistinct. Despite this apparent contradiction in reproduction of the human voice, this impression was noted in several types of selections.
The listening position for good stereo imagery is a bit critical for wide range material when the speakers are placed flat against the back wall. Rotating the speakers toward the listening position definitely helped the stereo imagery at the preferred listening position, but restricted the listening area to a best-seat-in-the-house situation. If one listens alone, I recommend pulling the speakers away from the wall and rotating them inward toward your seating location; otherwise, pull them away from the wall but do not rotate them.
The T-400, though not intended as state of the art, does deliver accurate and high quality sound. It demands a good amplifier and clean program material and is well suited for listening areas that are bright in their acoustic properties.
-Richard C. Heyser
(adapted from Audio magazine, Dec. 1975)
Also see:
University "Project M" Speaker System (Apr. 1970)
= = = =