Manufacturer's Specifications
System Type: sealed box.
Frequency Response: 28 Hz to 22 kHz, ±2 dB.
Drivers: 10-in. (25-cm), polypropylene cone woofer and 1-in. (25-mm), soft-dome tweeter.
Crossover Frequency: 3.5 kHz, gradual slope.
Impedance: 8 ohms.
Recommended Amplifier Power: 40 to 150 watts per channel.
Sensitivity: 85 dB SPL, 1 watt/meter.
Dimensions: 34 1/2 in. (87.6 cm) H x 13 in. (33 cm) W x 13 3/4 in. (34.9 cm) D.
Weight: 45 lbs. (20.4 kg).
Prices: Assembled. $600.00 per pair; Basic Kit, $225.00 per pair: Complete Kit, $400.00 per pair.
Company Address: 3877 Foxford Dr., Doraville, Ga. 30340, USA.
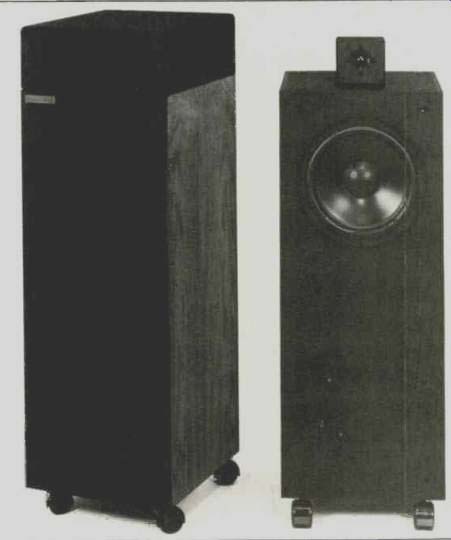
The most unusual feature of the Acoustic Image Model II from Acoustical Physics Laboratories is its combination of size and price. The highly competitive $400-per-pair speaker market is dominated by diminutive bookshelf systems.
The Model II, however, stands 37 3/8 inches off the floor on casters. "Do it yourself" is the key to the low price, although, at $600, a factory-assembled pair still appears to be a bargain. The Complete Kit requires only that the constructor screw crossover, drivers and casters to the finished cabinet and plug together four push-on terminals. The Basic Kit contains drivers, crossovers and hardware, but the constructor must build the enclosure from scratch. All versions can only be purchased directly from the manufacturer, with a 30-day money-back return policy. The factory-assembled version is reviewed here.
The Model II is a two-way system utilizing a 10-inch polypropylene-cone woofer in a sealed box, crossing over to a 1-inch soft-dome tweeter at 3.5 kHz. The woofer cabinet is constructed of 3/4-inch, walnut-veneer particleboard and has the proportions of an elongated bookshelf system. Audiophiles frequently place their "bookshelf" speakers on floor stands to elevate them and get them away from nearby reflecting surfaces. With the Model II, the "floor stand" is built in as additional cabinet volume. The larger volume gives the potential for extended low-frequency response and higher efficiency. Alignment of the acoustic centers of woofer and tweeter is accomplished by mounting the tweeter in a free-standing bracket on top of the main cabinet.
Removable frame and stretch-fabric grilles cover the entire front and top. The overall appearance is well-finished and classy.
Four smoothly operating casters allow the speaker to be placed against a wall for storage or casual listening: it can then be pulled away from reflecting surfaces for more critical listening. Acoustical Physics Laboratories also recommends removing the upper grille frame and applying thin pieces of felt or fiberglass to the top of the cabinet near the tweeter to further reduce reflections. The speaker systems have no fuses, level controls or other adjustments. Connection is made via high-quality five-way binding posts which accept the convenient double-banana plugs.
The instruction/specification sheet supplied has all the high-tech buzzwords-polypropylene cone, tight bass, time-domain accuracy, fast response, and the like-but contains little setup information. Power requirements and fusing recommendations, for instance, would be useful.
Suggested speaker placement and orientation, items that I found to be critical, are not covered.
My initial listening tests of the Model IIs were not favorable. The bass was weak, and the mids were hard, with a plastic coloration (not too surprising, when you consider that a sizable plastic cone is being forced to accelerate many thousands of times per second). The upper mids were suppressed, giving a dull and pinched quality, particularly in the brasses. As the measurements proceeded, I began to see the causes of many of these defects. Some problems could be minimized by careful aiming and positioning of the cabinets: others would require minor modifications to the kit assembly. One modification was rather drastic but still required no new parts. Normally I would not consider making such changes to a commercial product, but the kit format and apparently untapped potential of this speaker system invited tinkering. More on this later.
Measurements
Audio's speaker testing for the past 10 years has all been done by Senior Editor Richard C. Heyser, using time-delay spectrometry techniques which he invented. The Tecron division of Crown International recently introduced a dedicated time-delay spectrometry system based on Richard Heyser's work. This unit, at a price of under $16,000, is combined with other general-purpose and custom instrumentation to form my speaker-testing laboratory. The Tecron analyzer can collect and display vast amounts of data with great accuracy. The graphs accompanying this review are composed of over 60,000 individual data points, each stored with six-digit resolution on the system's floppy disks.
The three-dimensional display format is particularly useful in showing patterns of this data at a glance.
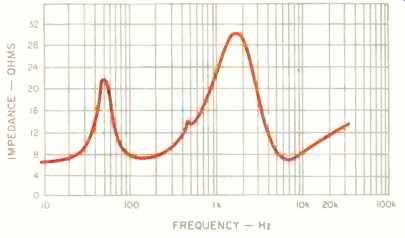
Fig. 1-Impedance magnitude vs. frequency.
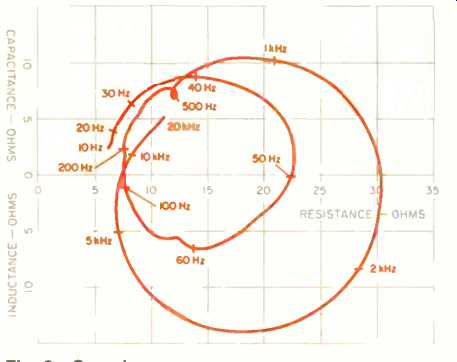
Fig. 2-Complex impedance.
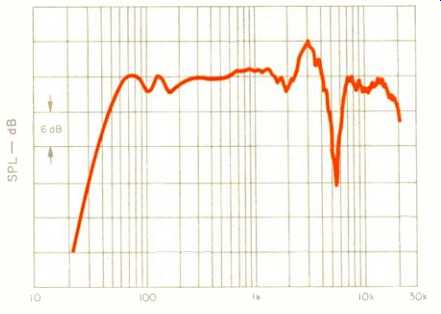
Fig. 3-Anechoic distance, perpendicular to frequency response the center
of the front measured at 1-meter panel.
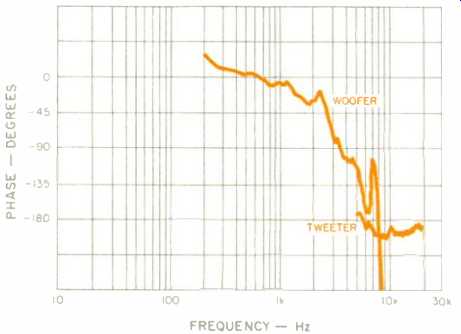
Fig. 4--One-meter on-axis anechoic phase response corrected for woofer time
delay of 3.026 mS and tweeter time delay of 3.309 mS.
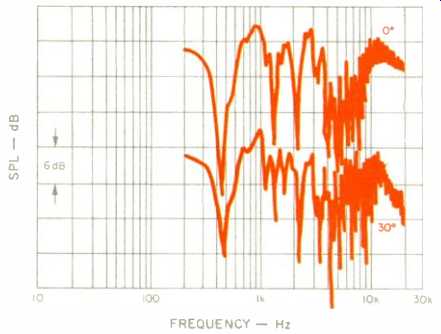
Fig. 5--Three-meter room-test plots, separated 15 dB for clarity.
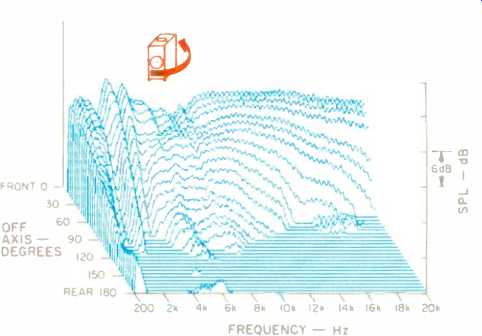
Fig. 6--Horizontal off-axis from front to rear of frequency response plots
system.
Impedance versus frequency for the Acoustic Image Model II is plotted in Fig. 1. The single bass peak, characteristic of sealed-box designs, occurs at 50 Hz, and the anechoic frequency response can be expected to fall off at 12 dB per octave below this frequency. The minimum impedance is 6.5 ohms. By re-plotting the data in the impedance curve, more information about the loading of the speaker system on the amplifier is obtained, but frequency resolution is lost. In Fig. 2, the complex impedance plot, resistance is represented by the horizontal component and reactance by the vertical component. Reactance, either up or down from center scale, means that energy is stored in the speaker system and must be both supplied and re moved during each cycle. At major impedance-peak frequencies, such as at 50 Hz and 1.7 kHz, stored energy is transferred between two forms within the system (for in stance, between suspension displacement and cone velocity), so there is none to be absorbed by the amplifier. Note the loop at 500 Hz: It is a result of energy storage in the displacement and velocity of the heavy rubber surround superimposed on a major impedance peak. There are no frequencies where the Model IIs should prove an undue challenge for an amplifier rated for 8-ohm loads.
All frequency response measurements were made with both grille frames removed but without any felt added around the tweeter. The standard 1-meter anechoic response curve. Fig. 3, is made with the microphone placed perpendicular to the geometric center of the front panel. For this floor-standing speaker, the standard microphone placement means that both woofer and tweeter are measured at an angle considerably below the normal listening axis. The differing path lengths from woofer and tweeter to micro phone produce a deep cancellation notch at 5 kHz. The rise at 3 kHz and the droop at 20 kHz are due to the microphone being on the woofer axis and off the tweeter axis. Radiation of frequencies near the upper operating range of a driver are usually quite directional. The low end does roll off below 50 Hz, as expected.
Anechoic phase is shown for woofer and tweeter separately in Fig. 4. For the standard microphone position, the tweeter is about 103 mm farther away than the woofer. This is corrected for in this measurement. The overall trend of a shift from 0° to -180° through the crossover frequency is characteristic of an ordinary second-order crossover net work. Double-blind tests I have conducted indicate that this amount and rate of change of phase shift are inaudible in music. Of course, 'he phase shifts in the two stereo channels must track each other closely. Ideally, woofer and tweeter would have no relative phase shift near crossover even though the system phase is changing. This would avoid a tilting of the loudspeaker's polar pattern near the crossover frequency.
If only one measurement were relied upon to tell us how a speaker sounds, it would be the 3-meter room test, Fig. 5.
The microphone is placed 3 meters away from the speaker and 1 meter off the floor-similar to the ear position of a seated listener. In the case of the Acoustic Image Model II, the speaker was placed 1 meter away from the side and rear walls, a position found to be optimum earlier, during music listening. A time window in the measurement allows only the first 10 mS of sound arrival to influence the plot. This time period allows reflections from floor, ceiling, rear and side walls as well as cabinet diffraction to be included in the measurement, and it approximates the ears' integration time for assessing timbre or coloration. A period of 10 mS is too short to allow room reverberation to affect the measurements, so this curve should apply to this speaker in most listening environments. Deep floor- and ceiling-reflection interference notches occur, starting at 400 Hz. Having a thicker carpet than the one on my floor would help here. The major hole around 6 kHz is due to interference between woofer and tweeter radiation. This woofer has surprisingly strong on-axis output to one octave above the crossover frequency. The factory alignment of the Model II's tweeter on the top of the cabinet results in cancellations both for the downward angle of the 1-meter on-axis test and at the listening location.
I also noticed, during the earlier listening tests, that the sound was brighter when I stood than when I sat. A check of vertical polar response in the 6-kHz region revealed that interference notches occurred at roughly 20° intervals. One of these notches happened to be aimed at the normal seated listening location! This design error should never have reached production. My first modification was to change the tweeter's front-to-back location to aim the first interference notches above and below my seated listening position, thereby restoring proper brightness to the sound.
Figure 6 is a composite of 31 frequency response curves, taken at 6° increments from on-axis (rear plot) wound the side to the back of the cabinet (front plot). The linear scale expands the high-frequency range and allows easy recognition of interference patterns by their regular "comb" appearance. As always, dispersion is wide and uniform at the lowest frequencies. The woofer becomes increasingly directional near the upper end of its range (1 to 4 kHz). At about 4 kHz, the tweeter becomes active and the 1-inch dome reintroduces wide dispersion, which again narrows as frequency goes up to 20 kHz. Speaker designers may argue about the merits of wide versus narrow dispersion patterns, but a drastic mid-band change such as this must be considered a deficiency.
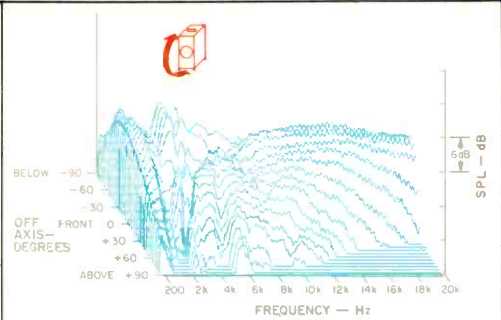
Fig. 7-Vertical off-axis frequency response plots from below to above system.
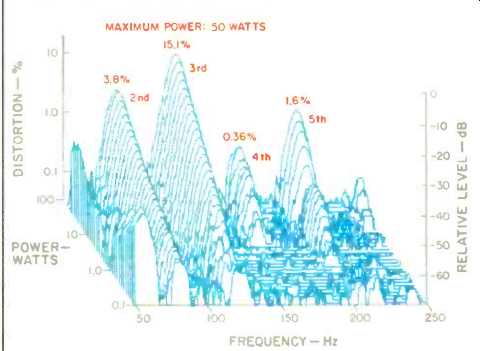
Fig. 8-Harmonic distortion products of the tone E1 (41.2 Hz).
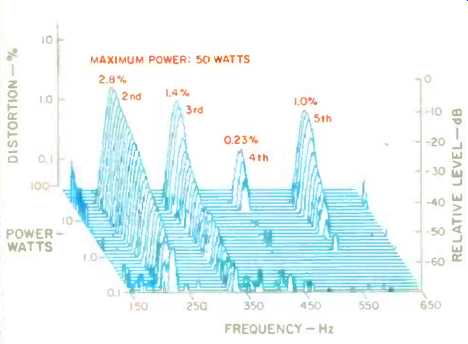
Fig. 9-Harmonic distortion products of the tone A2 (110 Hz).
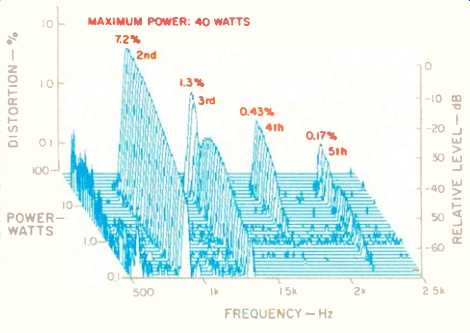
Fig. 10-Harmonic distortion products of the tone A4 (440 Hz).
Figure 7 is a similar composite of 31 response measurements, this time taken from directly below the cabinet, up the front to directly above the cabinet. Since woofer and tweeter are vertically displaced, each angle results in a different measurement distance from woofer and tweeter and produces a unique set of peaks and dips in the 2- to 7-kHz crossover range. The overall trend of wide to narrow dispersion with increasing frequency for both woofer and tweeter can still be seen. At frequencies where dispersion is restricted both horizontally and vertically, less energy is injected into the room to return to the listener as reverberation. Without the mellowing effect of room reflections, a speaker with very uniform, anechoic on-axis response can still sound harsh. By listening slightly off-axis, the ratio of direct-to-reflected sound can be reduced and made some what more uniform with frequency. For the Acoustic Image Model IIs, a relatively small optimum listening window is dictated by vertical interference effects and by the need to be slightly off-axis horizontally.
Figures 8, 9 and 10 show harmonic distortion components of test signals of 41.2, 110, and 440 Hz respectively. The fundamental is not shown, but it is the reference at 0.0 dB or 100% for all curves. The front-to-back dimension of this three-dimensional plot is increasing power from 0.1 to 100 watts. Distortion components through the fifth harmonic are plotted at each power level. The distortion is not particularly low, even at low power levels, but it consists primarily of low-order harmonics (i.e., second and third) which are not as annoying as the "buzz" associated with higher harmonics.
Generally, low-order harmonic distortion products at levels of 3% or 4% are not audible in music, so the Model II may be considered clean at typical listening levels.
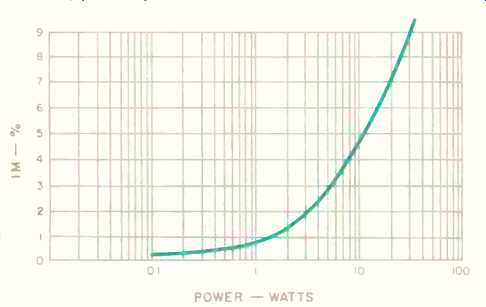
Fig. 11-1M distortion on A4 (440 Hz) caused by E1 (41.2 Hz), mixed one to
one.
Intermodulation distortion is plotted in Fig. 11. The cyclic amplitude compression and phase shift of 440 Hz by 41.2 Hz, mixed at the same level, is rather high for a 10-inch driver in this size enclosure. On most program material, however, a 300 watt-per-channel amplifier would clip on peaks before the average distortion level would exceed a few percent.
In the crescendo test, a 630-Hz tone of 0.1-watt input was compressed 1.0 dB by the addition of 10 watts of wide-band pink noise. Peaks in the noise test signal reached 100 watts, so this compression should not be considered very much of a problem.
Overall, the harmonic, intermodulation and crescendo tests indicate that amplifiers rated up to 200 watts would be beneficial-provided that the average power fed to these speakers did not exceed about 30 watts. Considering their reasonable efficiency, the Model IIs can produce a satisfying level at 3 meters in a typical listening room.
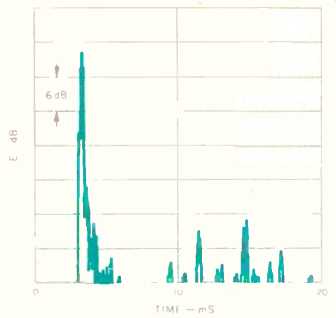
Fig. 12-One-meter on-axis energy vs. time response. (Traces beginning at 8 mS
are room reflections.)
The time response curve shown in Fig. 12 is dominated by tweeter output, because the tweeter covers three-quarters of the 20 Hz to 20 kHz bandwidth of this test. The woofer output, 15 dB below the maximum level, begins slightly before the tweeter because of the low microphone position of the standard test setup. The response dies quickly, indicating a lack of resonant energy storage or cabinet diffraction.
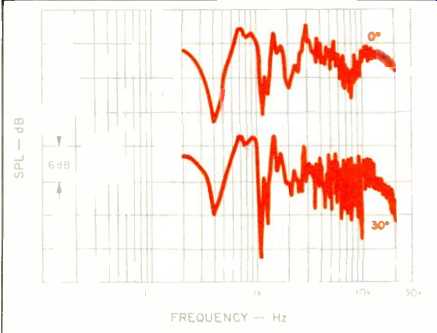
Fig. 13-Three-meter room-test plots of modified unit, on-axis and 30° off-axis.
(Plots separated by 15 dB for clarity.)
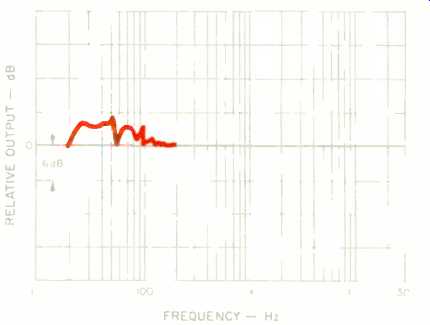
Fig. 14-Additional in-room bass response of modified unit relative to stock
unit. (Stock unit is shown as 0 reference.)
Use and Listening Tests
As I said earlier, the out-of-the-box Model IIs did not impress me favorably during the initial listening test, even considering their modest price. The bass was weak, though it did not have the objectionable thump of vented designs tuned to a relatively high frequency. Upper bass had a discernibly nasal character. Midrange had the colorations mentioned earlier, with the upper mids suppressed. Only the high end escaped criticism because of its smooth and extended sound.
The speakers were auditioned in two different rooms, using various placements and cabinet orientations. With the 6-kHz hole not yet remedied, every position seemed to be a compromise. Corner positioning solidified the bass response, but the stereo image developed a hole in the middle. A fairly wide spacing, away from the walls and with toe-in, seemed to be the best overall. A thick rug or a piece of foam sound-absorbing material on the floor, placed mid way between listener and speaker, also helped. Acoustic guitar was one of the few music sources that the stock Model IIs reproduced well.
After discovering there was a tweeter-position problem, I figured out an easy way to optimize it for a given listening height, even without the aid of instruments: Simply tune in some interstation FM noise and have an assistant slide the tweeter forward to tune for maximum high-frequency output.
Use the same physical offset for the other speaker. A movement of less than 1 inch can transform the system's spectral balance: I settled on mounting the front edge of the bracket 1 3/4 inches back from the front edge of the cabinet.
I had a suspicion that the nasal character might be due to internal cabinet resonances, so I removed the woofer to add about 4 square feet of 2-inch thick fiberglass to the inside of the cabinet, behind and above the woofer. Sure enough, when A/B tested against the unmodified unit in mono, there was an audible improvement. Not trusting my "constructor's ear," I asked other people to listen in a blind test and they also preferred the modified unit.
The Acoustic Research AR-1W introduced 30 years ago was the first acoustic-suspension woofer. It was slightly smaller than the Acoustic Image Model II's woofer and had much better low-end performance. It was also much more expensive, but, in theory, frequency response optimization, at low power levels, need not be cost-constrained. I decided to measure the Thiele-Small parameters of the Model II's low-frequency driver to check the design against theory.
The driver's suspension proved to be rather stiff, requiring the enclosure to be rather large (2.2 cubic feet) in order to keep the system resonance low enough in frequency. The Acoustic Research approach used a combination of small cabinet and ultra-compliant suspension to achieve the proper system resonance.
Using vented-box design equations similar to those published in Audio in August 1978, I found that the Model II's woofer/cabinet combination might work as a nearly optimum vented system. With a port tuning the cabinet to 27 Hz, the response should be nearly flat to 30 Hz. The frequency of maximum cone excursion should be 18 Hz, well above record-warp and arm/cartridge resonance frequencies. It looked like a winner, so I did it. I mounted a 6-inch long piece of 3-inch diameter PVC pipe facing downward in the bottom panel of the enclosure, which is raised off the floor by the casters.
After quickly comparing the modified unit to the original unit. I modified the second unit as well. I then began the listening tests all over. The additional clean bass response gave a solid, balanced quality to the sound, even with the speakers well away from the walls. The Model IIs still had a little harshness and coloration in the midrange, audible mainly on recordings of choir and massed strings. This problem was reduced by listening about 10° off-axis. With the speakers facing parallel to the side walls, the harshness and most of the coloration were gone, because the centered listener was about 15° off-axis. This angle also dulled the midrange slightly, giving a nice distant quality, but lateral imaging was very sensitive to the listener's side-to-side location. An extreme, "cross-eyed" toe-in of about 45° was then tried. The depth imaging and ambience retrieval became very good, with an even left-center-right soundstage perceptible over a reasonably wide listening area. The modified Model IIs were often preferred to the much more expensive reference speakers by a variety of listeners (including me) in one listening room but not in the other.
Figures 13 and 14 show changes resulting from my modifications. Besides the tweeter repositioning, the 3-meter room curve of the modified speaker benefits from a piece of sound-absorbing material placed on the floor midway to the microphone. This reduces the floor-bounce cancellation notches. The big improvement, however, is that the 6-kHz hole is nearly gone. The difference resulting from venting the enclosure is shown in Fig. 14. This curve includes all room effects for modified and unmodified systems. The nearly 4-dB increase in low-end output is due, in part, to the excellent coupling of the vent radiation to the floor.
The Acoustic Image Model IIs have a unique position in the speaker market: They demand owner involvement, and reward it with impressive performance at low cost. Even the purchaser of factory-assembled units is expected to remove the grilles and reposition the cabinets before listening. I suggest that any owner go beyond this level of involvement and try the modifications suggested in this review-they are all reversible. Naturalness of midrange timbre of the modified speakers is surpassed by a number of other low-priced two-way systems employing 6- or 8-inch woofers, but I would gladly make the slight sacrifice in this important quality to get the remarkable bass performance of the large, vented 10-inch Model IIs.
-David L. Clark
Manufacturer's Comment: We have reviewed and tested the Model II modifications suggested by David Clark. Our own listening tests, as well as swept warble and impulse FFT measurements, indicate significant improvements do result from the suggested modifications. As a result, our instructions for the Model II now specify tweeter displacement of 1.75 inches from the front of the enclosure, specify additional fiberglass damping within the enclosure, and recommend, as an option, the 27-Hz downward venting of the enclosure. The factory-assembled Model II incorporates these modifications with the vented enclosure as an option.
As a manufacturer of speaker systems, we applaud Audio's comprehensive TDS acoustical tests as meaningful representations of speaker performance. We would like to comment that 1-meter, on-axis measurements of the Model II do not represent a real listener's position and emphasize that measurements at the 3-meter distance, at a 1-meter height, are more representative of the loudspeaker's performance as viewed by a listener.
-William Morrison
( Audio magazine, Dec. 1984)
Also see:
Acoustic Research AR98LS Speaker (Equip. Profile, Jan. 1985)
Acoustic Research 338 Speaker (Nov. 1995)
Acoustic Research Limited Model 2 Preamp (Aug. 1994)
AR M1 Speaker (Equip. Profile, Jan. 1992)
AR (Acoustic Research) MGC-1 loudspeaker (ad, Nov. 1986)
Altec Lansing 511 Speaker (Apr. 1991)
= = = =