By Gill Grieshaber, CET
Many previous explanations about TV vertical-sweep theory are totally wrong. Correct operation is covered in detail here along with the necessity for certain waveforms, how to analyze vertical waveforms and several tips for servicing vertical sweep circuits.
Most explanations of the vertical-output stage in a tube-powered TV receiver describe the main function as power amplification for driving the yoke. This amplification is thought to be moderately linear with only a small amount of distortion introduced intentionally to cancel yoke and transformer distortion.
That explanation appears to be verified by the Figure 1 waveforms.
Obviously the plate waveform of the lower trace is an inverted and amplified image of the top trace grid waveform.
Misapplied theory
The circuit operation seems to be logical and correct, but that is not how the circuit works. Any trouble shooting based on this false theory will produce incorrect results. Those statements will be proved by many facts.
Wrong signal amplitudes
One warning sign is the large signal amplitudes that do not match the dc voltages. For example, it's impossible for any class A or class AB tube amplifier stage to handle an input of 470 V peak-to-peak with a grid/cathode bias of only -50 V.
To produce large output signals without excessive distortion, linear audio amplifiers must position the center of the input waveform at the optimum bias point. Also, the peak-to-peak input amplitude can not exceed the bias. If the amplitude exceeds the bias, the grid draws current, clipping distortion occurs and dc voltage is generated.
For example, if the large input signal of Figure 1 was applied to a single tube operated with class AB bias, the tube could not handle the 235 peak volts above and the 235 peak volts below the nominal -50 V of grid/cathode bias. Instead, grid current would flow, thus clamping the positive peak and producing about -235 V of bias.
However, that is not happening in the vertical-output stage as proved by the lack of a high negative voltage. The same dc voltage is present at each end of the grid resistor.
According to these facts it is impossible for the vertical-output tube to amplify the total pulse/ sawtooth amplitude that is applied to the grid.
Instead, a positive voltage from the linearity control moves the bias voltage point so it crosses the grid waveform at about the center of the sawtooth portion. This allows a balanced swing of sawtooth signal voltage around the bias point. At the sawtooth negative peak tip, the output-tube current must be zero; therefore, the pulse amplitude can not affect the plate current.
Plate amplitude is limited
Signal amplitudes at the plates of vertical-amplifier tubes range between 800 VPP and 1500 VPP. Such large voltages cannot be produced by amplification.
Without ringing or resonance no amplifier can produce an output signal of higher peak-to-peak voltage than the power supply dc voltage. When a tube is cut off by bias, the plate voltage rises to the supply voltage level. If a tube could be saturated completely, the plate voltage would be zero. There fore, the maximum range of signal voltages is between the supply voltage and zero.
A vertical amplifier with +255 V between plate and cathode (as in the CTC10) never can have more than 255 VPP of amplified signal at the plate. The plate sawtooth has an amplitude of 90 VPP, which is well within the tube's capability.
The other 1300 VPP of pulse amplitude is generated by ringing of the output transformer and the deflection yoke.
Before the true output operation is explained, consider another case of misapplied theory.
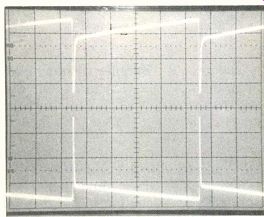
Figure 1--Similarity of the vertical-output grid waveform (top trace)
and the output plate waveform (bottom trace) appears to verify that only
linear amplification with inversion has occurred.
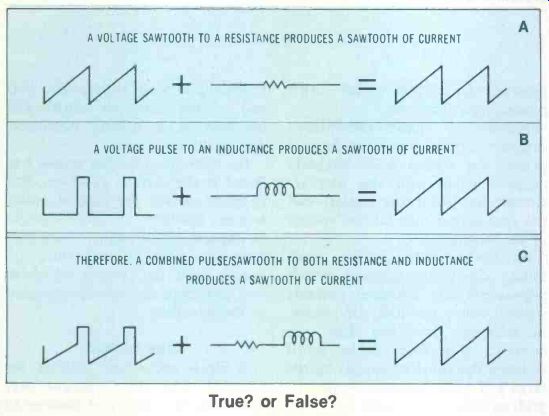
Figure 2---True? or False? This is the explanation given most often in
textbooks for the combination sawtooth/pulse waveform at the vertical
yoke. However, it is wrong. Yoke inductance is not sufficient to produce
a sawtooth at that pulse repetition frequency. Instead, the sawtooth
part of the waveform produces the deflection.
Correct yoke waveform?
Many TV textbooks and home-study courses have made the statements and shown the drawings of Figure 2. The usual rationale to explain the pulse/sawtooth wave form of the vertical yoke is as follows:
(A) When the voltage sawtooth waveform is applied across a pure resistance, a sawtooth of current flows through the resistance.
(B) A voltage pulse produces a sawtooth of current when it is applied to a pure inductance (one without any dc resistance).
(C) Therefore, the vertical winding of a TV deflection yoke should be supplied with a voltage waveform that combines the correct proportions of sawtooth (for the resistance) and pulse (for the inductance).
Statement A is completely correct. Statement B is correct if a proper match is made between pulse repetition rate and the inductance. But the summary in statement C is wrong. Actually, the vertical yoke is supplied with a sawtooth of current, then the pulse amplitude is developed by yoke ringing from the sudden cessation of current.
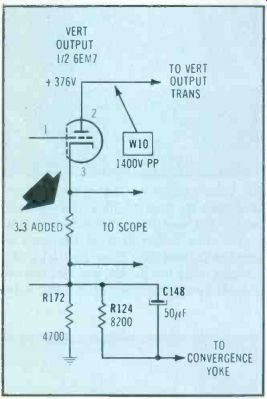
Figure 3---A 3.3 ohm resistor was added to the output cathode circuit.
A scope connected across the resistor showed the waveform of plate/cathode
cur rent. No pulse amplitude appeared in the waveform.
Tube produces sawtooth only
Any plate signal produced by amplification will be present in the plate/cathode current. To show current variations, a 3.352 resistor was added between the 6EM7 cathode and the other components (Figure 3). The resistance is too small to affect the normal operation, but the current produces a voltage drop, and a scope connected across the extra resistor shows the waveform of cathode-to-plate current.
Top waveform in Figure 4A is the 470 VPP combination pulse and sawtooth between grid and cathode of the 6EM7 tube. For the bottom waveform, the scope gain was increased until the 90 VPP of the sawtooth filled about half of the scope screen. A zero-voltage line was added by the scope.
An analysis of Figure 4A lower waveform reveals that the instantaneous grid/cathode bias varies from about -90 V at the start of vertical deflection (left part of the sawtooth) to just a few volts more negative than zero. Although the precise cutoff bias voltage of the tube is not generally know, it seems definite that none of the pulse will affect the plate current, since all of the pulse is more negative than the cutoff bias where the current is zero. Increasing the negative bias beyond the cutoff point can't produce less than zero.
Figure 4B shows the plate / cathode current waveform (scoped across the added 3.3 ohm cathode resistor) along with the average-current line (near the center) and the zero-current line (at the bottom of the waveform).
At the zero-current line, each falling edge of the sawtooth (which represents the retrace) extends slightly below the line. Of course, no tube can draw less than zero current; therefore, these small negative tips must be caused by the large grid pulse feeding through the grid/cathode capacitance.
The current waveform clearly shows that zero current flows at the beginning of vertical deflection (left end of the sawtooth slope) and increases at a slightly non-linear rate to the maximum.
No trace of amplified pulses was found in the current waveform. But to make certain the lack of pulses was not produced by critical height or linearity adjustments, those controls were adjusted over their full ranges while the current waveform was observed. No pulses appeared in the waveform.
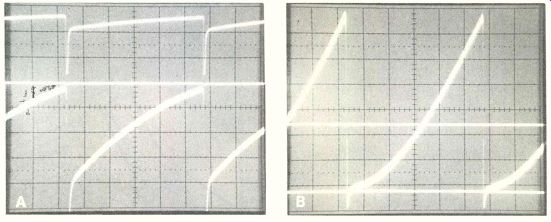
Figure 4---Top waveform of picture A is the usual waveform between grid
and cathode. Lower trace is the same signal expanded by gain of 20 V/div
and with a zero-voltage line added by the scope. During the sawtooth
the instantaneous grid voltage went from about-93 to about-3 V. The B
waveform is the cathode current across the 3.3 ohm resistor with an average-current
line (near center) and a zero-current line added by the scope. The small
negative pulses are not caused by plate/cathode current because control
adjustments did not change the pulse amplitude.
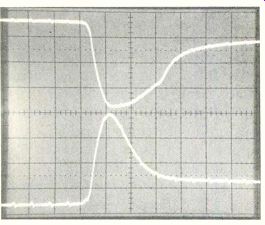
Figure 5---When the waveforms were expanded horizontally by the Tektronix
model T935A scope, the grid pulse at the top was wider than the plate
pulse (bottom trace). This difference indicates the output pulse was
not produced by simple amplification.

Figure 6---Control adjustments changed the pulse amplitude but not the
sawtooth amplitude. Picture A shows the normal output-plate waveform
when the picture had normal height and good linearity. When the height
control was turned fully clockwise and the linearity control was adjusted
for the same total height as before, the waveform (B) showed unchanged
sawtooth amplitude but increased pulse height. The raster was compressed
at the top. For waveform C the linearity control was rotated fully CCW
and the height control was adjusted for a total picture height that equaled
A. The linearity was spread at the top. Therefore, total height (disregarding
nonlinearity) is determined by the sawtooth amplitude and not the pulse
height.
Yoke current
It does not seem possible for vertical tube plate current that varies between zero and positive to produce yoke current that must vary from negative to positive with zero in the center during both trace and retrace. But the two are compatible because the tube cur rent does not drive the yoke directly. Instead either a capacitor or a coupling transformer removes the dc. The sawtooth yoke current is symmetrical. Therefore, in the absence of dc, the zero-current line is exactly in the center.
Effects of controls
At the vertical-output grid, height-control variations changed the amplitudes of both the pulse and sawtooth sections. Adjustments of the linearity control (which changes the grid/cathode bias) moved the zero-voltage line nearer or farther away (less or more negative bias) from the tip of the sawtooth. When the adjustment tried to move the line below the tip (positive grid bias), the sawtooth tip was clipped because of grid-current loading, and the clipping caused bottom foldover on the TV screen.
Wider/narrower pulses
More evidence is found in Figure 5 waveforms where the grid and plate pulses have been expanded by the scope. The grid waveform is much wider, indicating that it originated as a square-tipped pulse.
By contrast, the plate pulse has a sharp tip and the general look of a pulse formed by highly-damped ringing.
Pulses versus height
One of the handicaps of believing incorrect basic theory is that often the wrong parameters are measured, leading to confusion and errors. That can happen if a technician judges the amount of vertical deflection by the amplitude of the total waveform, which is composed mostly of pulses. The fallacy of judging sweep by pulse amplitude is illustrated by the next few waveforms.
Figure 6A shows the normal output plate waveform for a full raster having good linearity. The B and C waveforms have different kinds of poor linearity, but they also have the same raster height as A.
Remembering that all three TV rasters had the same total height, carefully examine the sawtooth amplitude and the pulse amplitude in each of the three scope wave forms. The three sets of pulses have drastically different amplitudes, but the sawtooth amplitudes are the same for all three waveforms.
Therefore, the sawtooth amplitude of the vertical yoke waveform determines the raster height on a TV screen. Pulse amplitude in the combination waveform has no particular significance except that each model has a certain normal amplitude.
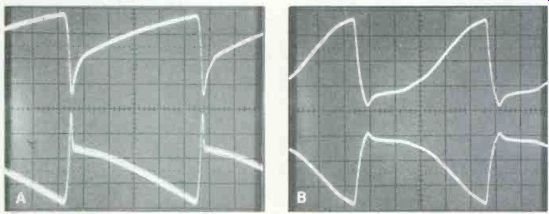
Figure 7 Picture A shows the output tube grid waveform at top and the
plate waveform (bottom trace) when a 60-Hz sine wave was injected at
the oscillator grid. Controls were adjusted for full height with fair
linearity on the TV screen.
Picture B top trace is the grid waveform and the bottom trace is the plate waveform when 60 Hz was injected at the output grid. Height was about 5 inches, but the linearity was severely stretched at the top of the TV raster.
These waveforms reinforce the statement that the sawtooth (not the pulse) determines the height.
60-Hz injection test-A quick test for multivibrator vertical-sweep circuits is to connect a 0.1 capacitor between the 6 V heater voltage and the oscillator grid or the output grid. Normal TVs show some height then, although the linearity is not good and the picture rolls steadily downhill during color programs.
Waveforms for the CTC10 when the sine wave was injected at the oscillator grid are shown in Figure 7. Top trace of Figure 7A is the output-grid waveform while the plate waveform is shown by the bottom trace. Controls were adjusted to obtain full height with fair linearity. Notice that the pulses are small.
In Figure 7B when the sine wave was injected at the output grid, the top trace is the output grid wave form, and the bottom trace is the output plate waveform. The TV picture had a 5-inch height with poor linearity. No pulses are pre sent in either waveform, again proving that pulses are not required for vertical deflection.
Although a 60-Hz sine wave was injected in both tests as a substitute for an oscillator signal, no trace of a sine wave was found at the output plate. Rectification by the first grid it reached changed the sine wave into wide and distorted pulses that were further modified by the wave-shape R/C filters into approximations of the correct output plate waveforms.
Solid-state proof
The output waveforms of solid state vertical systems usually have small pulse amplitude and larger sawtooth amplitude. Some circuits have diodes to clip the pulses (strong pulses can ruin transistors) while others have pulse clipping as a hidden byproduct.
All these items of proof emphasize that the pulses are not essential. In tube circuits, they produce faster retrace, and the high amplitudes are tolerated because they are harmless. The design of solid-state circuits deliberately minimizes the pulses. In all cases, it is the saw-tooth part of the waveform that causes vertical deflection.
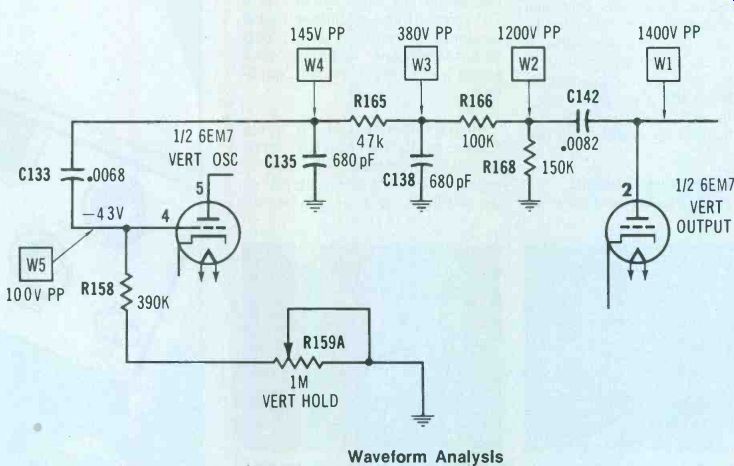
Figure 8 These are the component values and peak-to-peak signal voltages
measured in the positive--feedback path of an old RCA CTC10. Waveform
Analysis
Waveform exceptions
After a thorough study about the distortions of a square wave as it passes through various resistance/ capacitance filters, a technician should be able to follow a schematic and know approximately what the waveshape should be at each point.
However, there are exceptions that complicate the analysis be cause of multiple paths or the unexpected conduction of a diode.
Some examples will be shown in the waveform analysis of vertical sweep.
Vertical-feedback waveforms As previous discussions have settled questions about the proper output waveform at the vertical-
output tube in an RCA CTC10 chassis, the remainder of that sweep circuit will be analyzed, with the emphasis placed on unique waveforms.
Figure 8 shows the positive-feedback path from the plate of the 6EM6 output tube to the oscillator grid. (Of course, both stages make up the multivibrator oscillator. But those labels are easier to keep straight.) The corresponding wave forms are in Figure 9.
W1 waveform has been analyzed before as consisting of sawteeth and pulses.
Capacitor C142 and resistor R168 form a high-pass (low-frequency cut) filter. Therefore, the W2 waveform is similar to W1 except the sawtooth tilt has been removed and the amplitude is slightly lower.
The tilt should be removed at W2 to prevent a problem further downstream. Before the pulse waveform reaches the oscillator, the amplitude must be reduced and all horizontal-sweep pulses removed by low-pass filters. Both are done by the R166/C138 and R165/C135 filters, that incidentally reduce the pulse amplitude more than the sawtooth amplitude. Unless the sawtooth tilt is removed before the low-pass filters, it will be excessive at the oscillator. Those pulses don't contribute any deflection, but they are used for oscillator feedback.
W3 shows the reduced amplitude and the rounded corners produced by the R166/C138 low-pass filter.
Those effects are more pronounced following the R165/C135 filter.
Notice that the sawtooth tilt is more prominent as the pulse amplitude is reduced.
None of these previous waveforms needed zero or average lines. How ever, those lines will be valuable in analyzing W5.
Knowledge gained from square-wave analysis predicts that the W5 waveform should be identical to W4, with the possible exceptions of less sawtooth tilt and the addition of some dc voltages from the grid current. But the W5 waveform seems to be totally different from W4. Common sense cannot explain why it is different.
Oscillator-grid waveform
Positive-going W4 pulse passes through C133 and causes diode-type conduction between grid and cathode. This clamps the positive of waveform zero (Remember, it was started last month that clamping a positive peak produced negative voltage.) Therefore, the trailing edge of the pulse plunges to about-93 V.
Follow this series of actions in WS of Figure 9.
The trailing edge of the pulse in W5 ends at about-93 V. At the grid (after the waveform has passed through C133), it seems logical that the base line between pulses will be flat, because C133 should have removed the sawtooth tilt. However, C133 is too small to hold the charge without loss for the amount of time between pulses. So, C133 discharges through R158 and R159A at a rate that follows the text-book voltage-discharge curve (except it is inverted since the charge is negative.) C133 continues to discharge to a less-negative voltage. At about-16 V, the oscillator barely begins to draw some plate current. If left to itself, the circuit will oscillate shortly afterward, because the oscillator current drives the output, and its pulse in turn drives the oscillator grid. At this time, however, the vertical sync arrives and it forces the output tube into conduction a bit sooner. That starts the regenerative effect. A less-negative oscillator grid allows more plate current which reduces the grid voltage of the output tube. In turn, the reduced grid bias increases the output plate voltage, and it is coupled through the positive feed back loop to the oscillator grid where the rising pulse triggers the oscillator into conduction. This entire regenerative cycle occurs too fast to be seen on the scope, but it ends with a large positive pulse that is applied through C133 to the oscillator grid. In fact, the wave form WS shows that the pulse travels to about +7 V before the grid current clips it. That accounts for the 45 V difference between W4 and WS.
Next, the grid/cathode current clamps the waveform again; the pulse trailing edge goes negative and the slow C133 discharge allows it to drift toward zero volts. This is slightly more than one vertical cycle.
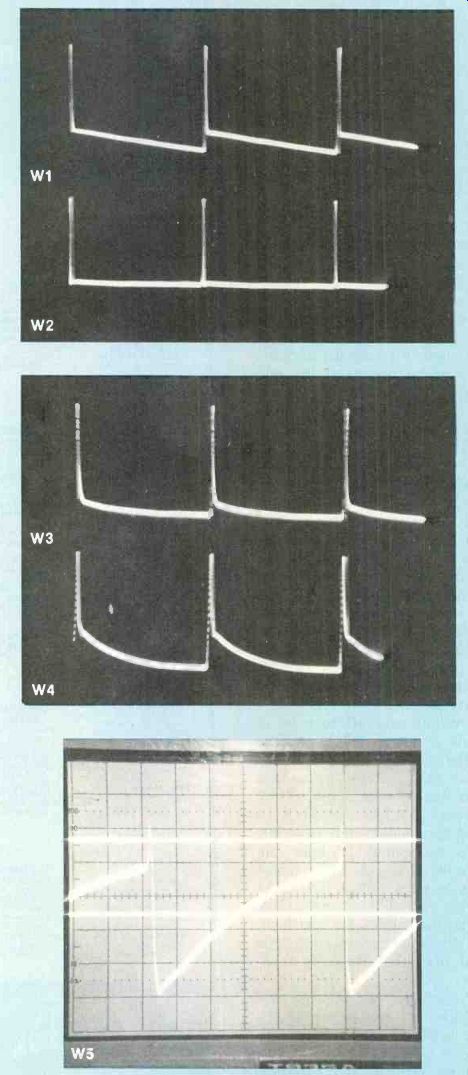
Figure 9 Numbers of these waveforms correspond to Figure 8 schematic.
The Tektronix scope has added a zero-voltage line near the top and the
average-voltage line near the center of the W5 waveform.
Locking
Two conditions must be met for the vertical circuit to lock properly.
The R/C time constant (C133 and R158/R159A) at the oscillator grid versus the maximum negative charge in C133 must be adjusted to cause the oscillator to operate slightly slower than the 59.95-Hz field rate.
Then the sync starts the cycle at the right time for correct locking.
C133 has a fixed capacitance, but the resistance of the R/C circuit is adjustable. This ability to adjust the time constant is necessary because a different pulse amplitude reaching C133 will change the discharge time and thus the operating frequency. Therefore, even a change of picture height varies the free-running frequency.
For example, if the picture is locked and then the height is increased moderately, the negative C133 charge is increased and (if the locking is not tight) the vertical will roll upward very rapidly.
Zero and average lines--The top line in W5 is the zero-voltage line.
Only those pulse amplitudes slightly above and below the line are in the bias range that can cause oscillator plate current. Therefore, all of WS waveform is more negative than cutoff bias except the positive pulse that causes conduction. In turn, the tube conduction produces negative-going pulses (which cannot be scoped directly) at the plate.
The line near the center of waveform W5 is the average-voltage line. It was stated last month that the peak voltage between the zero and average lines equals the de voltage as measured by a meter.
Both the scope and a de meter gave readings of -43 V.
This -43 V of grid bias is not an absolute voltage. It varies with height changes and with adjustments of the vertical-hold control.
In fact, the voltage can be bent a few volts either way by moving the hold control within the limit of the lock-in point. But if the voltage varies because of capacitor leakage, resistor drift or other variables, the vertical-sweep frequency will change and locking will be lost.
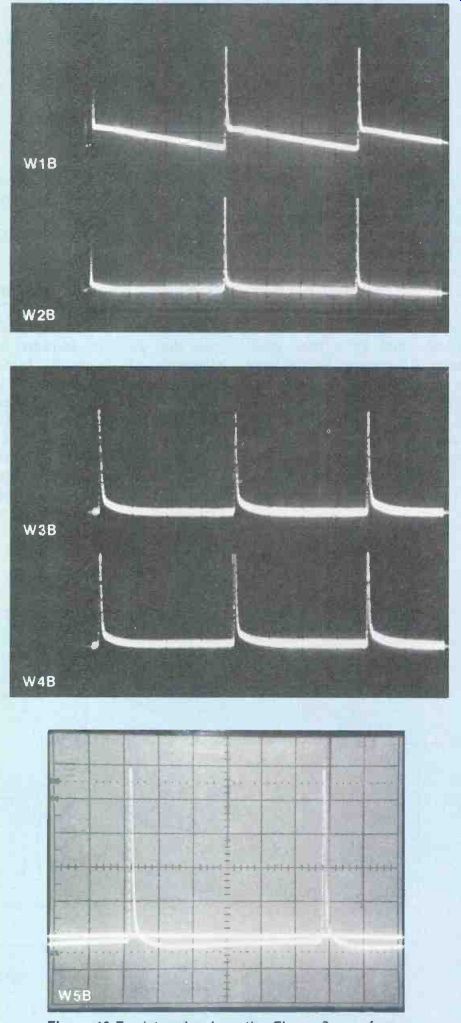
Figure 10--To determine how the Figure 9 waveforms would change if the
oscillator grid current was removed, a separate positive-feedback path
was constructed without any diode at C133. These wave forms follow square-wave
theory for such filters, thus proving that oscillator grid current produces
the unique W5 grid waveform.
Waveforms without grid loading
C142 was disconnected from the tube, and while the TV power was off, positive-going narrow pulses from a VIZ generator were connected to C142 in an attempt to duplicate the normal sweep wave forms (W2, W3, W4 and WS). The experiment was not successful. The waveforms changed according to square-wave theory, but they didn't match the actual ones.
Finally, a separate positive-feed back network was breadboarded.
The values of C142, R168, R166, C138, R165, C135, C133 and R158/ R159A were measured and wired together. The vertical sweep was working normally, and the extra network was connected only to output plate and to ground. All of the W1B through W5B waveforms were measured and photographed (see Figure 10). No tube or transistor was connected to the WSB waveform.
Of course, W1B is identical to the original W1. Other waveforms showed only a slight rounding of the edges, and the pulse amplitudes were much higher than the actual ones. The sawtooth tilt was smaller by comparison with the larger pulses. But the important waveform was W5B. It was virtually identical with the original W4.
Could the lack of a tube grid/ cathode at W5 account for the huge change of waveform? A diode was connected at W5B as a substitute for the oscillator tube, and the new W5B waveform was identical with the original W5. All other wave forms then were identical to their counterparts, including the amplitude.
Therefore, all deviations from the waveforms predicted by square-wave theory were caused by grid/ cathode current of the oscillator tube! Oscillator/amplifier waveforms Figure 11 shows the RCA CTC10 oscillator and power-amplifier circuits that were not included in the schematic of Figure 8. Matching waveforms are in Figure 12.
The W5 waveform in Figure 12 was described previously in Figure 9, where the zero line proved that only the small positive tip provides the low bias necessary for a flow of plate current. The pulse-shaped bias should produce a larger negative-going pulse at the plate. A 100 C resistor was added between cathode and ground, and the W6 waveform scoped across it verified the narrow pulse of current.
However, the W7 plate waveform does not show the predicted pulses.
Instead, the waveform is a combi nation of pulses and sawteeth.
What component or circuit action added the sawteeth?
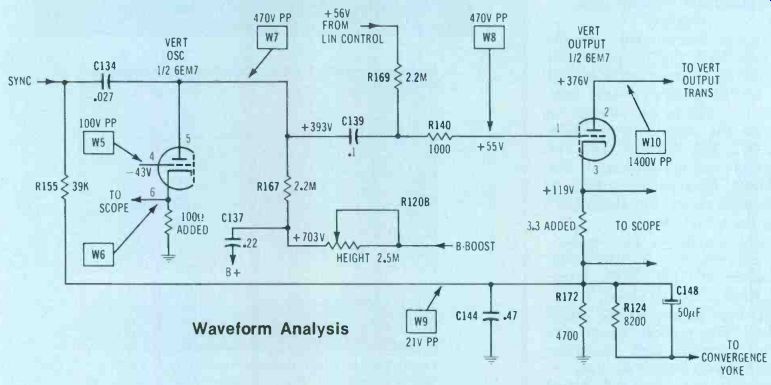
Figure 11--This schematic completes the Figure 8 schematic and shows
the RCA CTC10 amplifying path. Waveform W5 is the same in both diagrams.
Two resistors have been added to permit viewing of oscillator and output-cathode
current waveforms. Corresponding waveforms are in Figure 12. Waveform
Analysis
Creating sawtooth waveforms--A combination of pulses and sawteeth can be obtained as shown in Figure 13 by connecting a resistor and a capacitor in series from the V107A oscillator plate to ground.
To visualize this action the easiest way, imagine that C134 capacitor is shorted which leaves only R155 from plate to ground.
The dc and signal levels are greatly reduced, but the waveform shows negative-going pulses and nothing else.
Next, imagine that R155 is shorted but C134 is okay. C134 is connected from plate to ground, and the pulses are integrated into sawteeth.
Therefore, when both the resistor and capacitor are in the circuit, the waveform is a combination of both pulses and sawteeth. Larger resistor values increase the pulse amplitude, and a larger capacitance decreases the sawtooth amplitude. These values can be varied to obtain the desired pulse/sawtooth ratio.
The actual Figure 11 circuit adds one more function. Filtered vertical sync is injected between C134 and R155, thus the R/C filter does two functions. Negative-going sync enters through C134 to reduce the oscillator plate voltage and control the locking.
Height adjustment---The gain of an audio tube is increased when the plate-load resistance is increased.
Gain of an oscillator (pulse amplifier) is not changed by the plate resistor, but other factors determine the output amplitude as the resistance is varied. In vertical circuits, for example, a larger total resistance from B-boost to oscillator plate decreases the pulse/sawtooth waveform amplitude. And a smaller resistance increases the amplitude. Figure 14 explains the separate actions for pulses and sawteeth.
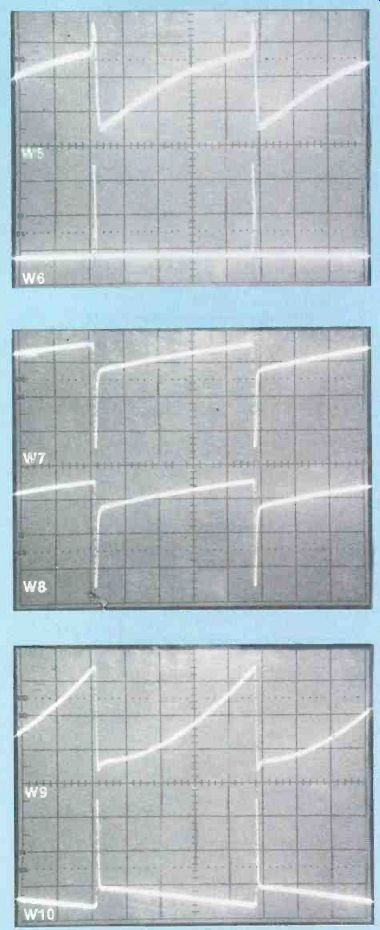
Figure 12 These are the waveforms of Figure 11 schematic.
More waveforms
Waveform W8 (output grid) in Figure 12 is identical to the W7 waveform at the oscillator plate.
Any difference indicates a defect.
C139 coupling capacitor and R169 output grid resistor both have large values, and such a long R/C time constant passes the pulse/sawtooth signal to the grid without tilt or any other significant change.
Bias of the output tube is determined by the amplitude of the grid waveform versus the positive voltage at the grid. This positive voltage comes from the linearity control, and it moves the grid/cathode zero-voltage line nearer or farther from the positive tip of the sawtooth.
These factors determine the flow of output-tube current at the beginning of deflection (top of TV raster).
Incidentally, don't rotate the linearity control any more clockwise than barely enough to provide good linearly at the top of the picture. As the grid-to-ground positive voltage rises, the cathode do voltage rises almost in step. Notice that the cathode-to-ground voltage effectively subtracts from the B+ supply.
Therefore, an excessive linearity setting prevents full deflection at the raster bottom. For a TV that won't quite fill the screen, back off the linearity and increase the height-control setting.
Cathode waveform W9 is almost identical to the cathode-current waveform of Figure 4B. That's because most of the cathode by passing by C148 is through the convergence-circuit resistance. Wave form W10 is the output-tube plate waveform which has been analyzed before.
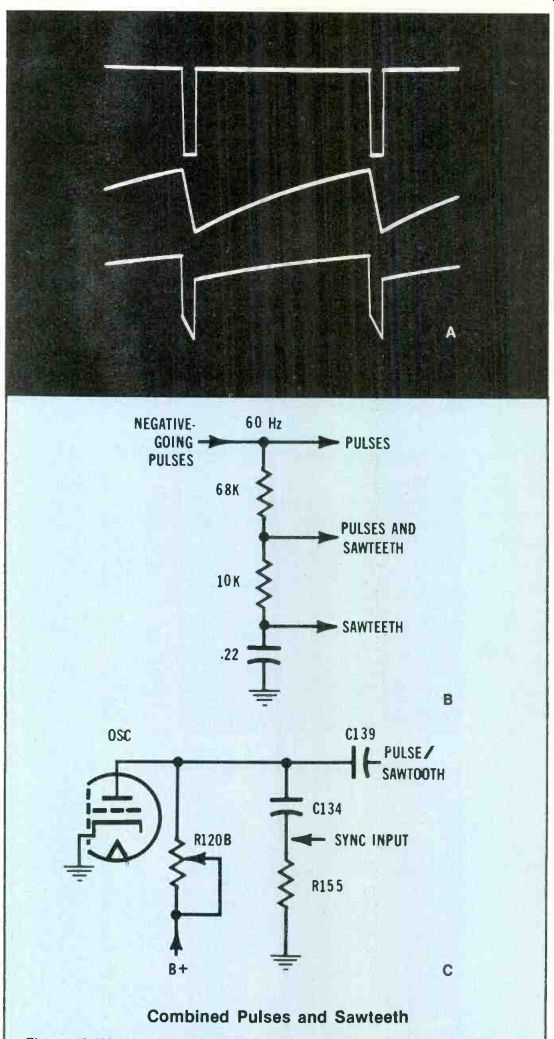
Figure 13---Combined Pulses and Sawteeth (A) Negative-going pulses (top
trace) from VIZ model WA-549A can be changed into sawteeth (center trace)
and combination pulse and sawteeth (bottom trace) by the B schematic.
(C) The CTC10 schematic does about the same as the previous circuit.
However, some of the components are hidden. In effect, the pulse enters
at the cathode, with the plate resistance representing the 68K resistor
of B, while the 10K resistor and the .22 NF capacitor take the place
of R155 and C134.
Therefore, the pulses appear in the cathode current but cannot be scoped anywhere else.
Tips for servicing vertical sweep
Multivibrator-type vertical-sweep circuits have caused many problems for technicians over the years.
Because of the closed loop, the symptoms have been confusing. A bad waveform at one point probably ruined the waveforms at others. Defects that would have reduced the height alone (if the circuit only amplified) also caused a wrong frequency with severe loss of locking. On the other hand, a large change of frequency often reduced the height.
Observant technicians have noticed that linearity and height adjustments often varied the vertical frequency sufficiently to cause a loss of locking. Also, they noticed that defective components far re moved from the hold control produced severe frequency errors that were impossible to correct with the hold control.
Many of these puzzling cases can be explained by a clear understanding of the charging and discharging of the R/C time-constant that is mostly at the oscillator grid circuit.
Any defect of those components changes the operating frequency.
The amplitude of the pulse that charges the time-constant capacitor (C133 in Figure 8) is very critical.
In the previous discussion, it was assumed that the positive-feedback pulse originated at the input end of C133. That's only approximately correct. This amplitude is deter mined by the pulse voltage at the output plate plus all of the components between there and C133.
For example, an open C135 increases the pulse amplitude at C133, which increases the C133 charge. That higher negative voltage requires longer to leak away, so the vertical frequency is reduced (picture flips upward rapidly). If C138 has a leakage of 100K, the pulse downstream at C133 is reduced to about half amplitude. The negative voltage is lower, the frequency is higher and the picture rolls down.
Further complications arise be cause all the positive-feedback components are in series with the input side of C133 during the discharge part of the cycle. Where can C133 discharge to if R168 is open? R165, R166 and R168 all affect the discharge time. That's why a shorted C142 changes the frequency so drastically; it has the effect of shorting out the 150K resistance of R168.
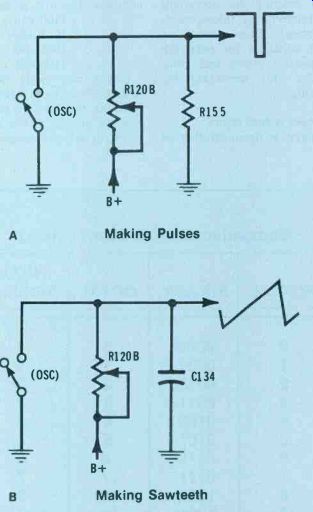
Figure 14---Variations of R120B height control's resistance affects the
amplitudes of both sawteeth and pulses, but the operation is different.
(A) Negative pulses are formed by oscillator tube conduction. When the
tube does not conduct (switch open), the positive voltage between pulses
is determined by the R120B/R155 ratio. Larger R12OB resistance reduces
the maximum positive voltage. (B) Sawtooth amplitude is determined by
the time constant of R120B and C134. When the resistance of R12OB is
increased, C134 cannot charge to the previous higher voltage before the
next cycle begins with tube conduction which discharges the capacitor.
Therefore, the amplitude is smaller.
A Making Pulses
B Making Sawteeth
Heat changes
One of the typical vertical problems is a slow downward movement of the picture after the receiver is thoroughly warmed. A leaky C133 that's sensitive to heat is a likely suspect. Heat it slightly with a soldering iron and then cool it with canned coolant as a test. Don't use an ordinary disc ceramic as a replacement.
Check the positive feedback
Normal amplitude reduction in the positive feedback loop of most vertical multivibrators occurs in several gradual steps. This fact can be the basis for a fast test of the feedback loop, if there is some picture height. Any large amplitude reduction indicates a defect at that point or in a component just upstream.
One prime suspect is any cap-ristor (combination capacitor and resistor). Many have been trouble makers. Replace them with separate components of the same values.
These quick checks plus an understanding of the true circuit operation should make vertical-circuit repairs much easier.
Editor's Note: Similar combinations of updated circuit theory and practical tips should be helpful when applied to other electronic subjects. Send your comments or questions to:
Carl Babcoke
Electronic Servicing
P.O. Box 12901, Overland Park, KS 66212, USA.
Also see:
A second look at waveforms--part 3
A second look at waveforms--part 1
Better waveforms with wideband scopes