Scope waveforms are used to explain problems with slow-recovery diodes, details of varistor rectification, some facts about horizontal drive, plus a passive resistance/capacitance circuit that seems to give a gain.
By Gill Grieshaber, CET
Electronic facts, theories and specific applications are much easier to remember when illustrated visually. Scope waveforms can per form these illustrations in many cases. Two subject areas that need additional clarification are the necessity of fast-recovery diodes and the proper choice of varistors that are used for voltage regulation.
Fast-recovery diodes
Any technician who has installed a 60-Hz supply diode as replacement for a TV video-detector diode knows now that those two types are not interchangeable. Difficulties with other diode replacements are not so easy to solve. These problems have arisen from the universal adoption of horizontal-sweep rectification. Known variously as pulse or scan rectification, the dc is obtained by rectifying a sample of the horizontal-sweep signal.
A 60-Hz diode will become hot and soon short if used for such rectification. Fast-recovery diodes are absolutely essential for use in sweep-rectified supplies. An explanation based on square-wave input signal has been given in Sam Wilson's Technical Notebook of July 1978.
However, the same shortcoming of 60-Hz diodes can be demonstrated also with sine waves where the two peaks are more definite.
Diode switching
The Figure 1 circuit was set up to test the switching of various diodes at different frequencies. Preliminary tests showed most 60-Hz power-supply diodes worked properly up to at least 400Hz. Two frequencies were chosen for the comparison waveforms. They were 15kHz (near the horizontal-sweep frequency) and 150Hz, which was easy to obtain without dial changes on the decade ranges of the VIZ model WA-504B sine/square generator.
------------- All waveforms were taken from a model T935A Tektronix
scope.
Results are given in Figure 1. Two LEDs also were tested. The waveforms resembled those of an old damper diode in photo C, but the voltage yields were much lower.
Clearly, diodes intended for 60-Hz power are not recommended for supplies operating from higher frequencies. But there are more les sons to be learned from the waveforms.
Other diode applications
Don't use a 60-Hz diode to replace a defective one in the signal-rectifying section of any VOM or ac voltmeter that is used to measure audio signals. A slow-recovery diode can cause an error as large as 50% (-6dB) at 20kHz.
Even more important is the selection of diodes used for vertical or horizontal blanking in TV receivers. A slow-recovery diode in those video applications might cause a black or white line to be seen at top, bottom or either side of a raster.
The top trace of Figure 2 repeats the 15-kHz sine wave after it is rectified by the slowest-recovery diode, while the lower trace is the same after the generator is changed to square-wave output. Notice that about 40% of the negative peak remains there-it was not clipped by the diode. If this diode is used to replace a horizontal blanking diode, the blanking would be missing over about 19% of the horizontal cycle. A portion of the left edge of the picture might be too bright or too dark (depending on the exact circuit).
Another critical application involves the so-called bias-blanking diodes at the picture-tube grids in RCA CTC36, CTC38 and others.
Those diodes appear to pass blanking pulses to the CRT grids, thus eliminating any horizontal retrace lines. Instead, the negative-going pulses reduce the grid-to-ground positive voltages slightly during each horizontal-retrace time. If one of these diodes is slow in turning off, the positive trailing edge of each pulse will force its picture-tube grid to become more positive, and a vertical stripe of color will be seen at the left edge of the raster. The tint of the color stripe will indicate which grid is affected.
Incidentally, any defect in one of these diodes brightens that one color in the raster. In other words, a leaky, shorted or open diode will increase the brightness of the associated color. A defective diode at the blue CRT grid will increase the blue in the raster (and the color picture too, of course).
DC voltage from varistors
Varistors have a nonlinear voltage-versus-current relationship. If a varistor voltage is doubled, the current might increase 10 times (varies with type). That seems a bit like a diode, but a varistor has a symmetrical action that prevents diode-like operation. Varistors have no polarity. The same amount of current will flow for a certain positive voltage as for the same negative voltage.
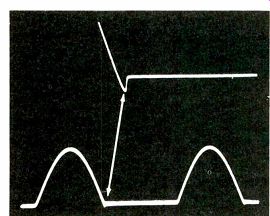
------ When used in the Figure 1 circuit at 150Hz, a slow-recovery
diode wave form shows a tiny overshoot where the descending sine wave
becomes a base line in the lower scope trace. After the overshoot area
is magnified 10 times horizontally and 10 times vertically by the scope,
the top waveform shows that the overshoot is a small area of conduction
into the negative peak before the diode recovers and becomes open. Therefore,
the problem of slow recovery exists even at low frequencies, but it is
not noticeable until the repetition rate approaches the duration of this
undesired diode conduction.

-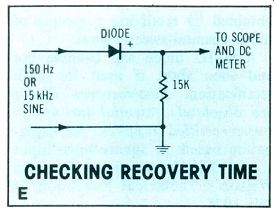
Figure 1---Top waveform of all photos shows half-wave rectification
of a 150Hz sine wave. Bottom trace is the same for 15kHz sine wave. The
percentages refer to the measured dc voltage actually obtained versus
the possible voltage. (A) A top-hat-type conventional 60Hz diode performed
very well at 150Hz (top trace) for a 100% dc output. When the frequency
was changed to 15kHz (bottom trace), the dc voltage dropped to only 60%
of the former reading and the waveform showed substantial conduction
during the negative peak. This diode is not suitable for sweep, scan
or pulse rectification because any conduction during the opposite peak
produces heat. (B) A fast-recovery diode had only a slight pulse at the
15kHz negative-voltage line (bottom trace) and a 96% dc voltage. (C)
An old damper diode gave only 96% at 150Hz (top trace) and 76% at 15kHz
(bottom trace). (D) The base/emitter junction of a silicon diode gave
the best results, with identical waveforms and 100% dc readings. This
is comparable to a video-detector diode. (E) These tests were made using
only a sine-wave generator, a load resistor and the diode being evaluated.
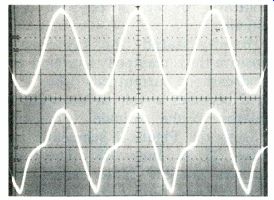
--------- When the slow-recovery diode of Figure 1A was operated from
a 50kHz sine wave (top scope trace), the output showed conduction of
almost the entire sine wave (bottom trace).

Figure 2---The slow-recovery diode response to a 15kHz sine wave (top
scope trace) is compared to a 15kHz square wave (bottom trace). Obviously,
such diodes are not suitable for use in horizontal-blanking circuits.

---------- In this dc-restoration circuit from an RCA CTC36 color
TV, diode X18 must be a fast-recovery type or color stripes will appear
at the left edge of the picture.
According to these facts, dc voltage never should be produced when a varistor is placed in a rectifier-type circuit. Nevertheless, a circuit that produces a negative dc voltage by varistor "rectification" is included in each chassis of many different TV models.
The answer to these opposing facts is found in the input-signal waveform. If sine waves, triangular waves, ramps or symmetrical square waves are supplied to the varistor circuit, no dc voltage will be produced. Only short-duty-cycle pulses can force a varistor to rectify.
Figure 3A is the circuit used to test several parameters of varistor rectification, and Figure 3B shows acceptable results that were obtained when the varistor was matched to the pulse voltage. The zero-voltage line is the horizontal line nearest the top, while the lower line is the average-voltage line. At 50V per scope division, there is about 40VPP between the two lines.
Therefore, the dc voltage from this rectification is about -40V (average voltage is less positive than zero volts); a dc meter measured -38.2 V. This dc voltage proves that some kind of rectification has taken place.
As explained in Part 1 (June), all waveforms have the positive peak above the average-voltage line and the negative peak below it. This average-voltage line is the reference point for any voltage reaching the varistor.
According to the Figure 3B waveform, the positive peak measures 200VPP and the negative peak has 65VPP. Because the positive peak has about three times the negative peak amplitude, 10 to 15 times as much current will flow during the positive peak as during the negative peak.
Compare those figures with diode rectification of a 1000-to-1 current ratio. The varistor operation is about the same as very inefficient diode rectification. (A diode used instead of the varistor in Figure 3A could produce about-200Vdc if the positive peak was rectified.)
Matched components--The Figure 3A varistor must be carefully matched against the coupling-capacitor capacitance and the peak-to-peak voltage from the horizontal-sweep circuit. A large C1 capacitance is necessary to prevent any unwanted tilt and to allow the pulses to pass without much attenuation. If the amplitude at the output of C1 is at least 90% ,of the input, the capacitance value is satisfactory.
A varistor that is too high in resistance will produce insufficient dc voltage. Another varistor of too low resistance also might reduce the dc voltage or produce none; however, the reason for this low voltage is different from that of the excessive resistance. The top scope trace of Figure 3C is the flyback waveform at the input of C1, and the lower trace shows the reduced amplitude from C1 when a low-resistance varistor was substituted. Notice that the base-line ringing is not changed much, but the positive peak has been reduced substantially. This condition produced less than 1V of negative voltage.
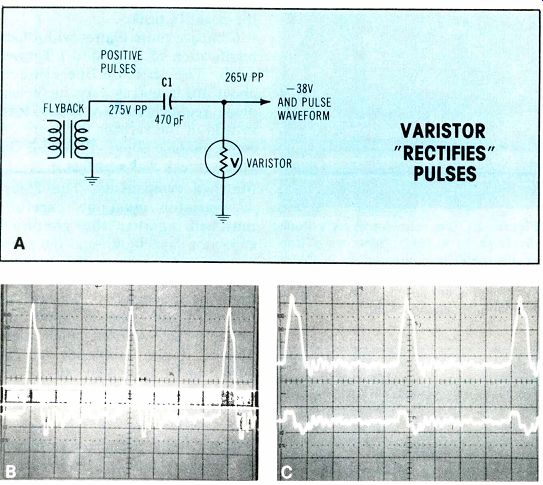
Figure
3---Definite conditions are required before a varistor can produce dc
voltage. The input signal must have pulse waveform. (A) The schematic
is typical of shunt rectification, but the signal is horizontal-sweep
pulses and a varistor is substituted for a diode. (B) The lower horizontal
line is the average voltage of the waveform, and the upper one is the
zero line. When the zero line is above the average line, the waveform
will measure as a negative voltage. Signal of 275VPP produced -38V. (C)
The same 275VPP pulse signal (top trace) was reduced to only 85VPP at
the varistor when a varistor of insufficient resistance was used. Less
than -1V was measured. (D) Another source of 540VPP pulses produced -74V.
Lines on the top trace are the same as for the previous waveform. The
bottom trace is the current through the varistor, which proves more current
flowed during the highest tip.
Varistor current--The Figure 3D waveforms prove that more current flows during the larger positive peak than during the negative peak. Positive horizontal-sweep pulses of 540VPP were connected to the Figure 1E circuit, producing -74Vdc. The two-tipped pulses with zero and average lines are shown by the top scope trace. A 1K resistor was connected between the varistor and ground to provide a waveform of varistor current (bottom trace).
Both average and zero lines are the same, and no dc voltage was measured across the 1K resistor.
Notice that the left tip has maximum current and other positive and negative parts have much less.
Therefore, proper conditions were established for varistor rectification. Of course, the varistors are non-polarized and can be wired with either lead toward the signal.
Polarity of the rectified dc depends only on the pulse polarity. Positive-going pulses produce negative dc, and negative-going pulses produce positive dc voltage.
Horizontal output tube
It is stated frequently that damper-tube current contributes the left half and output-tube current furnishes the right half of horizontal deflection as seen on the picture-tube screen. Although actual circuits do not have equal damper and output-tube conduction times, the saying does clarify the sources of horizontal-yoke current. Therefore, this explanation of the grid-drive waveform will begin with the assumption that output-tube plate current flows for about the second half of each cycle.
In Figure 4A schematic, the 200VPP of oscillator rounded-saw-tooth waveform does not seem to match the-50V of bias (-53V without both scope probes). These conditions are not possible with class "A" amplification. However, class "A" operation would have current flow at all times and that is contrary to the purpose of the circuit.
Briefly stated, the saw-tooth's positive tip is clamped to ground by grid/cathode current flow when the grid becomes a volt or so positive relative to the cathode. (Compare this to the Figure 2 schematic on page 26 in June ES. The two circuits are the same except the grid/cathode tube diode is substituted for the solid-state diode.) Therefore, all of the sawtooth (except the positive volt at the tip) is negative. The sawtooth traces an instantaneous dc voltage that during each cycle varies between-200V at the bottom and about 0-V at the top.
Now, the 6DQ5 tube with a screen voltage of +145V has a plate-current cut-off point between -40V and -50V. Therefore, the tube cannot draw current during the lower -200V to -50V section of the Figure 4B (upper trace) waveform.
About 150V is wasted in obtaining a delayed start of plate current.
Plate current begins at about -50V and increases to maximum current at zero volts (positive tip). From that point the sawtooth drops rapidly down to-200V and the next cycle begins.
In the picture of Figure 4B, the top waveform is the grid sawtooth (50V/division) with the true zero line added by the scope. This waveform does not show where the output tube conducts, but plate current is shown by the lower dual trace. If a line is drawn between the point of the lower trace where the positive sawtooth first begins and the sawtooth grid waveform above, the intersection of line and saw-tooth shows the cut-off grid voltage when measured from the zero line at the top.


Figure
4 (A) This schematic is typical of horizontal-output tube grid circuits.
Dotted lines show how a varistor HV regulator is connected. (B) Top trace
is the 200VPP oscillator signal at the output grid, with zero line added
by the scope. The plate current waveform is shown by the lower dual trace.
(C) These waveforms are the same as those in B, but external negative voltage
from a varistor has increased the dc grid voltage from-50V to -70V. The
instantaneous grid voltage never reaches zero; therefore, the plate current
is lower (bottom trace). Both B and C were made with the same scope adjustments,
so comparisons may be made. (D) To find the grid bias where plate current
begins, the sawtooth was made taller and then the current lower trace was
moved up until the sawtooth slope crossed the current line at the corner where
plate current began. The vertical position of the current baseline shows the
cutoff point was -48V. Careful scope measurements showed retrace occupied
17%, damper current flowed for 28% and output tube current flowed for 55%
of the whole cycle. But, for the trace section of the cycle alone, damper
current flowed for 34% and tube current flowed for 66%. This is not the 50/50
ratio usually stated.
Figure 4C is placed just below 4B so an accurate visual comparison can be made between the two.
Figure 4C shows the effects of HV regulation by variation of the output-tube grid bias, which is explained later.
An easier way of proving the cut-off voltage by using a dual-trace scope is shown in Figure 4D. The grid sawtooth is forced off the screen by a 20V/division scope gain setting and the smaller current waveform is moved up and down by the vertical-centering control until the corner where plate current begins is crossed by the sawtooth line. The voltage can be read from the scope calibrations. In this case the cut-off voltage was -48V.
Varistors control HV
Many of the latest model tube-equipped color TVs included varistors in circuits that controlled the high voltages. As shown by the alternate section of the Figure 4A schematic, positive-going pulses from the flyback were rectified by a varistor. Then the negative voltage from the rectification was applied through isolation resistors to the control grid of the horizontal-output tube where it raised the negative voltage that was produced by grid/cathode clamping of the oscillator sawtooth. Increased negative grid bias limited the maximum plate current, thus reducing the high voltage and slightly narrowing the picture width. HV regulation by this method was adequate, but it allowed more HV variations than did the old 6BK4 circuit.
Figure 4C shows the zero-voltage line in relation to the grid sawtooth.
Amplitude and waveshape were not changed by the added dc voltage.
The lower-trace current waveform shows less current than the normal amount in Figure 4B. This was expected from the bias increase from-50V up to -70V. However, it was predicted that the higher bias would move the point (where cur rent began) to the right on the sawtooth. That point remained at exactly the same location regardless of bias; only the plate current changed. This seemed to be wrong until the screen voltage was measured. With normal-50V at the grid, the screen measured +145V and the HV was 24.5kV. But with-70V, the screen measurement in creased to +205V and the HV went down to 21.5kV.

Figure 5---Positive voltage from a leaking coupling capacitor or a gassy
output tube cancels part of the negative grid voltage and produces clipping
of the sawtooth tip (top scope trace). Plate current (lower trace) flows
for a longer time, thus causing the output tube to overheat. The measured
grid voltage was -40V, or 10V lower.
The increase of screen voltage cancelled the increased negative grid voltage so the point on the grid sawtooth where plate current began remained the same in both cases.
This explains why the screen-grid voltage is not regulated (but is supplied through a dropping resistor); with poor screen regulation, moderate variations of ac and dc grid voltage have no detrimental effect on sweep performance. But with good regulation, an increase of ac or dc grid voltages would cause a white drive line down through the picture near the center.
Positive grid--A common problem with output circuits of this kind is leakage in the grid-coupling capacitor or a gassy horizontal-output tube. Both cases result in a dc grid voltage that is less negative than it should be. Figure 5 shows the clipping of the sawtooth tip when a positive voltage was leaked to the grid, and reducing the grid voltage to about -40V. The flat-topped waveform is typical of an insufficient negative grid voltage. Of course, the output tube draws excessive current and often fails after a time. Receivers having barely enough horizontal deflection before the defect might show a loss of width at the right edge of the picture.
An allied problem occurs when the oscillator plate resistor becomes reduced in ohmic value. Both the dc voltage and the ac waveform at the output grid are too low. The output tube draws slightly excessive current and the horizontal linearity is distorted, usually with a small compression at the right edge of the picture that appears to be a lack of proper width. These symptoms are not very noticeable and they can fool a technician into installing a new set of tubes and hoping the repair will be satisfactory. An analysis of the output-grid wave form is the best method of identifying the problem, since the sawtooth is distorted and the amplitude is below tolerance.
Can an R/C filter give gain?
The conventional way of measuring peak-to-peak voltages with a scope is to measure the total graticule divisions between the highest part of the waveform (tip of positive peak) and the lowest part (negative peak). Usually the two points that comprise the reading are not one above the other (identical time of occurrence) but one happens before the other.
There is one example of a passive filter (without tubes, transistors or any amplifying device) that produces a voltage gain of almost two.
When a square wave (Figure 6) passes through an R/C high-pass filter of the proper values, the output pulses from one peak to the next have about twice the amplitude of the square waves that produced them.
Can you explain whether or not this is a true voltage gain? If so, write to the Editor.
Comments
A rectifier-type circuit with the usual diode replaced by a varistor can produce dc voltage when the input signal has a pulse waveshape.
In order to obtain any usable amount of voltage, the varistor resistance must be carefully matched to the actual pulse amplitude. A diode can supply much higher dc voltages than is possible with a varistor, so it is a fair question to ask why varistors are used in HV regulator circuits. The reason is dependability. A varistor can dissipate a strong single pulse transient (such as a high-voltage arc) without damage. Under the same conditions, a diode would become shorted.
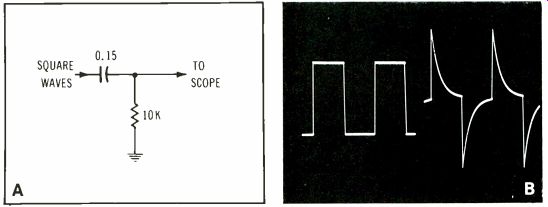
Figure 6---A square wave that is differentiated by the high-pass filter
of A produces pulses that have almost double the total height of the
original square waves (B). Can a filter amplify?
The waveforms were photographed with half of the scope screen covered.
No scope adjustments were made between the photographs. Vertical lines have been added for clarity.
Editor's Note: The profitable re pairs of modern solid-state circuits demand a higher level of awareness about the behavior of sophisticated electronic circuits in addition to help from better test equipment.
These two can be combined in the analysis of scope waveforms. Scopes are universal for any type of electronic circuits. No longer is it sufficient to know the approximate waveshape and peak-to-peak amplitude of the correct signal. The true instantaneous voltage (both ac and dc) must be known. This is particularly valuable when part of a waveform occurs in the cut-off region. A few examples have been given in this 3-part series. Send comments to Editor, Electronic Servicing, P.O. Box 12901, Overland Park, KS 66212, USA.
Also see:
A second look at Waveforms--part 2
A second look at waveforms--part 1
Better waveforms with wideband scopes