8-1. Advantages of the Sweep Method
One of the most frequent uses of signal generators is the determining or checking of frequency response. For radio receivers, the overall frequency response is important because it influences the width of the a-f modulation range available and because the response must meet certain requirements in order to minimize interference. In f-m radio receivers, the shape as well as the extent (width) of the response is important for proper reception. For tv receivers, a wide response, meeting several shaping requirements is necessary for proper reception of both picture and sound. In addition to radio and tv receivers, response analysis is often desired for such components as transformers, filters, and antennas. It is therefore evident how important response analysis is as an application of the signal generator.
There are two ways of obtaining a response characteristic. The first, shown at (A) in Fig. 8-1, is the "step-by-step" method. The signal generator is applied to the device to be tested. Its frequency is set within the expected pass band. An output meter is connected at the output circuit and the signal generator is adjusted until a convenient output indication is obtained. The signal generator is then adjusted for the lowest frequency at which there is any response and the output recorded.
Then the frequency is advanced in equal "jumps" or steps through the response range, and the output for each frequency is recorded. After this data is accumulated, it is plotted on graph paper; the frequency is plotted horizontally, the output vertically. The resulting graph is the response curve.
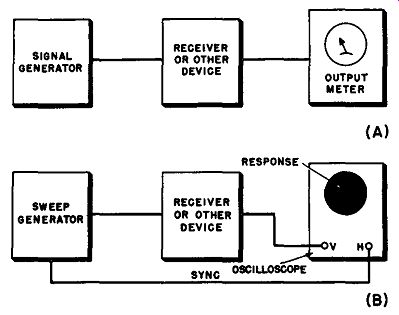
Fig. 8-1. Two ways to obtain a frequency-response characteristic of a device.
(A) Step-by-step method, using individual readings at various frequencies in
the pass band. (B) Sweep method, in which complete response characteristic
is continuously observed on an oscilloscope screen.
Obviously the above operation consumes considerable time. As many as a dozen readings may be necessary. Then, if the response is not satisfactory and alignment is necessary, the curve must be re-plotted each time an adjustment is made. For this reason, the second response-checking method, sweep-generator analysis, has become popular for this purpose. The response curve is then continuously exhibited, and the effect of adjustments observed as they are made.
8-2. Step I - The Horizontal Sweep Motion
The process of sweep-response analysis is best understood by considering separately the two main steps in forming the response image.
The first step is the horizontal sweep action of the oscilloscope beam and its relation to the frequency sweep of the generator.
We have already considered the principles of action of the basic sweep generator (Section 4). We have seen how the generator sweeps the frequency of the r-f carrier signal through a range of frequency over and over in a definite rapid pattern, from the lowest frequency of the sweep width to the highest and then back again. The action is produced through a power line frequency voltage (60 hz in most cases) and thus occurs at the same rate as the alternations of that voltage.
The same voltage which causes the frequency sweep is brought out through a binding post on the panel in most generators. This voltage is applied to the horizontal deflection circuit of the oscilloscope used for response indication. This is the first step, as illustrated in Fig. 8-2.
The sweeping voltage from the generator, sometimes called the "sync" voltage, operates the horizontal deflection system of the oscilloscope, moving the beam back and forth across the oscilloscope screen. The motion of the beam is in synchronism with the variation of frequency in the sweep generator. In other words, when the frequency is just starting to sweep from the low-frequency edge of the sweep width, the oscilloscope beam is at the left side of the screen, ready to sweep toward the right. Therefore, distance along the horizontal sweep path of the oscilloscope beam is proportional to frequency change of the sweep generator carrier. When the deflecting voltage has completed its change from maximum of one polarity to maximum of the opposite polarity, it reverses its direction of change and starts back, causing the oscilloscope beam to start from the right-hand end of the horizontal trace and move toward the left-hand end again. Also, at the same time, the signal generator r-f carrier has reached its highest value and started downward again. As the generator frequency sweeps back again toward the low frequency end of the sweep width, the oscilloscope beam also sweeps back leftward. Thus, if the two are synchronized properly, each point along the horizontal path traced by the electron beam on the oscilloscope screen represents the same sweep generator instantaneous frequency on the return sweep (right to left) as it did on the forward sweep (left to right). It is also possible for the direction of beam travel to be exactly the reverse of that just described, that is, the beam may be at the left-hand end of the trace at the highest instantaneous frequency and at the right hand end of the trace at the lowest instantaneous frequency. In this case the frequency indicated decreases rather than increases as we move from left to right along the forward trace. This may be caused by a reversal of polarity of the sync voltage coming from the sweep generator or passing through the horizontal amplifiers of the scope. In this case, the response curve is merely "flopped over," but its shape is unchanged. In either case. the direction of frequency increase should first be determined by the use of known marker signals so that the response curve may be interpreted correctly.
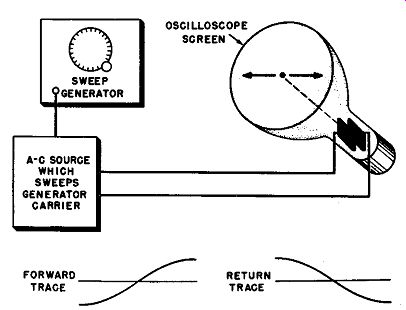
Fig. 8-2. The first step in the development of a response curve on the oscilloscope
screen.
The oscilloscope beam is deflected horizontally by the same voltage that produces sweep in the generator.
The first step in establishing a response curve indication produces a horizontal trace and retrace (which should coincide in the same horizontal line) on the oscilloscope screen. This is shown in Fig. 8-2. Although the r-f output of the sweep generator has not yet been used, we do know that each point along the horizontal trace corresponds to a definite sweep generator carrier frequency, and each time the carrier passes through that frequency the oscilloscope beam will be at that point horizontally. This situation should be pictured clearly in the reader's mind before he proceeds to the next step, which is built upon this one.
8-3. Step 2 - The Vertical Deflection
Next consider the action produced by the connection of the sweep generator r-f output to the vertical deflection system of the oscilloscope.
This is shown in Fig. 8-3. The output of the receiver, receiver section, or other device, is connected to the vertical deflection system of the oscilloscope. The greater the output voltage, the greater the oscilloscope beam deflection in the vertical direction. Therefore, at any given instant, the height of the beam spot above a center reference line is proportional to the output voltage from the receiver at that instant.
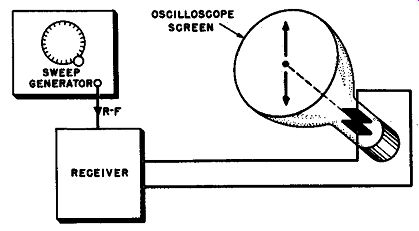
Fig. 8-3. Second step in the formation of a response curve on the oscilloscope
screen, the vertical deflection of the beam spot is by the output voltage of
the analyzed device, such as a receiver.
The output voltage at any given instant is a voltage resulting from the rectification of the i-f voltage at the detector, and is thus proportional to the response of the receiver. This is an overall response through the r-f and i-f sections if the sweep generator is connected to the antenna circuit, or it is an i-f response through the i-f section if the generator is connected to the mixer or first i-f stage.
8-4. Combining the Vertical and Horizontal Actions
Now consider what happens when the actions of step 1 (Section 8-2) and step 2 (Section 8-3) both occur at the same time. The beam spot on. the oscilloscope sweeps across the screen in synchronism with the frequency sweep of the signal generator. At the same time, the beam spot …
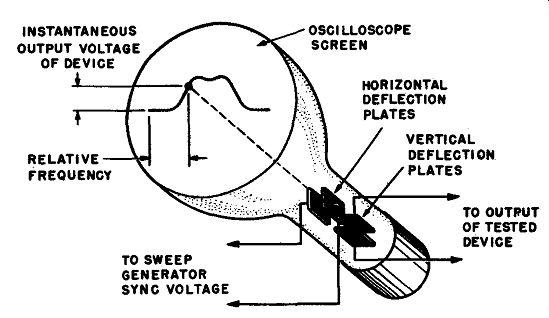
Fig. 8-4. When the two steps of Figs. 8-2 and 8-3 are combined properly, a
response curve is traced on the oscilloscope screen, as shown here.
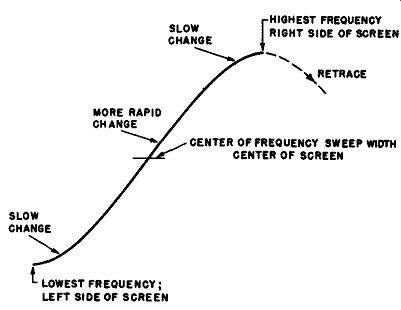
Fig. 8-5. Half cycle of an a-c voltage used to sweep the generator frequency
and deflect the oscilloscope beam, showing actions taking place and how the
rate of change varies during the deflection period.
… is urged upward or downward in proportion to the instantaneous output voltage of the receiver. The result is that the beam spot moves both across the screen and up and down it, sweeping out the response characteristic of the receiver, receiver section, or other device being tested (see Fig. 8-4). Whether the response curve is traced upward (as shown) or down ward depends on the output polarity of the detector employed as well as the direction of vertical deflection of a given polarity signal on the scope used for the test. The same response curve shape will occur in either case except that an inverted response curve may sometimes appear on the screen of the oscilloscope.
8-5. Sweep Waveform
In most sweep generators, the sweep action of the r-f carrier frequency is produced through some a-c voltage obtained from the power line. This voltage has a sine waveform; thus the frequency of the sweep generator carrier varies at a sine-wave rate. This means that the frequency change is most rapid in the middle portion of the trace, and slower near the beginning and end of the trace, as illustrated in Fig. 8-5.
However, since the same voltage that produces frequency sweep in the generator is also used to sweep the oscilloscope beam, the sweep and beam actions both change in the same way at the same time. Therefore, in spite of the non-uniform frequency and sweep variation during each cycle, the fact that both are synchronized results in a linear relation between them. The frequency scale along the horizontal axis is thus linear, and equal intervals represent equal frequency changes. The non-uniform sine-wave variation simply causes the beam to move more rapidly in some parts of the trace than in others, an effect which is negligible in practice, and not noticeable since the sweep rate is fast enough so the trace appears as a fixed image anyway.
8-6. Retrace
After the forward trace of both sweep frequency (from lowest to highest frequency) and oscilloscope beam (from left to right), the sweep and beam reverse and return to the starting point, repeating the action but in reverse order. In other words the return is a continuation of the sine waveform. The values passed through in the last part of the for-. ward trace are repeated, the last value first, the next-to-last second, etc.
Hence, as the oscilloscope beam spot starts back from the right-hand side of the screen toward the left, it passes through the same points it has just passed in the other direction in the forward sweep, and the sweep generator frequency passes through the same frequencies for those points.
Accordingly, any response characteristic which was swept out in the forward trace should be repeated in exactly the same place on the return trace. There are thus ordinarily two traces of the same response curve; but, since they coincide, one is directly on top of the other, and the two appear as one curve.
8-7. Phasing
In Section 4 we discussed the need for a phasing control on a sweep generator (or in an oscilloscope). If the trace and retrace curves do not coincide, this means that the phasing between the voltage which produces frequency sweep in the generator and the voltage which sweeps the oscilloscope beam spot horizontally is not proper. In other words, these actions are not exactly in phase with each other. If there is a phase difference, the points which represent the highest and lowest generator frequencies are not at the ends of the oscilloscope sweep trace, and the trace and retrace curves are in different horizontal positions. How this happens is explained and illustrated in Section 4.
To overcome such a phase difference, a phase adjusting circuit in the sweep generator or oscilloscope is used. This adds reactance to the circuit, usually in the form of a capacitor, so that the phase of one voltage is changed with respect to another. The degree of phase adjustment is determined by a variable resistor, which changes the relative resistance compared to the reactance.
8-8. Blanking
When a response curve is observed by the visual sweep method, the coincidence of the forward and return traces causes one curve (if the phase is correct) to appear, with nothing under it. In other words there is no base line under the response characteristic part of the trace.
Sometimes it is desirable to have a base line under the curve. It can be obtained by blanking. In producing blanking, the signal generator output is cut off during the return trace, and left on during the forward trace. This means that on the forward trace, the beam spot sweeps out the response curve; on the return trace, since there is no generator output, the beam spot is not deflected at all vertically. Since there is no vertical deflection on the return trace, the beam spot traces a straight line which represents zero output, which is thus a true base line. Illustration of blanking and how it is produced in a sweep generator is given in Section 4.