The successful servicing of a television receiver can be summed up in a single phrase: The proper interpretation of what the receiver and your instruments tell you. Learn to use your instruments properly and you have won half the battle; the other half depends upon how familiar you are with the circuit operation of the TV receiver you are working on.
The general approach to the localization of a defect starts first with an examination of the symptoms exhibited by the receiver on its screen. You look at the screen and try to determine in what section of the receiver the trouble exists. You should also try the various operating controls to see what they can tell you; you might visually inspect the chassis, both top and bottom, for any obvious defects such as smoking, charred components, unlit (or cold) tubes, etc.
Up to this point you have not used an instrument; you are simply trying to learn as much as you can about the location of the receiver's trouble from the receiver itself. These preliminary steps should be considered carefully because the conclusions which they lead to will govern the trend of your servicing procedure on this particular receiver. If you start off on the wrong track, you may not discover the error for many valuable hours.
From this preliminary examination your next step is to concentrate on the particular section of the receiver where you believe the trouble exists and to try to narrow the field down still more. As a start, tubes should be checked, either by direct test in a tube checker or by substitution. If these prove O.K., the next step would generally be to check either the wave forms or to make voltage and resistance measurements in that circuit (or section). Thus, normally, it is not until this third step that any equipment is brought to bear upon the problem.
Let us suppose that you wish to inspect circuit waveforms. The instrument to use would be an oscilloscope. The scope power is turned on and the various controls adjusted until a straight line becomes visible across the screen. This procedure was outlined in Section 4. For waveform checking, the oscilloscope uses its own saw-tooth deflection voltage to drive the beam across the screen. The saw-tooth frequency that is chosen will depend upon the circuit in which the instrument is used. In the horizontal sweep system, the frequency of the alternating voltages is 15,750 cycles and the oscilloscope deflection frequency could be set at this value. The result, on the scope screen, would be one cycle of the wave. A more convenient approach is to adjust the scope sweep rate to one half the frequency of the wave to be observed.
For the horizontal system, this would mean 7875 cycles. With this rate, two cycles of the wave will appear on the screen, insuring that every section of one complete cycle is observable.
In the vertical sweep system, the basic rate is 60 cycles per second and an oscilloscope sweeping rate of 30 cycles is recommended. In the sync separator stages, both types of pulses are present and the oscilloscope sweeping rate will depend upon which type of pulse is to be viewed. In the video amplifiers the same situation prevails.
With the oscilloscope in operation, its ground terminal is connected to the chassis of the television receiver. The lead or prod from the vertical input terminal then acts as a probe. In the horizontal sweep system of Figure 1, we might start at the control grid of the 6006-G horizontal output amplifier and if the circuit is working properly up to this point, the waveform shown in Figure 2 would be obtained.
In the cathode circuit, pin 3, the wave should appear as shown in Figure 3.
The preliminary step in waveform checking is a comparison of the shape of the wave you obtain with that shown by the manufacturer. Do the two correspond? If they do, then it is customary to move forward into the following circuit and determine if the proper wave is being produced here. If the correct wave shape is not obtained in the first check, then additional checking in prior circuits would be indicated.
In the circuit of Figure 1, this would mean checking the waveforms at the plate and grid of the 6SN7 horizontal oscillator.
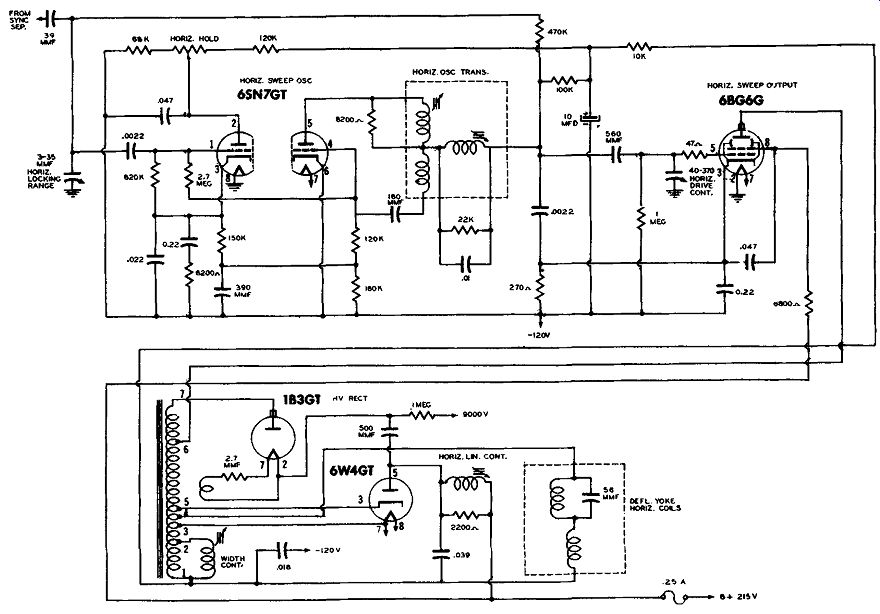
Figure 1. Horizontal Sweep System.
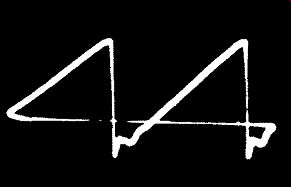
Figure 2. The Waveform Normally Present at the Grid of the Horizontal Output
Amplifier in Figure 1.
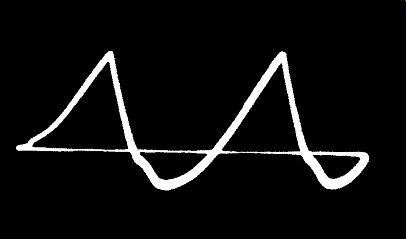
Figure 3. The Cathode Waveform of the Horizontal Output Amplifier in Figure
1.
The second aspect of the wave which is important is its peak-to-peak amplitude. This information can be obtained either from the manufacturer's service manual or from another receiver of the same model which is in good operating condition. In addition, similar sweep systems are employed in a number of different sets and in the absence of specific information, the data obtained from one make set may be used to judge the results in another, similar set. This will do when all other sources of information fail, but specific data on the particular model being worked on should be sought first.
The problem of when to measure the peak--to peak amplitude of a wave is one that often plagues the beginner. In the vertical or horizontal sweep system, it is generally not necessary to check the wave amplitude except at the grid of the respective output tube.
At all other points the serviceman will find that checking wave shape is enough to determine whether or not a circuit is operating correctly. Of course, there are exceptions to this rule, but they will not occur often enough to warrant the peak-to-peak measurement in all instances.
One of the functions of the horizontal sweep system in most television receivers is to produce the high accelerating voltage required by the cathode-ray tube. These voltages are developed during the beam retrace interval when the forward driving voltage is suddenly cut-off. The full high voltage surge appears across the primary of the horizontal output trans former; specifically, in the system shown in Figure 1, the high voltage pulse would be obtained at terminal No. 7 of the output transformer (terminal No. 1 could be considered as the low or ground end of this winding). Since the voltage surge attains a value of 9,000 volts or more, connecting the scope probe to this point would undoubtedly result in damage to the vertical input stage as well as possible injury to the person holding the probe. It is also important that the probe be kept away from the plate of the 6BG6-G output tube since the pulse here is of the order of 6,000 volts or more and this is too high to be taken directly by the oscilloscope.
It is usually not necessary to check the wave forms at either of these two points but should this be desired, it could be accomplished by constructing the capacity voltage divider shown in Figure 4, placing it between the plate of the 6BG6-G and the chassis, and t h e n connecting the oscilloscope probe to point B. Each of the capacitors should be capable of with standing at least 5,000 volts. The ratio of the capacitances is 100 to 1 and the voltages that appear across each unit will be inversely proportional to its capacitance. That means that C1 will get 100 times as much voltage as C2; or, in other words, what appears across C2 will be 1/100 that across C1 and 1/101 of the total voltage.
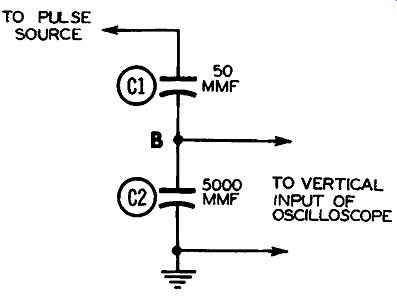
Figure 4. A Capacity Voltage Divider which Can Be Used to Observe the Pulse
Voltages at the Plate of the Horizontal Output Amplifier.
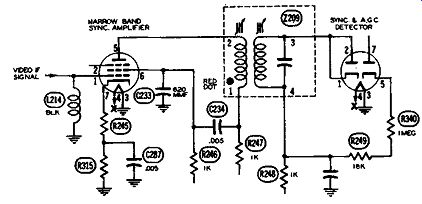
Figure 5. The Narrow-Band Sync Amplifier Used in many DuMont Receivers.
In moving the oscilloscope about from on e circuit to another, careful attention should be given to its vertical gain control. If the gain setting is high and the applied voltage strong , overloading in the vertical amplifier system will result in a distorted wave appearing on the scope screen. On the other hand, if the gain control setting is too low and the applied voltage is weak, you may get so little deflection as to arrive at the erroneous conclusion that there is no signal present at all.
Another factor that may cause wave distortion is spurious signal pickup by unshielded leads. This is especially bothersome in the vertical sweep system where the 60-cycle frequency of the vertical deflection waves is the same as that of the power supplied to the tube filaments.
Reduction or elimination of spurious signal pickup can be achieved by the use of a shielded cable such as RG-59U coax. The center lead is used for probing and the outer conductor connects, at one end, to the ground terminal of the oscilloscope, and, at the other end, to the receiver chassis, The latter connection should be made as close as possible to the point where the probe makes contact with the receiver circuitry.
The one disadvantage to the use of a shielded lead is the additional capacitance it introduces. In resonant circuits or in low capacity circuits, the addition of this capacity can alter circuit operation sufficiently to produce a wave which does not possess the same shape as the wave you are seeking. If you are not aware of what is happening, you can readily conclude that the circuit is not operating properly when, in fact, it is.
There is one example which illustrates this point rather effectively. Many Du Mont television receivers employ a special narrow-band sync amplifier. This circuit, shown in part in Figure 5, receives a portion of the video IF signal, amplifies it, and then passes it on to a separate detector where it is rectified. The transformer (Z209) in this stage is sharply tuned to the video IF carrier, 26.4 mhz and the frequencies immediately surrounding it. The purpose of this arrangement is to pass only those frequencies necessary to reproduce the sync pulses, but to exclude all the higher video frequencies as well as the noise pulses. In this way, better noise-free synchronization is sought.
For the circuit to function properly, transformer Z209 must be correctly tuned, otherwise the set loses sync. Circuit adjustment is determined by using a crystal detector probe to pick-up the signal present at the transformer. The waveform which should be observed on the scope screen is shown in Figure 6.
What it becomes when the crystal probe loads. down the circuit too much is clearly evident in Figure 7.
A lot of valuable servicing time could be lost looking for a non-existent trouble.
The oscilloscope will be one of your most valuable TV receiver servicing tools provided (1)
that you know how to operate the instrument and (2) that you are capable of interpreting the patterns you see on its screen. The previous sections of this guide were designed to help you master oscilloscope operation. To successfully interpret patterns would require a book on television servicing and those readers who have not had this training might refer to the author's "Television and FM Receiver Servicing." A few representative examples will be given here but these will do no more than scratch the surface of this subject.

Figure 6. Normal Video Waveform Seen in Narrow Band Circuit. Courtesy DuMont
Laboratories, Inc.

Figure 7. Waveform at Narrow-Band Sync Transformer when Distorted by Probe
Loading. Courtesy DuMont Laboratories, Inc.
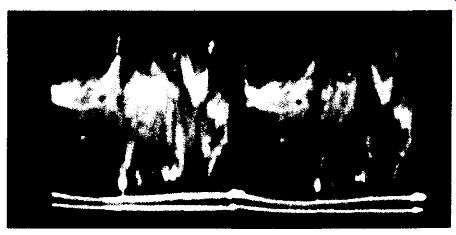
Figure 8. A Composite Video Signal Exhibiting Sync Pulse Compression.
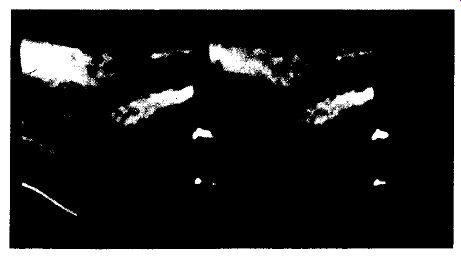
Figure 9. A Video Signal Containing 60-Cycle AC.
A receiver was recently brought into the shop for repair with the complaint that the picture lost vertical sync easily. The picture held in horizontally although the horizontal hold control was found to possess less hold-in range than it normally did.
From these symptoms it was decided to check first the sync separator stages and then the video amplifiers to determine what was happening to the sync pulses. Following this procedure, it was found that the signal at the plate of the first video amplifier appeared as shown in Figure 8. Note that the sync pulses are compressed (they should occupy about 25% of the total signal amplitude), indicating that at some prior point a tube was either being overloaded or one or more of the operating voltages were incorrect. In the present instance it was found that the first video amplifier bias was too high.
Note that all the oscilloscope can do is give you a picture of the conditions existing at that point in the circuit; it can do no more than this. It is your job to interpret what the pattern means.
Another illustration is the one shown in Figure 9. Here the signal has mixed in with it a large amount of 60-cycle hum. This voltage, if it is not caused by stray pickup, usually arises from a filament to cathode leakage in one of the RF, IF or video amplifier tubes.
To find the faulty tube, substitution on a one-at-a time basis is the accepted procedure. Occasionally 60-cycle voltage somehow gets into the a.g.c. network and this, too, can produce the pattern of Figure 9.
While the primary application of the oscilloscope in television servicing is in waveform checking, there are other valuable uses to which this instrument can be put.
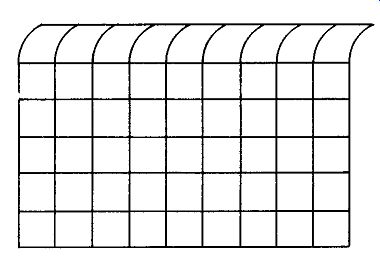
Figure 10. Horizontal- Pull at Top of Picture.
Thus, for example, the following excerpt* from a trade publication indicates how an oscilloscope can be employed to service a TV set with pull at top of the picture.
The set is brought into the shop with the complaint that the upper portion of the picture is pulled to the right. Most of the picture is good but very little pull at the top of a picture is annoying and will always create a customer for the service technician.
* "Servicing a TV Set with Pull at Top of Picture" by H. Allen White, December, 1951 issue of Sylvania News.
In order to have the condition shown in Figure 10, the horizontal deflecting voltage which is scanning the top line must be off by 5 microseconds, the second line is off by a little less than 5 microseconds, and finally, after about 60 horizontal lines have been scanned, the horizontal oscillator is functioning properly and all horizontal lines in the rest of the picture are on time. Assume the scope is connected to the grid of the sweep amplifier, point " B" in Figure 11.
One could expect to see a waveform similar to that shown. Usually, the scope is used with internal synchronization, so that the signal seen on the screen is the one which triggers the sweep oscillator inside the scope and gives a s in g le trace on the screen.
Now, if the signal at "B" is varying in time the scope will tend to keep in step with it and a single trace is still seen on the screen. The pattern would look like Figure 12. If the sweep frequency of the scope would be made constant with no variation, then the sweep signal causing the top line to trace from left to right would be 5 microseconds off compared with those farther down which are in step, and the pattern would appear as shown in Figure 13. The second line would be just a little less than 5 micro seconds off, and the sweep signal on the scope would be just a little to the right of that shown as "top line". Lines 1 through 60 would cause the entire area designated " lines 1 to 60" in Figure 13 to be solidly filled in, giving the appearance of a broadened scope trace.
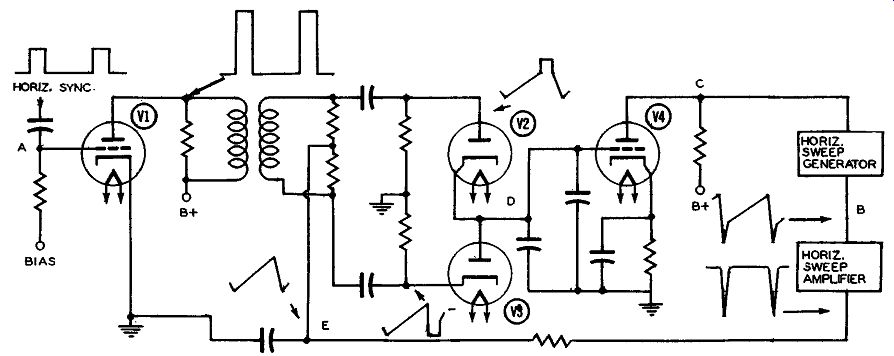
Figure 11.
It should prove interesting to use a scope this way, and actually, it is easy to do. It is merely necessary to make the scope trigger every time the station sends a horizontal sync pulse, keeping in step with the transmitting station--not in step with the signal being fed to the vertical deflection plates of the scope. Most scopes have an "External Sync Input" which is exactly what is needed here. A signal is available, referring to Figure 11, at point "A". Here the horizontal sync pulses have been amplified, clipped and sharpened, and they are exactly in step with the transmitting station. By connecting a lead from point "A" to the EXT SYNC IN connection of the scope and switching the sync function switch to EXT SYNC, then the sweep of the scope will be controlled by the pulses at "A". This means the trace on the scope will start at the correct time as determined by the transmitted signal, and not 5 microseconds off as determined by the signal applied to the vertical amplifier in the scope. This application of the scope is interesting, but more important, it can be very useful.

Figure 12. Pulled Pattern Using Int. Sync.
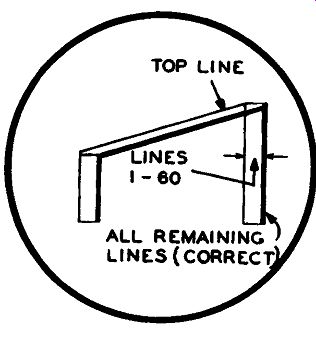
Figure 13. Pulled Pattern Using Ext. Sync.
Our basic trouble is the fact that the horizontal sweep at the top of the picture is 5 microseconds out of step with the sync pulses, and, by using external synchronization, we are able to see this. The trouble may be that the signal on the grid of the sweep amplifier is also out of step. If so, it will appear as shown in Figure 13. This pull may be seen in turn on the grids and plates of the multi vibrator sweep generator.
If so, the trace here too would be broadened 5 microseconds. Finally, at point "C", there should be no AC signal of any kind, but DC only. Likewise, at point "D", there should be no AC, but DC only. Hence, the scope may be used to trace the source of any AC which could be causing trouble. The discriminator circuit shown (V2, V3) is balanced to ground for both AC and DC. The scope connected to "D" would show any AC which could be causing trouble, and a voltmeter would indicate DC. Presence of AC could be caused by unbalance in the resistor divider networks across the diodes, and this unbalance would also cause some DC bias at point "D". The pulled picture must be caused by some 60-cycle AC since the trouble appears at the top of the picture every 1/60th of a second.
The signal is not coming from the power line frequency, or the pulled portion would occasionally appear in other parts of the picture.
In order for the horizontal oscillator to get out of step at the top of the picture, there are two possibilities to consider:
(1) The vertical scanning generator with its heavy cur rent surges could drain the power supply sufficiently to cause voltage to ch an g e on the DC amplifier plate, or on the plates of the multivibrator oscillator; or, ( 2) Some of the vertical sync pulse is appearing on the grid of the DC amplifier at point "D".
The following procedure is suggested to determine which of these two faults is causing the pulled picture.
First, turn down the brightness and disable the vertical scanning amplifier. Check with the scope at point B, still using external sync as described above, and if the pulling has disappeared, then there is feedback from vertical to horizontal by way of the yoke or through the power supply. The discriminator circuit is working properly if the pull has disappeared.
Reactivate the vertical scanning output circuit. Using the scope, look at the signal at point "E". A clean trace should be seen here. A trace varying in amplitude indicates that some vertical is feeding into the horizontal by way of the deflection yoke windings.
This should still cause no trouble at "D" if all components of the discriminator circuit are balanced.
Next, check with the scope for vertical signals in the B+ supplying the DC amplifier and the horizontal sweep generator. Trouble here would indicate deterioration of some power supply electrolytic capacitors as a most likely source of trouble.
In still another servicing job it was found that the picture appeared very weak and it was difficult to hold it in sync. At the input to the first video amplifier the video signal, as viewed on a scope screen, appeared entirely normal. At the plate, the signal was still evident but with greatly reduced amplitude. Since the output of an amplifier should be stronger than the in put, the trouble existed in this stage. A subsequent resistance check revealed that the plate load resistor had decreased from a value of 2200 ohms to about 600 ohms.
The application of an oscilloscope to measure stage gain is one that is frequently overlooked. In the case history just given, a previous voltage check at the plate of the first video amplifier had revealed a slight increase in voltage but because of the low value of the plate load resistor originally, this change was not considered significant. It was only when the oscilloscope revealed the decrease in output voltage over input voltage, that the reduction in load resistor value was brought to light. You will find, as a general rule, that in low impedance circuits, voltage changes arising from resistance increases or decreases are not as marked as they are in high impedance circuits and hence can be readily overlooked.
VTVM APPLICATIONS
The vacuum-tube voltmeter is employed in television receiver servicing principally for voltage and resistance measurements. As pointed out previously there are other measurements that the VTVM can make but voltage (AC, DC, and RF by means of a probe) and resistance measurements represent, by far, the bulk of the uses to which this instrument is put.
In obtaining voltage readings at various points in a television receiver and comparing them with the values specified by the manufacturer, several facts should be known.
1. Are the voltages being taken with respect to the point indicated by the manufacturer?
2. Are you using the same general type of instrument as that used in obtaining the voltages indicated on the schematic diagram?
3. Does the AC line voltage have a value close to that specified?
4. Finally, are the controls set in the same position as they were when the manufacturer measured the indicated voltages?
Voltages are not absolute but comparative values. When you say that the plate of a tube has on it a voltage of 210 volts, you mean it is :no volts positive with respect to some other point. Generally this other point is the chassis but it need not be so.
General Electric, in nearly all of their television receivers, specify that voltages given are with respect to B-. They do this because their television sets (currently, at least) do not use power transformers and the B- line is the reference or return line for all circuits.
In Capehart sets, on the other hand, the statement is made that all voltages are measured from the chassis unless otherwise indicated. The alternate indication are voltages marked with an (x) and these must be taken with respect to the -90 volt line in this receiver. Failure to observe this precaution will give you readings which are 90 volts too low.
The type of voltmeter used to make the measurements will also have a very decided influence on the values which are obtained. A 1000-ohm-per-volt meter, for example, possesses such a low internal i m p e d an c e on the low voltage ranges that it will provide reliable indications only in similar low resistance networks. In all other instances the voltages indicated will frequently be too low to prove of value.
The best instruments to use for all-around service measurements are the 20,000 ohm-per-volt meter and the VTVM. Some set manufacturers specify the use of one meter, some the other. In general, the readings obtained with either instrument will correspond sufficiently close so that, for all practica l purposes, they may be used interchangeably. In most instances higher readings will be obtained on the VTVM by virtue of its usually higher input impedance.
(However, on high voltage ranges it is not unusual for the impedance of 20,000 ohm-per-volt meters to exceed that of some VTVM's.) The source of all the power utilized by the television receiver stems from the AC power line.
And since this is true, any line voltage variations will have a direct effect on the voltages which you find in the receiver. Now, most of us have a deep rooted respect for the prodigious job which is accomplished daily by the local power company and frequently we let this respect carry over into our everyday servicing with the result that we come to believe that when a manufacturer specifies that this set is to be operated from 117 volts, 60 cycles and we plug that set into the nearest outlet, that it is automatically receiving 117 volts. It would be nice if this were true, but unfortunately it is not. While the 60-cycle figure may remain fairly constant, the accompanying voltage value does not and it is not unusual to find line voltages dropping to as low as 100 volts or rising as high as 125 volts.
And this variation will immediately be reflected in corresponding lower or higher DC voltages within the receiver.
Always make a point of checking the incoming line voltage before commencing service work on any piece of equipment. An excellent arrangement, in this respect, is a Variac placed between the line and the set. With a voltmeter permanently installed across the Variac output, you will know at a glance how much voltage is being applied to the receiver. If any correction is necessary, it can be made simply and quickly with the Variac control.
A further precaution to observe when checking receiver voltages concern the settings of the various operating controls. This precaution is necessary because many of the voltages will vary with the control setting and if you make your measurement with the control in one position and the manufacturer obtained his voltage value with the control set in a totally different position, the two readings can be far enough apart to lead you to believe that the circuit is not functioning properly.
The controls whose settings are most frequently specified include the focus, contrast, brightness, hold, size, and linearity controls. The settings, however, will vary from one manufacturer to the next. Thus, Admiral states that the contrast (picture) control should be turned fully clockwise while all the other front panel controls should be set at approximately half rotation. Vertical linearity and height are also set at mid-position. General Electric wants all the controls to be set fully clockwise, while Capehart merely specifies that the controls should be set for a normal picture. Finally, the Philco manual indicates the range of variation for those voltages that vary with control setting. There is no uniformity and each set must be treated differently. The important thing, however, is to be aware of the fact that certain voltages will vary with control settings and to consider this fact when voltage readings are taken.
The more information that is placed in the service manual or on the schematic diagram , the easier it is for the technician to determine whether the values he obtains are correct or not. Unfortunately, however, the serviceman will, in the course of his work, come across many diagrams or manuals that do not contain any specific voltage values. What do you do in these cases? There are several approaches to this situation.
The most obvious one is to rely on your background and past experience. You know, for example, that in a conventional amplifier, the plate is more positive than the cathode or grid while the grid is more negative than the cathode . You also know that when current flows through a plate load resistor, the plate end of the resistor should be less positive than the other end of the resistor. And probably most important of all, you know that the output signal of an amplifier should be larger than the input signal. With an oscilloscope you can determine whether this is actually occurring.
These few facts are merely given to emphasize how much the technician can rely on and should. The fundamental basis of operation of all television receivers is the same and if you know what to expect, from each section of a TV receiver then you are not incapable of servicing a television receiver even without a schematic diagram. But the basic information must be known in the first place.
Other approaches to the problem of servicing a television receiver, without knowing definitely what its normal voltage values are, include:
1. Referring to somewhat earlier models by the same manufacturer about which information may be available.
2. Comparison between the indications (wave forms, voltages) of the faulty receiver and the instruction booklets of other sets (of different make) using similar circuits. This is frequently helpful because of the great similarity between many of today's television circuits. In this respect it is important to note that while the voltages found in different sets usually differ, the voltage differences between the same sections of similar circuits frequently correspond . Check the plate-to-cathode voltage and grid-to-cathode voltage of your set against the corresponding voltage difference in the known receiver and see whether they fall within the same range.
As an illustration, consider the two horizontal oscillator circuits shown in Figure 14. The one in Figure 14A is taken from an Emerson receiver, Model 670B; the other is from a Majestic set, Model 17DA. Both circuits, it will be seen, are closely similar in design, yet the voltages which are applied to the various elements differ considerably. Thus, in Figure 14A, the cathode, pin 6, of V18 is returned to -175 volts; in Figure 14B, the same element in the same tube connects directly to ground. From this casual examination, one might easily come to believe that the voltages existing in one circuit would be of little value in helping the serviceman determine whether the voltages he finds in the other circuit are normal or not.
However, let us disregard the absolute voltage values given and consider, instead, the voltage differences. Between pin 4 and pin 6 of Vl8 in Figure 14A, the voltage present is -60 volts. In Figure 14B it is -55 volts. Back in Figure 14A again, the difference in voltage between pin 5 and pin 6 is + 175 volts; in Figure 14B the same two pins yield a difference of +165 volts.
Could the voltages in this circuit in one set be used as a guide for the other set? The answer is a very definite yes.
In all fairness, of course, it should be mentioned that this procedure is valid only when similar circuits are being compared. But with the current trend in television receiver design, this is far from being an important handicap.
In the vertical and horizontal sweep systems, another valuable guide to the operating condition of the circuit are the peak-to-peak voltages. From these you will learn not so much whether the exact peak-to peak value is being attained, but rather whether the voltage has a value which is somewhere within the range it should be.
The for ego in g are some of the more useful methods of attack that have been successfully employed. It is true that they fall short of supplying all the data desired, but they do offer a basis for comparison and this, at least, is a significant foothold.
AM SIGNAL GENERATORS IN TV SERVICING
Signal tracing, as a means of servicing a receiver, developed in the early nineteen-thirties and once the service industry grasped the significance of this powerful servicing tool, it was adopted whole heartedly. Signal tracing, as its name implies, consists in tracing or following the signal as it travels through the receiver. Failure of the signal to get through any tube or connecting circuit immediately pin points the seat of the trouble and subsequent voltage and/or resistance measurements usually bring the defective component to light.

Figure 14. Two Different Television Receivers Employing Similar Horizontal
Sweep Oscillators. See Text for Explanation of Voltages. (A) Emerson Model
676B, (B) Majestic Model, Model 17DA.
The signal which is followed through the receiver may be obtained from a local broadcasting station or it may be artificially derived from an AM signal generator. The latter approach is generally the mo r e practical one because not only does it provide a stronger signal, but it also provides one which is controllable and thus more easily adaptable to a wide range of applications.
The manner in which a signal generator is utilized for signal tracing in a television receiver can best be understood if we examine each section of a TV receiver separately. In the video amplifier stages which follow the video second detector, the frequency band-pass extends from about 20 or 30 cycles up to 3.0 mhz or beyond. To determine if a signal can pass through these amplifiers, connect a signal generator to the grid of the first video amplifier (and chassis, of course) and set its dial to some frequency between 30 cycles and 3.0 mhz. An audio generator could furnish frequencies between 30 cycles and 20,000 cycles, while an RF generator would be needed for all higher frequencies (say 100 khz and up). When the RF generator is employed, do not turn on the 400 cycle modulation. The RF signal, whatever its frequency, is used unmodulated.
In conjunction with the generator some form of indicator is required. If the frequency of the test signal is low enough, say 15,000 cycles or less, then a VTVM, operating on its AC range, may be applied directly. The VTVM is placed at the output of the video amplifier system--perhaps just before the picture tube--and set to the appropriate AC scale.
The signal generator could then be moved back, stage by stage, until the video second detector is reached and in each instance the VTVM would reveal whether the signal was passing through the intervening stages.
If the signal path was broken at any point, moving the generator beyond that point would automatically pre vent the signal from reaching the meter.
The same arrangement could also be used to indicate roughly the amplification of a video amplifier.
A resistive voltage divider, as shown in Figure 15, is placed across the output of the signal generator and the VTVM is then connected between points A and B. With the signal generator output turned to maximum position, note the VTVM reading. Return the VTVM to the output of the video amplifier system. Then, without changing the generator output level, move this instrument and its voltage divider to the input of the last video stage and apply the signal from point C of the resistive network to the tube grid. This signal is .1 of the value previously indicated by the VTVM. Note what the VTVM reading is now. Then, divide the prese,1t meter reading by .1 of the original VTVM reading and the answer will be the stage amplification.
If there are two video amplifier stages, the signal from point C could be injected at the grid of the first stage and the VTVM reading noted. Again, the ratio of these two figures would give you the overall gain.
To illustrate: Suppose the VTVM indicates .9 of a volt when it is connected between points A and B of the voltage divider. This means that between C and B, there is .09 volts. Now, when the generator feeds a signal (from point C) to the grid of a video stage, the VTVM at the output might record a value of 1.1 volts.
Stage amplification is then or. approximately 12 times.
Since the serviceman is primarily interested in determining whether a stage is amplifying or not, the choice of the testing frequency is not too important.
A 1000-cyclenote might be as convenient as any to use.
To employ the VTVM as is, without any additional components, requires that the test signal have a relatively low frequency. This has already been noted. If for some reason, it is desired to employ a high frequency probing signal, an RF probe will have to be attached to the VTVM and the probe end used to receive the signal. This arrangement would enable the VTVM to serve as an indicator up to several hundred megacycles and this would be useful for checking signals in the RF and IF stages, as we shall see presently.
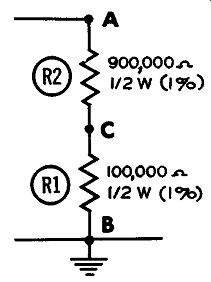
Figure 15.
Before we leave the video amplifiers, note should be made of another indiator that can be used to reveal whether the signal is passing through the video amplifier stages or not. This is the picture tube itself. Whenever a sine wave signal is applied to any point in the video amplifiers, a series of black and white lines will appear on the screen. The number of lines observed will depend upon the signal frequency.
Actually, the number of lines is of little consequence.
What is important is the indication that the signal is reaching the picture tube.
An AM generator, in conjunction with the VTVM can be employed to trace the signal through all of the RF and IF stages. In the RF system, the signal generator is set to the video carrier frequency of the channel to which the set is tuned and this signal is then applied to the antenna input termina ls of the receiver. With the RF probe, we can look for this signal at the plate of the RF amplifier, at the mixer, and in the grid and plate circuits of each of the video IF amplifiers. At each point, as we progress farther and farther into the set, the signal amplitude should increase. A decrease or complete loss of signal at any point immediately warns us of trouble.
The signal can be followed to the video second detector. At the detector, the RF carrier signal is rectified and a DC voltage appears across the detector load resistor. If we wish to trace the signal right up to the picture tube, then the generator output should be audio modulated w h en the second detector is reached. This will provide an audio signal at the detector output and the VTVM can follow this signal through the video amplifier stages to the picture tube.
There are several ways in which the generator VTVM combination can be worked through the RF and IF stages. The method just given is one approach.
Or, if desired, the DC prod of the VTVM can be placed across the video detector load resistor and the readings noted as the signal generator is moved back (toward the front end) of the IF and then the RF stages.
As the separation between the generator and VTVM increases, the DC voltage recorded by the meter should increase likewise.
It is, of course, possible to dispense with the VTVM entirely and use the picture tube as the indicator. All we have to do is start at the final video IF amplifier and gradually work our way back to the receiver front end. As long as we remain in the video IF system, the signal frequency will be that of the video carrier IF; when the RF end is reached, we switch to the video carrier RF. In both instances, however, amplitude modulation of the signal is required in order that after it is detected, an alternating voltage remains which can pass through the video amplifier stages and reach the picture tube.
The audio system can be handled in a somewhat similar manner despite the fact that the sound detector is designed to handle frequency-modulated signals.
Thus, if you apply an AM signal to any of the sound IF amplifiers (at the sound IF frequency) you will hear a 400 cycle audio note from the speaker if the signal is able to pass through the intervening stages. An FM detector ideally would suppress all amplitude modulation in a signal but practically this has never been achieved and some detection of AM signals occurs. Of course, a sweep generator, in which the signal is frequency modulated, would perhaps be somewhat better suited for this task. In this case the 60 cycle sweeping voltage would produce a 60-cycle speaker output.
It should be understood by the reader that each of the foregoing suggested applications of the AM signal generator is designed to indicate to the service man whether or not a signal can get through the various stages through which it is passed. The tests are admittedly rough ones, since they will not reveal whether the stage is properly aligned or whether the signal suffers distortion as it passes through. It will m e r el y indicate whether or not a signal can pass through and from this information the assumption can be made that a similar video or audio signal will do likewise. Whether distortion is introduced remains to be seen when the proper signal is re-applied to the set.
MEASURING RECEIVER SENSITIVITY
The sensitivity of a television receiver is an important consideration, especially when the set is to be used in weak signal areas. A set may be properly aligned and yet due to the poor operating characteristics of one or more tubes, may be far below its normal sensitivity. Moderate strength signals, which should provide clear, noise-free reception will instead produce weak snowy pictures, leading to customer dissatisfaction with eventual loss of business to the serviceman. Sensitivity data of a receiver can also be employed by the serviceman to determine whether a set is operating normally or whether some defect, not readily apparent or revealed by the usual servicing tests, exists in the receiver.
Sensitivity and band pass are the two operating criteria by which all television receiver s can be compared and it behooves the serviceman to be able to determine each. Band pass can be checked by one of the methods outlined in Section 6 or by carefully examining a received test pattern.* Receiver sensitivity measurement requires an AM signal generator and either a VTVM or an oscilloscope and it is performed by one of the following methods.
*See the author's "Servicing TV In The Customer's Home" published by Howard W. Sams & Co., Inc.
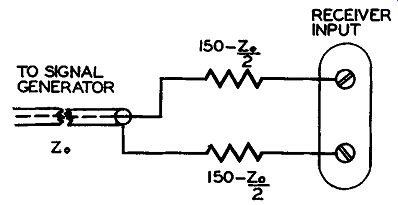
Figure 16. Dummy Antenna Connection for a Signal Generator.
(A) Connect an AM signal generator to the antenna input terminals of the receiver, matching the generator to the receiver with a resistor network.
See Figure 16. The value of each series resistor, R1 and R2, is equal to 150 ohms less one-half of the generator's output impedance. Thus, if the generator impedance is given as 50 ohms, R1 and R2 would each be 150-25 ohms or 125 ohms. The value of R1 and R2 plus the 50 ohms output impedance of the generator equals the 300 ohms input impedance of the receiver. Hence, the system is matched.
The next step is to connect an oscilloscope across the signal line going to the picture tube { either grid or cathode, as the case may be). Short out the a.g.c. line to the chassis and turn the contrast control for maximum sensitivity {fully clockwise). Then set the signal generator for 30% modulation at 400 cycles, tune it to the mid frequency of the channel being checked, and rotate the fine tuning control for maximum output.
Adjust the generator output to produce a 20-volt peak-to-peak sine wave on the scope screen. When this has been done, note the microvolt output from the generator. For a sensitive receiver this will be less than 50 microvolts on the low channels and somewhat greater on the high channels.
(B) An alternate procedure which is frequently employed is to leave the AM generator set up as indicated ( with no modulation) but to substitute a VTVM for the oscilloscope. The VTVM is not connected to the output of the video system, but across the video detector load resistor. The unmodulated signal gene r at or output is then adjusted until the VTVM indicates a 1-volt DC reading.
In this second method, the a.g.c. line is also grounded to the chassis and the contrast control run wide open.
It is possible to determine the sensitivity of the video IF system separately, should this be desired.
Connect the AM signal generator to the grid of the mixer tube through a 1000 mmfd capacitor . The generator frequency is set to a mid IF frequency.
Thus, if the video IF range is from 21.75 to 25.75mc, the generator setting would be at 23.75 mhz. The signal is unmodulated.
Again the a.g.c. network is disabled by grounding and the contrast control (if it is in the video IF system) is turned to maximum clockwise position. A VTVM is connected across the video detector load resistor.
Then, the AM generator output is adjusted until 1 volt is indicated on the VTVM. Typical signals required from the generator range between 200 to 300 microvolts.
SIGNAL GENERATOR CALIBRATION
While the foregoing sensitivity measurement procedure is straightforward, there is only one drawback so far as the ordinary service shop is concerned.
No signal generator having a calibrated output attenuator is available . This being the case, how can receiver sensitivity be measured? There are two approaches to this problem. If you are fortunate enough to know someone who has a calibrated AM generator, then you can calibrate your instrument against his. The procedure is quite simple.
Set up the calibrated generator according to one of the sensitivity procedures just outlined and note how much signal is required from the generator to produce a 1-volt reading on the VTVM at the video second detector. ( If desired, the scope positioned at the output of the video system could be employed instead. In this case, a 20-volt peak-to-peak reading is required and the signal should be modulated.) The calibrated generator is then removed and your unit substituted instead. Adjust its output until the same meter indication is obtained. Record the setting of the attenuator controls of your instrument on a chart because at this point the circuit is receiving as much signal as it did from the calibrated generator.
Similar calibration can be carried out over a range of attenuator control settings and at various frequencies.
When you have no access to a calibrated generator, you cannot determine the exact sensitivity of a receiver. But you can obtain its relative sensitivity.
Every time you get a receiver in your shop, measure its sensitivity by noting at what position of your attenuator control 1 volt is produced on a VTVM collected across the video detector lo ad resistor.
Keep a record of your results, and after you have performed this test on a dozen receivers, you will be able to judge with a fair degree of accuracy whether or not a set is sensitive. You will know, for example, that when 1 volt is produced by attenuator setting below a certain value, that the set will operate with weak signals. But when the attenuator must be turned up to produce the same reading, that the set requires a much larger input signal to develop a good picture.
If you classify your information by sets, you will not only come to know what to expect of any given model, but also to recognize when this set is operating below its customary sensitivity. Information such as this can be of invaluable assistance.
IN CONCLUSION
The application of test instruments to television and FM receiver servicing has been covered in part in this section and in part in each of the previous sections. Undoubtedly there are many additional ways in which these instruments can be used, but the ones chosen were those which have been found to have the greatest usefulness in every day servicing.
Illustrations of current test instruments were used freely throughout this guide to acquaint the reader with those instruments which he is most likely to meet in every day work. The author is indebted to the various manufacturers for their generous assistance in supplying photographs and operating manuals and to their engineering staffs who provided additional data on instrument characteristics and applications.
The author would also like to express his thanks to his associate, Donald F. Blood, for proofreading portions of the manuscript and making many worth while suggestions, to Central Television Service of Chicago and their men, and to the Howard W. Sams organization for their enthusiastic endorsement of the entire project. Without this encouragement, it is doubtful whether this guide would have appeared at this time.