Troubleshooting -- Repair
Interpreting test patterns -- Alignment
9-1 The troubleshooting and repair of television receivers is a task requiring considerable skill. It should not be attempted without careful preparation. With a basic knowledge of television circuit design, and by application of systematic methods of service and use of proper test equipment, no real difficulties should be encountered.
The servicing of television receivers can be broken down into three separate operations:
1. Troubleshooting, 2. Checking and Adjusting, and 3. Alignment.
Troubleshooting is the determination of what is wrong with the receiver. Before repairing, adjusting, or aligning a receiver, the trouble must be isolated to a particular stage, and if possible to a particular component. Because of the complexity of a television receiver, troubleshooting procedures must be carried out in a systematic, organized fashion; otherwise, considerable time will be wasted in probing aimlessly from one circuit to another. Experience in servicing television receivers for the past few years has indicated that the majority of faults can be located quicker without test equipment and without the need for readjusting or aligning the circuit, if logical troubleshooting methods are used.
After a repair has been made, it is usually necessary to make one or more adjustments. For example, if the linearity control in the vertical sweep circuit is replaced, it must be adjusted to give a picture of proper vertical linearity.
The alignment of television receivers generally refers to the tuning of the amplifiers in the RF, video and sound circuits.
These circuits operate at high frequencies and their alignment is critically affected by component or wiring changes. Realignment is often required when a tube is replaced or because one of the fixed components has changed in value.
9-2 Test Equipment. Several pieces of test equipment have been developed for television servicing in order to simplify the task of troubleshooting, adjusting, and aligning. The operation and function of each of these instruments are described in detail in the Test Equipment section. It is well, at this point, to briefly outline the test equipment which applies to the three categories of television servicing.
For troubleshooting the receiver, a cathode-ray oscillograph is the most useful and versatile piece of test equipment. Discontinuities in circuits can be checked and the shapes of the various waveforms can be observed on the oscillograph. By recognizing certain characteristic oscillograms, the technician can readily determine the cause of a fault in a circuit.
A vacuum tube voltmeter is another useful instrument for troubleshooting. All operating voltages in the receiver may be checked with it to determine whether the power supplies are functioning properly and whether a faulty component is responsible for the wrong potential at a certain point in the circuit.
Shorted or open components and faulty wiring are best located with a multimeter. Other useful instruments for troubleshooting are a voltage calibrator for the oscillograph, a kilo-voltmeter for checking the high voltage power supply, a tube checker, and a resistance-capacitance bridge for testing critical components.
Most adjustments to the receiver can be made while observing a test pattern that is transmitted by a television station. When such a pattern is not available, it is possible to make most adjustments with a signal generator, oscillograph, square wave generator, and a vacuum tube voltmeter.
Three pieces of test equipment are basic requirements for alignment. They are a sweep frequency generator, an oscillograph, and a marker generator.
In addition to the instruments listed above, there are several accessory devices which are now available for television servicing. Although not essential, they often greatly simplify the problems of servicing. Into this category fall such instruments as grid dippers, Q-meters, and cross-hatch generators.
TROUBLESHOOTING
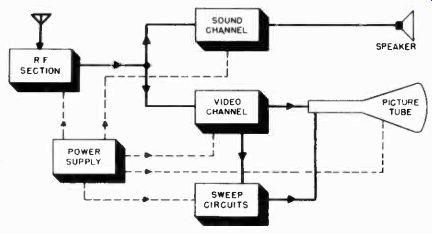
Figure 1. Block diagram of six basic sections of television receiver.
9-3 In order to approach the subject of troubleshooting with logical and well coordinated procedures, the television receiver is broken down into six sections, each of which has characteristic faults. By first localizing the trouble to one of these sections, the technician will save considerable time and effort.
Figure 1 shows a block diagram of the television receiver divided into these six sections:
1. The R-F Section, 2. The Sound Channel, 3. The Video Channel, 4. The Sweep Circuits, 5. The Picture Tube, and 6. The power supplies.
The heavy lines and arrows on the block diagram indicate the paths of the television signals as they travel through the receiver. This diagram emphasizes the fact that a television receiver is actually made up of several sections, each of which can be considered to operate almost independently of the other. If the fault can be isolated to one of these sections, there is generally no need to work on the other sections. The following discussion will help clarify the reasoning upon which this method of fault isolation is based.
1. The signal enters the R-F Section and branches out into the Sound Channel and the Video Channel. If poor sound and picture exist, it is probable that the fault lies in the R-F Section, because after this point the signals are separated.
2. When the signal branches off to the Sound Channel, it passes through several audio stages which make up an independent FM receiver, except for being connected to the common power supply. If trouble exists only in the sound, the Sound Channel is the logical section of the receiver to troubleshoot first.
3. The output of the R-F Section is also fed to the Video Channel. Here again a separate amplifier system is used to amplify the video signals. If the sound and all other sections of the receiver appear to be operating correctly, the trouble probably exists in the Video Channel.
4. The amplified video signal is fed to the Picture Tube and the Sweep Circuits. Certain troubles in the Picture Tube circuits can be recognized readily by watching the picture. For example, a misaligned yoke or focus coil causes characteristic distortions of the picture.
5. Since the video signal is fed to the Sweep circuits to synchronize the sawtooth deflecting signals, the Sweep Circuits will be partially interdependent with the Video Channel. If the picture is synchronizing well and scanning trouble exists, the fault is usually accredited to the Sweep Circuits.
6. The Power Supply affects all the other sections of the receiver. If the receiver is completely dead, the trouble usually can be traced to the Power Supply. Other Power Supply faults will show up in a characteristic manner in other sections of the receiver, as will be described later.
While it is not always possible to treat each section of the receiver as a unit operating independently of the others, the majority of faults can be isolated in this manner. When more than one section appears to be contributing to the trouble, the technician must attack each suspected section in logical order.
Several typical examples of the methods of fault location just described follow:
1. Assume that sound, but no picture can be received from all stations.
2. The intensity control should be turned up to see if there is a raster. If the raster is present, there is nothing wrong with either the vertical or horizontal sweep circuits, or with the power supply. Since the sound channel is working properly, the trouble must be in the picture channel.
3. The next step is to tap the grid of the video amplifier. If white bands appear on the screen of the picture tube, the video amplifier is functioning properly. Therefore, the trouble must be in the picture IF section. (The RF channel must be operating properly because sound is being received.)
4. Having isolated the fault to the picture IF channel, the tubes in this section should be checked. If the trouble is not the tubes, the next approach is to feed a modulated signal into the grid of each IF stage and note the output on an oscillograph.
The faulty stage in the section can be located in this manner.
5. Once the trouble has been tracked down and corrected, the receiver should be tried immediately.
If it is assumed that in the previous example no raster was observed when the intensity was turned up, but that instead a spot appeared on the picture tube, the trouble would then not be in the picture channel. In all probability the trouble is not in the sweep generators because neither vertical nor horizontal sweep is present. It is probably in the power supply which furnishes plate and screen voltages to both of the sweep generators. The rectifier tube and other components in the power supply should be checked. If a component has not failed, a check should be made for an open circuit.
As another example, assume that when the intensity control is turned up only a horizontal line is observed. The place to look for the trouble, in this case, would be in the vertical sweep generator; or conversely, if a vertical line is observed, in the horizontal sweep generator.
These examples will serve to illustrate how a visual analysis of the receiver assists in the isolation of faults. By recognizing the characteristic troubles of the various sections, the technician will develop similar fault isolation techniques of his own.
9-4 Other Troubleshooting Techniques. Much of the technician's work in troubleshooting television receivers can be simplified if he fully understands the significance of the test patterns transmitted by stations. A thorough familiarity with these patterns will enable the technician to recognize the majority of receiver faults in a matter of minutes. A complete analysis of test patterns is presented later in this section.
Another approach to troubleshooting is the signal tracing of the receiver circuits with a cathode-ray oscillograph. This method is particularly useful in checking the sweep section when visual analysis indicates this section is at fault.
-------
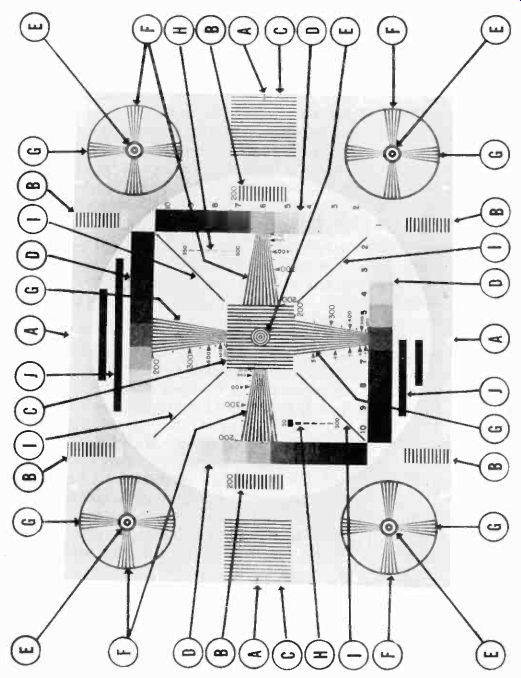
Figure 2. The R.M.A. Standard Test Chart. The call-out letters identify the
geometric designs which are used to check the following: OA Vertical and Horizontal
OF Vertical Resolution.
Size and Aspect Ratio.
Vertical Linearity.
Horizontal Resolution.
Horizontal Linearity.
"Ringing" or Damped Oscillations.
OD Contrast and Brightness. OI Interlacing.
EO Spot Size and Focus.
JO Low Frequency Phase Shift.
The checking of tubes and voltages is the best approach to tracking down trouble after it has been isolated to a stage in the receiver. The manufacturer's literature often contains the approximate voltages which should be present at various points in a receiver when it is operating properly. By comparing measured voltages with those given by the manufacturer, the technician can locate faulty components. Resistance and continuity checks will also usually turn up faulty components in a circuit.
After the trouble has been isolated and corrected, one or more of the adjustment and alignment procedures described later in this section may have to be carried out in order to put the receiver back into perfect working order.
9-5 Troubleshooting with Test Patterns. For several minutes before each broadcasting period, and at intervals as long as several hours during the day, each television station transmits a test pattern which displays the station's call letters. The test pattern contains geometric designs which are very useful in troubleshooting and adjusting receivers and installations. In the succeeding paragraphs, the significance of the features of the various test pattern designs which are in common use are discussed. Following this discussion there is a group of typical test patterns, as they appear on the television screen. They illustrate a major portion of the faults which the technician is likely to encounter in troubleshooting and servicing television receivers and installations. Each test pattern is accompanied by a description of the faults which cause it to appear.
9-6 The R.M.A. Test Pattern. In order to assist in standardizing the performance of television transmitters and receivers, the Radio Manufacturers Association has designed a test pattern which it recommends for use in testing television equipment.
This pattern is shown in Figure 2. It is considerably more complex than the test patterns which are transmitted by television stations, but an understanding of its design will enable the technician to make use of any type of station test pattern. For purposes of explanation, "call-out" letters have been marked on the R. M.A. pattern to identify its important features. A key to these letters is given below the pattern and a more detailed description of the various geometric designs follows.
9-7 Vertical and Horizontal Size, and Aspect Ratio. The test pattern which is transmitted by the station has an aspect ratio of 3 to 4. To make certain that the scanning circuits are correctly adjusted in the receiver so as to reproduce the pattern in the same aspect ratio, four crosses (A) are marked on the R.M.A. test pattern. These crosses, two black and two white, are located at the center of each edge of the chart. The height and width of the received pattern should be adjusted so that the white crosses touch the top and bottom of the mask opening and the black crosses touch the left and right sides. The correct picture size and aspect ratio are then obtained on the receiver screen.
9-8 Vertical Linearity. The vertical linearity is adjusted with reference to the six groups of horizontal lines marked (B). The linearity should be adjusted for equal spacing between the lines.
Note that the vertical linearity lines do not extend continuously from top to bottom, but appear in three groups at the top, center, and bottom. The lines could have extended the full height of the pattern. This was not done in order to minimize confusion. It is necessary only to adjust the vertical linearity for equal distribution of the lines in each group. The scanning lines between each group will then be linearly displaced, unless the vertical sawtooth voltage has an irregular shape an unlikely condition.
9-9 Horizontal Linearity. The vertical lines in the three groups marked (C) are used to check the horizontal linearity. If the horizontal linearity controls in the receiver are correctly adjusted, the lines in each group will be equally spaced.
9-10 Contrast and Brightness. The four groups of squares marked (D) are used to measure the ability of the receiver to reproduce a picture of good contrast and illumination. They also help to correctly set the contrast and brightness controls. The squares are numbered from 1 to 10 and extend from pure white through several shades of gray to the tenth square, which is black. An ideal receiver will enable the viewer to distinguish each of the ten squares in the gray scale. The quality of the receiver is measured in terms of how far up on the gray scale the squares can be distinguished. When making this measurement, the contrast and brightness controls should be adjusted for maximum contrast between adjacent squares, as well as for even illumination of the grey background of the pattern.
9-11 Spot Size and Focus. The small, white dots (E) at the centers of the five bulls-eyes on the R.M.A. pattern are provided to make possible the checking of the spot size and shape of the electron beam in the picture tube, and to help focus the image. The focus control on the receiver should be adjusted to obtain the roundest and sharpest white dots possible. If the receiver is equipped with an astigmatism control, the control should be adjusted with the focus control to obtain a round, sharply focused spot.
9-12 Vertical Resolution. Vertical resolution is expressed as the maximum number of evenly spaced horizontal lines which can be resolved on the test pattern. The horizontal wedges marked (F) are designed for the measurement of vertical resolution. The wedges are calibrated with numbers from 200 to 600. If the horizontal wedges are distinct all the way across the point marked 600, the picture is said to have 600-line resolution.
Lower resolution is indicated by a blurring of the narrow part of the wedge. For example, if the lines are distinct only half way across the horizontal wedges, the picture has 300-line vertical resolution. The significance of this figure, which expresses the degree of vertical resolution, is explained by the manner in which the wedges are calibrated.
Although there are 525 scanning lines in the television picture, only about 93% (490) of these lines are visible in the picture. The other seven percent are blanked out during the vertical blanking period. If the electron beam in the picture tube can be focused to a spot small enough to trace out 490 lines without overlapping, the maximum vertical resolution will be 490 lines. In other words, the present 525-line television system is only capable of 490-line vertical resolution. In actual practice, the vertical resolution is even less. It should be noted that the R.M.A. test chart indicates 800-line resolution which is more than the present television system can reproduce.
The vertical resolution, as measured on the test pattern, is determined mainly by the size of the spot on the picture tube screen. It is not affected by the low or high frequency response of the receiver. The construction of the electron gun in the picture tube and of the focusing system are the principal factors which affect spot size.
9-13 Horizontal Resolution. Horizontal resolution is dependent upon the spot size of the electron beam and the high frequency response or bandwidth of the receiver. The bandwidth determines the number of video signal frequency components which are passed by the amplifiers, and in turn determines the number of distinct, vertical black and white lines which can be reproduced on the screen.
Horizontal resolution can be expressed in two ways, in terms of the number of vertical lines which can be resolved, or in terms of the frequency response of the receiver amplifiers.
19 Black and white lines in vertical wedge.
19 Block and White lines in horizontal wedge.
of Picture width
PICTURE WIDTH 4 UNITS
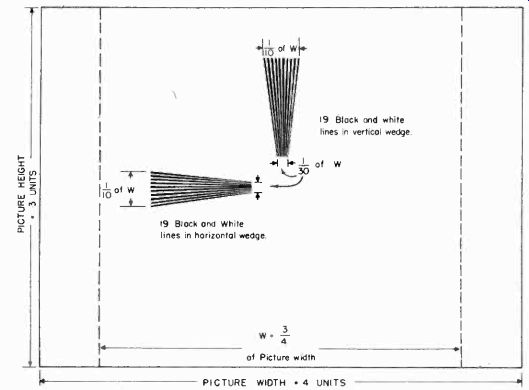
Figure 3. Method used to compute calibration numbers on resolution wedges.
The vertical wedges marked (G) on the R.M.A. test pattern are designed to measure horizontal resolution. The upper wedge is calibrated in terms of number of lines, while the lower wedge is calibrated in number of lines and frequency response. The numbers to the left of the bottom wedge represent frequencies from 3 to 7 megacycles; the numbers to the right of the wedge indicate the equivalent number of lines, ranging from 200 to 600. Like the vertical wedges, the horizontal wedges are designed to exceed the resolution capabilities of the present 525-line television system.
To understand the significance of the numbers on the vertical wedges and the method by which they are calibrated, it is necessary to explain the geometric configuration of the wedges in relation to the overall size of the test chart.
1. In order to have a common basis for comparison of the horizontal and vertical resolution, horizontal resolution is based on the number of distinct black and white vertical lines which can be resolved by the electron beam scanning across three quarters of the usable width of the picture. This distance (3/4 of picture width) is equal to the picture height and gives a square area in which an identical number of lines can be fitted vertically or horizontally. This square is shown in Figure 3 in relation to the overall picture size. For convenience, three quarters of the picture width, which is the length of a side of the square, is labeled "W". Also shown are the vertical and horizontal wedges of the R.M.A. test chart.
2. The vertical wedge has 19 alternate black and white lines.
The top of the wedge is slightly more than 1/10 of W. Considering only the top of this wedge, 10 x 19, or 190 lines, so spaced, could be fitted across the length W. The lower part of the wedge is only 1/30 of W. 30 x 19, or 570 lines, so spaced, could be fitted into a space equal to W. Actually, the above calculations are only approximate because the ratio of the width of the wedge to the length W is not exact. The same points on the R.M.A. test chart in Figure 2 which are determined precisely, are marked 200 lines and 600 lines, respectively. The other numbers on the wedges are calculated in a similar manner.
3. To use the vertical wedges to measure horizontal resolution, simply note how far down toward the narrow portion of the wedges the lines can be distinguished. The resolution may then be read directly from the numbers on the wedges.
The horizontal resolution may also be expressed in terms of frequency to indicate the bandwidth of the amplifiers in the receiver. The numbers on the wedges which provide a line calibration may be converted into an equivalent frequency by dividing the number of lines by 80. This conversion factor is arrived at in the following manner:
1. It takes the electron beam 1/15,750 seconds, or 63.5 microseconds to scan one horizontal line. Of this time, 10.2 microseconds are consumed by the horizontal blanking period, during which the spot retraces its path and begins the next line.
The spot actually appears on the screen for 63.5 minus 10.2, or 53.3 microseconds.
2. To compare the horizontal resolution with the vertical resolution, only 3/4 of the length of a horizontal line is considered.
The spot requires 3/4 of 53.3, or 40 microseconds to scan three quarters of the line.
3. Consider now a signal of one megacycle frequency which produces one complete cycle in one microsecond. When this signal is fed to a picture tube, the positive half of each cycle produces a white dot, and the negative half a black dot.
4. In one microsecond, or one cycle, two dots are produced on the screen by a one-megacycle signal. In 40 microseconds, a one-megacycle signal produces 80 dots, alternately black and white; a 2-megacycle signal, 160 dots; 3 megacycles, 240 dots; 4 megacycles, 320 dots.
5. As the electron beam scans successive lines, the dots appear as vertical lines. The word lines may therefore be substituted for the word dots in step 4. Thus a relationship is established between video frequency and the number of vertical lines which are produced in three quarters of the scanning width.
A one-megacycle signal is equivalent to 80 lines. To convert the number of lines to frequency, divide by 80. Conversely, to convert the horizontal resolution of a receiver, as expressed in frequency, to the equivalent number of lines, multiply the frequency (in megacycles) by 80. For example, if the vertical wedge can be read down to 300 lines, the equivalent bandwidth of the receiver amplifier is 300/80, or 3.75 megacycles. Or if the amplifiers have a bandwidth of 3 megacycles, it should be possible to resolve down to the point on the vertical wedge which corresponds to 3 x 80, or 240 lines.
9-14 Precautions in Checking Resolution. When the wedges in a test pattern are used to measure the vertical and horizontal resolution of a television receiver, several precautions should be observed in order to obtain accurate results.
The contrast, brightness, and focus controls should be adjusted to give a uniformly illuminated picture with sharply focused lines. As pointed out previously, the spot size of the electron beam affects the resolution. Do not over-drive the contrast control, for an over-contrasty picture makes the resolution appear better than it actually is.
Do not measure the resolution with a very weak signal or when the picture is marred by "snow" or other noise interference.
Under these conditions, the resolution appears poorer than the true capabilities of the receiver.
Always try to measure the resolution on more than one station test pattern as a check on the quality of signal transmitted by the station. Some stations may be transmitting pictures of low definition, in which case the poor resolution may exist at the transmitter and not at the receiver.
9-15 "Ringing" or Damped Oscillation. The lines marked (H) on the R.M.A. test chart are provided to show "ringing" or damped oscillations which occur in the receiver amplifiers at certain frequencies. These lines are marked 50 to 300 on one range and 350 to 600 on the second range. The significance of these markings and different weights of lines is as follows: It takes 50 alternate black and white lines, equal in thickness to the line marked "50" to fill three quarters of the width of the picture. It takes 600 alternate black and white lines, equal in thickness to the line marked "600", to stretch across three quarters of the full width of the picture.
If an amplifier in the receiver breaks into spurious oscillation when excited by a particular frequency, the single line in the groups marked (H) which is equivalent to the frequency of oscillation, will be distorted. For example, a video amplifier may break into oscillation at 2 megacycles when a video signal containing this frequency is fed into it. When the electron beam scans across the line in group () which corresponds to 2 megacycles, the video amplifier will oscillate momentarily. The oscillation will take place when line 160 (160/80=2 Mhz) is scanned. As a result of this oscillation, several echoes or ghosts will be visible on the pattern, trailing off in diminishing intensity after line 160, and perhaps those lines above and below it.
9-16 Interlacing. The four diagonal lines marked (I) are included at the center of the pattern to check the quality of interlacing. Jagged diagonal lines indicate that the scanning lines are not interlacing and that the lines in successive fields are not displaced from one another by exactly half a horizontal line.
9-17 Low Frequency Phase Shift. The heavy black bars marked (j) at the top and bottom of the R.M.A. pattern are used as a check for low frequency phase shift. Since the black bars are relatively long with respect to the total scanning width, the video signal does not make many changes in amplitude while the electron beam scans across these bars. Therefore, the video signal contains very low frequency components which must be passed by the video amplifiers. The longer and heavier the bars, the lower is the video frequency and the more severe is the test of the ability of the amplifiers to reproduce low frequencies without amplitude or phase distortion. If such distortion is present, the right ends of the black bars trail off, rather than cut off sharply. This trailing off appears as a grey smear. All thick, black, horizontal lines in the test pattern exhibit this smearing on their right edges if low frequency phase distortion is present in the amplifiers. For example, the 10 black squares in the grey scales will be similarly distorted by poor low frequency response.
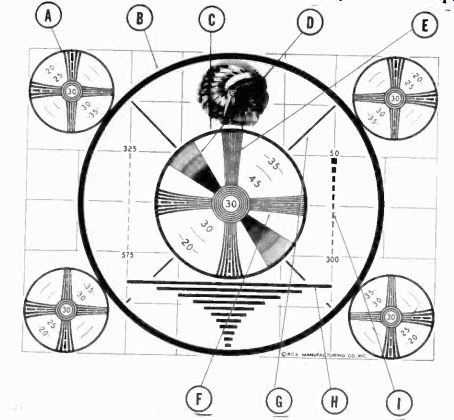
Figure 4. The "Indian head" test pattern.
9-18 The "Indian Head" Test Pattern. Some manufacturers and stations use the "Indian Head" test pattern, which is generated by a monoscope camera, to check the performance of receiving and transmitting equipment. This pattern is shown in Figure 4. It is simpler than the R.M.A. chart, but it is adequately suited for routine test work. The functions of the various geometric designs are as follows:
1. The circles marked (A) should touch the four corners of the mask for a picture of correct size and aspect ratio.
2. The circles marked (A), (B) and (C) are used to check vertical and horizontal linearity. All the circles are round when the sweep signals are linear.
3. All sections of the grey scale marked (D) should be sharp and distinct. These scales check contrast and brightness.
4. Focus is checked using the small circles in the center of the pattern as well as the circles (A) at the four corners of the pattern.
5. The vertical resolution is checked using the horizontal wedges marked (E).
6. The horizontal resolution is checked using the vertical wedges marked (F). Note that on the Indian Head pattern the last zero is omitted on the calibration numbers near the resolution wedges. Thus "20" actually means 200 lines.
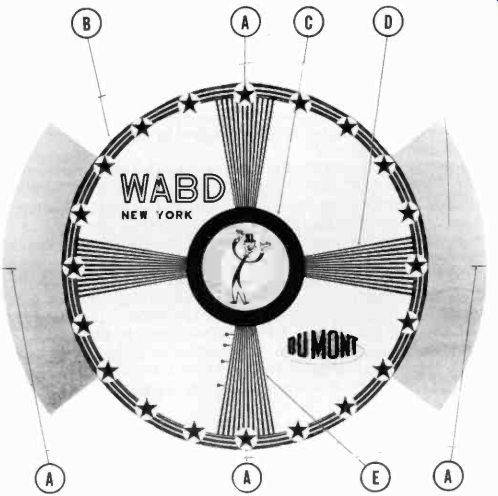
Figure 5. Typical station test pattern.
7. The interlacing is checked using the diagonal lines marked (G).
8. Low frequency phase shift is checked using the heavy horizontal lines marked (H).
9. "Ringing" or damped oscillations are checked by the groups of lines marked (I).
9-19 Typical Station Test Pattern. Test patterns are used by almost all television stations to display their call letters. These patterns are much simpler than the Indian Head pattern just described. A typical station test pattern is shown in Figure 5.
The following performance checks can be made using such a station test pattern:
1. The points marked (A) should touch the edges of the mask for a picture of correct size and aspect ratio.
2. The circles marked (B) and (C) are used to check vertical and horizontal linearity. Non-linear Scanning in either direction is readily apparent by distortion of the circles.
3. The gray scale is made up of the circles in the bulls-eye marked (C). The relative clarity of these circles is a check on the setting of the contrast and brightness controls.
4. Focus can be checked by observing the sharpness of the stars on circle (B) and the sharpness of the wedges.
5. Vertical resolution may be checked by using the horizontal wedges marked (D).
6. Horizontal resolution may be checked by using the vertical wedges marked (E). Note that the wedges are not numbered, but that the lower vertical wedge is marked by dots. Since most stations do not show the calibrating resolution numbers on the test pattern, the technician must calibrate the wedges himself, or he may contact the station for the information. The equivalent number of lines at any point on either the vertical or horizontal wedges may be calculated by multiplying the number of black and white lines in the wedge by the ratio of picture height to the width of the wedge at the desired point on the wedge. To convert to frequency, divide the number of lines by 80. These measurements are subject to the errors introduced by non-linearity of scanning when the width of the wedge is scaled off the received test pattern.
7. Interlacing may be checked by using the sharpness of the alternate black and white lines in the horizontal wedges. If the interlacing is poor, the black lines will appear blurred and jagged.
8. Low frequency phase shift may be checked by observing heavy black objects, such as the stars and the black circle in the bulls-eye.
9-20 Test Pattern Analysis. Having studied the significance of the various geometric designs in television test patterns, the technician should be able to use these patterns to check the performance of receivers. On the following pages there are presented a series of test patterns illustrating the effects of various faults which are commonly encountered in television receivers and installations. Below each pattern are troubleshooting clues for locating and correcting the faults.
Until he is completely familiar with them, the technician will find it advantageous to keep this series of patterns handy when servicing a receiver. By comparing the faulty pattern on the receiver screen with one or more of the patterns which follow, he may quickly diagnose the trouble. Most of the effects illustrated are also discernible on the screen when a program is being broadcast; and when the technician has learned to recognize the effects when they appear in a test pattern, he will usually be able to recognize them when they appear during a program.
It would be difficult to overemphasize the important part which an ability to diagnose test patterns can play in rapid television troubleshooting.
CONTRAST AND BRIGHTNESS CONTROLS MLSADJUSTED

Figure 6. Contrast control set too high.
The test patterns which illustrate the misadjustment of the contrast and brightness controls are grouped together, for these two controls are adjusted simultaneously to obtain a properly illuminated picture. Various conditions of adjustment of the contrast and brightness controls are shown in Figures 6, 7, and 8.
Figure 6 illustrates the appearance of a test pattern when the contrast control is set too high. The various shades of grey in the bulls-eye appear as a solid black area. The details of the picture are blurred and there is a lack of half-tone quality.
When the brightness control is set too high, as shown in Figure 7, the picture appears white, fuzzy, and washed out. Figure 8 illustrates a condition where the contrast control is set too low and the brightness control too high so that the vertical retrace lines can be seen.
To properly set the contrast and brightness controls, turn the contrast control fully counter-clockwise (no picture on the screen). Advance the brightness control until illumination barely appears on the screen. Then advance the contrast control until the best picture is obtained.
If a properly illuminated picture is not obtained by setting these controls, check the d-c voltages across them.
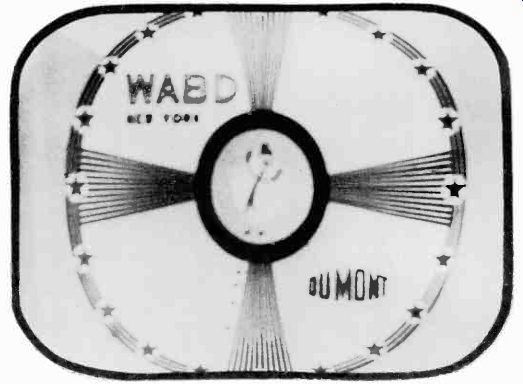
Figure 7. Brightness control set too high.
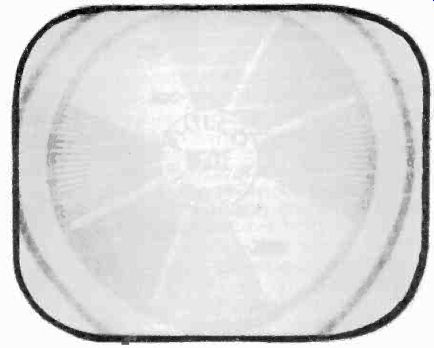
Figure 8. Contrast too low, brightness too high.
IMAGE OUT OF FOCUS
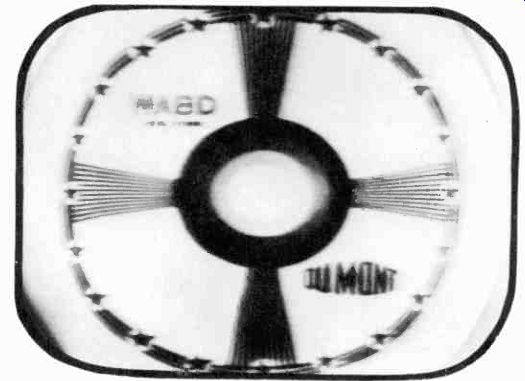
Figure 9.
The appearance of the test pattern when the electron beam is improperly focused is illustrated in Figure 9. The lines in the pattern as well as the scanning lines are not sharply defined.
In most cases this condition may be corrected by simply adjusting the focus control of the receiver. The focus control should be readjusted whenever the brightness control or contrast control is reset.
Often the picture goes out of focus when a receiver has been operating for a long period of time. This happens because the temperature of the focus coil increases, thereby changing the resistance of the coil and the current flowing through it. Or, over a long period of operation, the line voltage may vary and change the focus current. The viewer must readjust the focus control periodically and should be informed of this necessity when an installation is made.
If no setting of the focus control gives uniform focus over the full area of the screen, the focus coil should be rotated slightly and moved back and forth along the neck of the tube, while simultaneously adjusting the focus control. Picture tube and focus coil combinations which uniformly focus the scanning lines over the entire face of the tube are rarely encountered. The best compromise focus should therefore be sought.
FOCUS COIL OR ION TRAP MISALIGNED
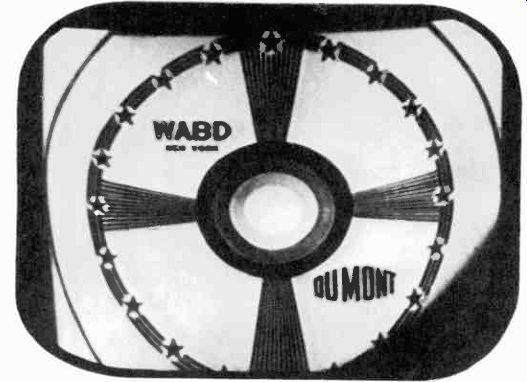
Figure 10.
The shadowed corner and improper positioning of the pattern in Figure 10 indicate that the electron beam is off center and is striking the neck of the tube during part of the scanning cycle.
This trouble is due to misalignment of the ion-trap magnet or of the focus coil on the neck of the tube. Since the positions of both coils affect the centering of the beam, it is necessary to adjust both of them in proper sequence in order to determine which coil is causing the trouble.
The ion-trap magnet should be adjusted first. Rotate it slightly, while simultaneously moving it back and forth along the neck of the tube, until the brightest pattern is obtained on the screen with minimum cutoff of the picture. The focus coil should then be tilted back and forth and left and right until the pattern is properly centered and the shadow eliminated.
If it is impossible to locate positions of the ion-trap magnet and focus coil which clear up the trouble, check the yoke to make certain that it is up against the funnel portion of the picture tube.
If it is not, the beam is probably striking the neck, even though the ion-trap magnet and focus coil are correctly aligned. If the yoke is properly located and not causing the trouble, then the d-c positioning voltages on the yoke may have moved the beam off center while the ion-trap magnet and focus coil were being adjusted.
PINCUSHIONING OR BARRELING OF THE PATTERN
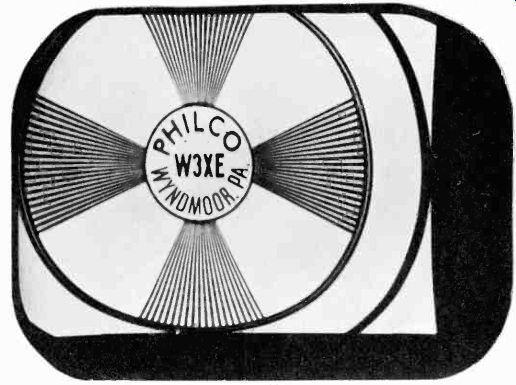
Figure 11.
Pincushioning (or barreling) of the test pattern, as the name implies, appears as bowing or curving of the edges of the picture. Figure 11. This type of distortion is confined mainly to magnetically deflected and focused picture tubes, but may sometimes appear in electrostatically deflected tubes when the deflection plates are not operated at the same potential as the second anode.
In magnetic tubes, pincushioning is caused by improper positioning or faulty construction of the yoke, focus coil, or ion trap. The effects of the magnetic fields surrounding these components are interdependent, and pincushioning can result because of the cumulative action of all of them. The most likely cause of pincushioning is the focus coil. It may be either tilted or not properly centered on the neck of the tube. At times, stray magnetic fields from the focus coil interact with the yoke and cause this condition. The focus coil should be moved back and forth along the neck of the tube to find a position which produces the minimum distortion.
Poorly shaped vertical or horizontal deflection coils in the yoke can produce pincushioning. If it is found that the focus coil is not causing the trouble, a new yoke should be tried. It is also possible that the yoke is not designed for the face curvature of the tube with which it is being used.
PICTURE ROTATED
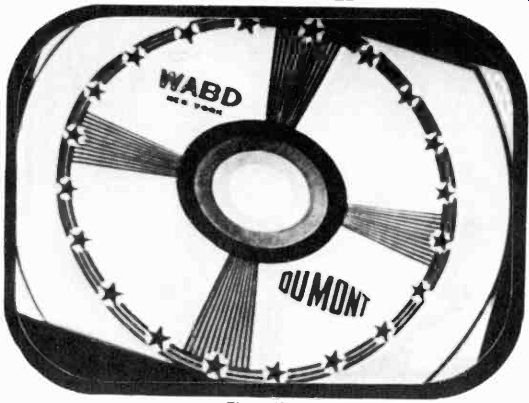
Figure 12.
The test pattern in Figure 12 is "out of square" with respect to the edges of the mask opening. In the case of receivers employing magnetically deflected tubes, rotation of the picture in this manner is caused by the improper positioning of the deflection yoke. This fault can be corrected by loosening the bolts which hold the yoke in place and rotating the yoke until the edges of the picture line up with the mask. The bolts may then be tightened to secure the yoke in its proper position.
The improper orientation of the picture with respect to the mask may also be caused by a damaged yoke in which the vertical and horizontal coils have been moved out of line and are no longer mutually perpendicular. A damaged yoke is indicated when it is found that rotating the yoke around the neck of the tube does not line up the picture with the edges of the mask.
In receivers equipped with electrostatic deflection, the condition shown in this test pattern is caused by an improperly oriented picture tube. The tube itself has rotated with respect to the mask opening. The trouble may be corrected by rotating the tube until the picture is "in square" with the mask. If rotating the tube does not overcome the trouble, the vertical and horizontal deflection plates are probably out of line. Another tube must be substituted to check this possibility.
UNSTABLE HORIZONTAL SYNCHRONIZATION
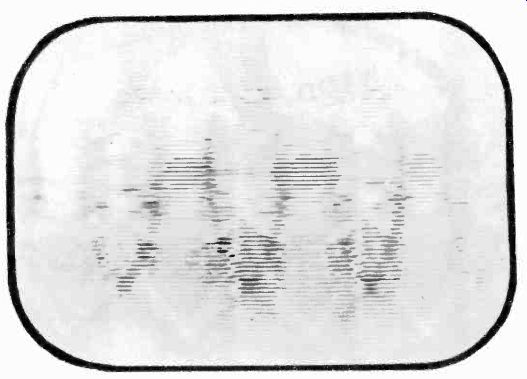
Figure 13.
Figures 13,14 and 15 illustrate three degrees of unstable horizontal synchronization of a receiver with conventional triggered sync. The main characteristic of these patterns, which distinguishes them from those appearing on a receiver equipped with automatic frequency control of the sync circuit is the tearing of the picture into strips. If a receiver is equipped with a.f.c., the picture as a whole rolls out of synchronism.
In Figure 13 the horizontal hold control is far off frequency.
As it is adjusted to approach synchronism, the pattern of Figure 14 is obtained. In Figure 15 the picture is correctly synchronized, but there is a slight tearing at the top and bottom which may be due to a microphonic or noisy tube in the sync circuits or a loose connection in the RF, IF, or horizontal sync circuits.
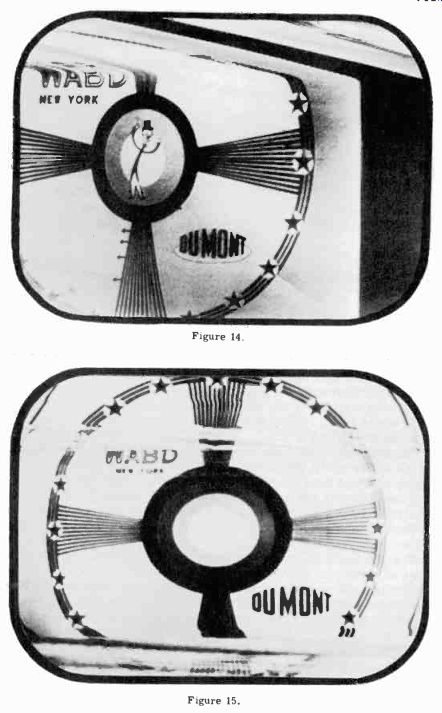
Figure 14.
Figure 15.
Unstable horizontal synchronization can exist regardless of the setting of the horizontal hold control. It may be due to too weak a signal, too strong a signal, a defective sync separator or amplifier tube, or a circuit defect such as loss of supply voltages, an open circuit, etc. Under these conditions it is best to signal trace the sync circuits to isolate the fault. Pull out the horizontal sweep oscillator tube and signal trace the sync signals with an oscillograph, starting at the grid of the sweep oscillator and working back toward the input of the sync separator.
HORIZONTAL SYNC OFF FREQUENCY
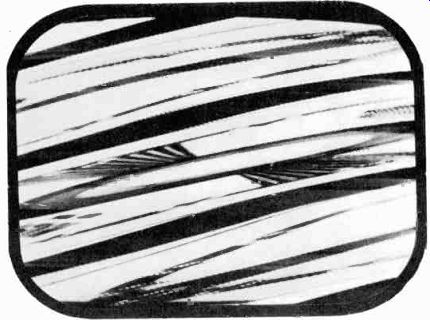
Figure 16.
Figure 16 shows the test pattern as it appears when the horizontal oscillator is off frequency in a receiver with automatic frequency control of the horizontal sweep circuit. The picture as a whole rolls rather than tears out, as is characteristic of a triggered sync circuit.
The unstable sync condition illustrated above may be caused by an incorrectly set horizontal hold control. If no setting of the horizontal hold control pulls the picture into synchronism, the oscillator in the a.f.c. sync circuit is probably out of tune.
The oscillator frequency should be so adjusted that the picture locks in when the hold control is set at either end of its range.
This condition may be checked by tuning the receiver to a station while the hold control is in its center position. If the picture is synchronized, turn the control to either end and switch to another channel. Upon switching back to the original channel, the picture should immediately lock-in when the hold control is at either end of its range. If the picture does not readily synchronize over the entire range of the hold control, the oscillator frequency should be readjusted until this condition is achieved. Since adjustment of the oscillator also affects the phasing control in an a.f.c. sync circuit and visa versa, it is best to consult the manufacturer's service manual for the sequence in which these adjustments should be made.
HORIZONTAL SYNC DISCRIMINATOR PHASE MISADJIJSTED
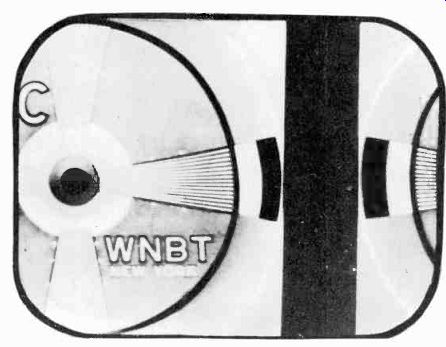
Figure 17.
Figure 17 shows the effect, on the received test pattern, of an incorrectly adjusted phasing control in the discriminator circuit of an automatic frequency control sync system. The picture is synchronized to a constant frequency, but the horizontal saw tooth sweep voltages occur at the wrong time in the scanning cycle. As a result, the horizontal retrace, which occurs during the blanking period (the vertical black bar near the right side of the image), appears on the screen.
In most cases proper phasing of the picture can be obtained by simply readjusting the phasing control on the discriminator transformer. This balances the voltages at the plates of the discriminator diodes so that their output is zero at the time when the start of the sweep should occur. Adjustment of the phasing control may also affect the horizontal oscillator frequency. The latter must then be readjusted according to the procedure described on the preceding pages. Most manufacturers' manuals outline the proper sequence for adjusting these controls with a minimum of difficulty.
The unbalanced sync and oscillator voltages in the discriminator circuit which lead to the trouble shown in this pattern may also be caused by a defective diode or other component.
VERTICAL HOLD CONTROL MTSADIUSTED
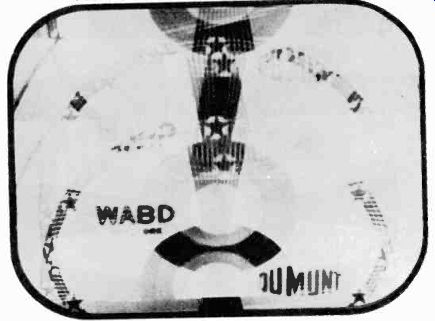
Figure 18.
The appearance of the test pattern when the vertical scanning is out of synchronism is shown in Figure 18. The picture rolls or jumps from top to bottom. In most cases, this trouble is caused by the incorrect adjustment of the vertical hold control which sets the frequency of the vertical scanning oscillator. The vertical hold control should be turned until the picture locks in vertically. This control is on the front panel of some receivers and must periodically be set by the viewer. In other receivers it is located on the rear of the chassis and is adjusted by the technician, after which it needs no further attention.
If the vertical synchronization is unstable, check the signal level coming into the receiver to make certain that it is above the Minimum strength recommended by the manufacturer.
If the signal at the input of the receiver is adequate, and if resetting the vertical hold control does not synchronize the picture, then the trouble is probably in the vertical sync circuits.
It is best to signal trace the vertical scanning system to locate the fault. Starting at the grid of the sweep oscillator, check for a clean, positive vertical sync pulse (the oscillator tube should be pulled out when making this check). Then proceed to each section of the integrating network and check for vertical sync signal continuity. Continue to the plate of the sync separator where clean sync signals should exist.
POOR INTERLACING
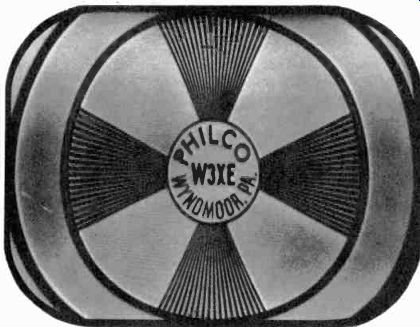
Figure 19.
Figure 19 shows the appearance of the test pattern under conditions of poor interlacing. The scanning lines are easily visible because the odd and even lines overlap, rather than fall between each other. In some cases, the scanning lines may drift in and out of interlace as is evidenced by the ripples in the horizontal wedges.
Poor interlacing at the receiver may be caused by improper adjustment of the vertical hold control, by erratic vertical sync pulses which do not repeat at constant frequency and phase, or by spurious signals which modulate the vertical sync pulses.
A defective component in the vertical integrating network is likely to distort the vertical sync pulses and therefore affect the stability of synchronization. The operation of the integrating network may be checked by removing the sweep oscillator tube and connecting a cathode-ray oscillograph between the grid pin on the empty socket and ground. The vertical sync pulses at the output of the integrating circuit can be observed at this point.
The pulses should be sharp and free of jitter. If not, trace back through each section of the network with the oscillograph to locate the faulty component. Cross-coupling with the horizontal deflection circuits due to improper lead positioning, defective B+ by-pass condensers, or a leaky sync separator tube may cause poor vertical interlacing.
INCORRECT HORIZONTAL SIZE
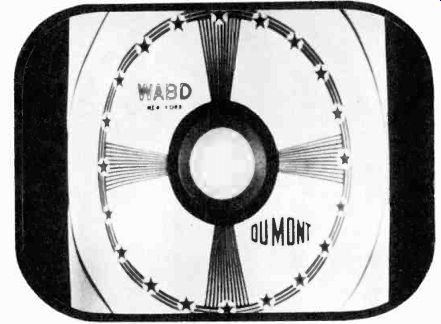
Figure 20.
The width of the picture is determined by the amplitude of the sawtooth voltage applied to the horizontal deflection coils or deflection plates. The test pattern in Figure 20 illustrates the effect which results when the sawtooth amplitude is not properly adjusted. The amplitude of the sawtooth voltage is controlled, in most receivers, by varying a potentiometer in the charging circuit of the sawtooth generator. The range of adjustment is usually sufficient to permit setting the picture to the correct width. In some receivers other controls, such as the horizontal linearity, horizontal drive, and horizontal damping controls, also affect the width of the picture. These controls should be adjusted simultaneously with the horizontal width control to obtain correct picture size and optimum linearity.
A faulty horizontal sweep amplifier tube or a defective component in the sawtooth charging circuit will also affect the picture width. Signal tracing with an oscillograph is the recommended troubleshooting procedure when no setting of the horizontal size control results in proper adjustment. Check the amplitude and waveshape of the sweep voltages against those given in the manufacturer's instruction book at the following points in the circuit: across the horizontal deflection coil, the grid of the sweep amplifier tube, and the output of the sawtooth generator.
INCORRECT VERTICAL SIZE
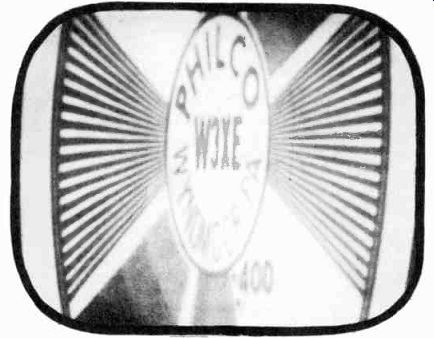
Figure 21.
The most common cause of the condition shown in Figure 21 is improper adjustment of the vertical size control. The pattern shown illustrates a condition caused by excessive vertical sweep amplitude. If the amplitude of the vertical sweep is low, the pattern will be compressed, leaving a dark space above and below it. The vertical size control is generally located on the rear of the receiver chassis and should not be disturbed by the viewer. It must be set by the technician when the receiver is installed. The vertical size control is a potentiometer located in the vertical sawtooth generator or vertical sweep amplifier circuit. By varying this control, the sawtooth voltage fed to the deflection yoke or deflection plates is changed, thereby changing the height of the picture. The vertical size control should be set so that the picture just fills the mask opening.
If no setting of the size control produces a picture of sufficient height, the amplitude of the vertical sawtooth voltage is low.
With an oscillograph, check the peak-to-peak sawtooth voltage at the output of the sawtooth generator across the yoke and compare with the manufacturer's recommendations. A weak sweep amplifier tube, defective yoke or defective sweep output transformer are common causes of insufficient sawtooth voltage.
Check the a-c line voltage and the plate supply voltage.
HORIZONTAL CENTERING MLSADJUSTED
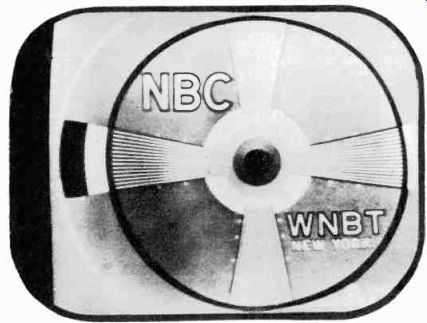
Figure 22.
If the horizontal centering control is not correctly adjusted, the test pattern will appear as shown in Figure 22. Two methods of centering the picture are employed in television receivers.
The simplest method, used in low-cost receivers, is to center the picture horizontally by adjusting the mechanical position of the focus coil. When centering the electron beam by positioning the focus coil, adjustments of the ion-trap magnet must be made simultaneously to prevent cutting off of the picture at its corners.
It may also be necessary to compromise on the quality of focus in order to achieve a centered picture. Receiver s in which horizontal centering is achieved by positioning the focus coil usually have adjustable mounting bolts to vary the orientation of the coil.
Electrical centering of the picture is used in some receivers.
A potentiometer, the horizontal centering control, varies the dc voltage applied to the deflecting yoke or deflection plates.
By varying this control in a properly operating receiver, the picture may be centered horizontally. The centering control is generally located on the rear of the receiver chassis and is set by the technician, after which it should require no adjustment by the user. If the picture cannot be centered with the horizontal centering control, check the dc voltage across the control to see if it corresponds to the manufacturer's rating.
VERTICAL CENTERING MISADJUSTED
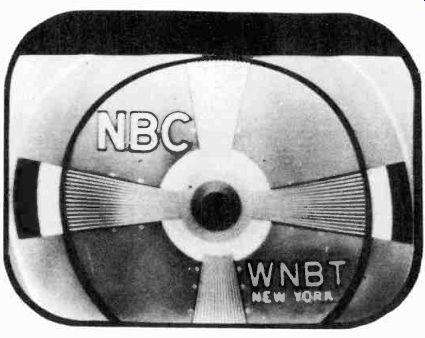
Figure 23.
When the vertical centering control is not correctly adjusted, the pattern is not properly centered, as shown in Figure 23.
Vertical centering is accomplished in two ways, by the mechanical positioning of the focus coil, or by injecting a dc voltage into the deflection yoke or deflection plates.
In receivers employing mechanical positioning of the focus coil to center the electron beam, adjustable mounting bolts are provided to move the coil into the correct position. The focus coil and ion-trap magnet should be adjusted simultaneously in order to avoid cutting off the corners of the picture, to properly center the picture, and to secure the best possible focus.
When vertical centering is obtained by electrical means, a variable dc voltage is applied to the deflection plates or deflection yoke. The amplitude of this voltage is controlled by a potentiometer referred to as the vertical centering control. If proper centering cannot be obtained by varying the vertical centering control, check the line voltage and dc voltage across the positioning potentiometer. If these voltages do not meet the manufacturer's specifications, check the power supply and all components in the centering circuits.
HORIZONTAL LINEARITY MISADJUSTED
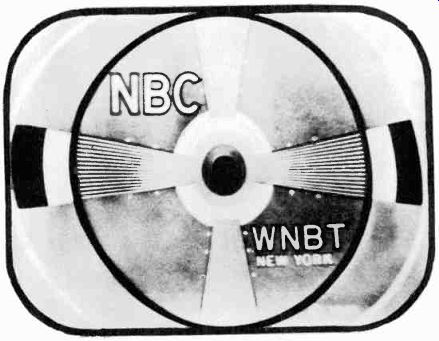
Figure 24.
The method used to adjust the linearity of the horizontal deflection signal differs widely in the various television receiver designs. Many receivers use more than one control. It is therefore best to consult the manufacturer's service manual to determine the effect each control has upon the linear distribution of the picture elements. Distortion of the horizontal linearity is easily recognizable by an egg-shaped test pattern, as shown in Figure 24, or by cramping of one side of the picture.
In the simplest type of deflection circuit, as used with electrostatic deflection, a potentiometer in the cathode circuit of the sweep amplifier serves as the linearity control. Adjustment of this control changes the operating bias of the tube and corrects for distortion of the sawtooth voltage. In magnetic deflection systems, linearity controls are located in the cathode of the sweep amplifier tube as well as in the damping circuit. Usually, the linearity control must be adjusted in combination with the horizontal width control in order to obtain an image of proper width and linearity. If no combination of settings of these controls produces linear scanning, check the values of the components in the horizontal sweep circuits. A defective component in the horizontal deflection circuits, such as the charging capacitor, charging resistor, etc., can cause a non-linear sweep.
HORIZONTAL LINEARITY MISADJUSTED (cramped on right)
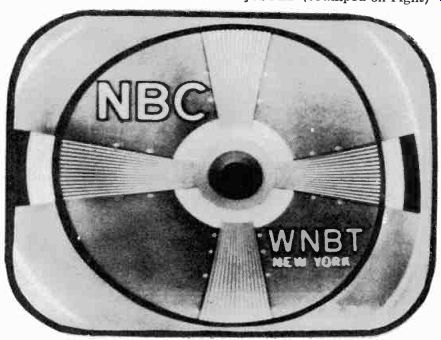
Figure 25.
It is sometimes found that no matter how the horizontal linearity control is adjusted, the right side of the picture is cramped as shown in Figure 25. This condition is sometimes caused, in magnetic deflection circuits, by an improperly adjusted horizontal drive control. The control is located in the output of the sawtooth generator circuit and controls the voltage applied to the deflection amplifier tube and the point on the scanning trace at which it conducts. By virtue of its position in the circuit, the drive control affects the width and horizontal linearity of the picture. It is normally set for the widest possible picture without cramping the right side. The width control and linearity control are then adjusted to obtain the correct scanning width and good line distribution across the middle and left side of the image. However, if the drive control is set too far, the right side is crowded, and no amount of adjustment of the linearity or width controls can compensate for the distortion.
In some horizontal deflection circuits, a feedback system is used to feed a negative pulse from the output transformer to the grid of the sweep amplifier, in order to determine its point of conduction. In such circuits, the drive control is a potentiometer, connected across part of the secondary of the output transformer, to control the amplitude of the feedback pulse.
DEFECTIVE DAMPING OF THE HORIZONTAL SWEEP
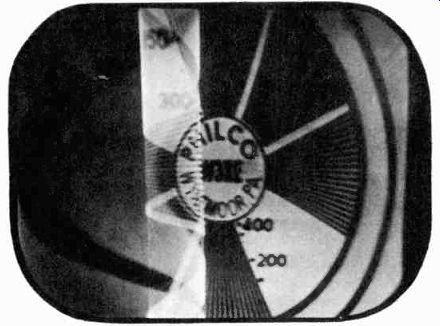
Figure 26.
Receivers employing magnetically deflected picture tubes use a damping tube or damping network to suppress shock oscillations which occur during the retrace period of the saw-tooth voltage. The damping components are subjected to high peak voltages during the retrace period and may break down if their ratings are exceeded. When failure occurs in the damping circuit, the left side of the pattern is distorted as shown in Figure 26. The picture folds over at the left, or white, vertical bars appear near the left edge. Note that only the horizontal scanning can be affected by such a failure.
No amount of adjustment of the horizontal linearity controls can eliminate the foldover caused by a damping circuit failure.
If a diode or triode is used as a damping tube, it should be replaced by a new tube as the first step in tracking down the trouble. Some manufacturers provide waveform diagrams in their service manuals which illustrate the voltage waveshapes which should be obtained at various points in the damping circuit of a normally operating receiver. These points should be checked with an oscillograph. Signal tracing in this manner often turns up a defective component, other than the damping tube.
In some receivers, a variable potentiometer in the cathode of the damping circuit may be in need of adjustment.
VERTICAL LINEARITY MISADJUSTED
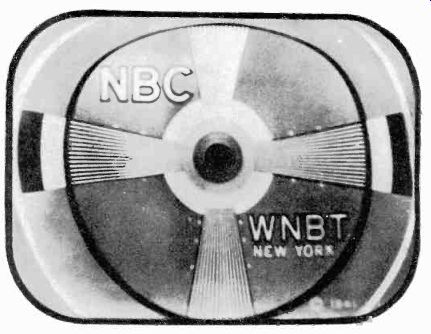
Figure 27.
Misadjustment of the vertical linearity control distorts the vertical scanning as shown in Figure 27. The vertical linearity control is generally a potentiometer located in the cathode circuit of the sweep amplifier tube. By varying this potentiometer, the tube is made to operate on either the straight or curved portion of its characteristic curve and corrects for distortions in the sawtooth voltage. When adjusting the linearity control, it may be necessary to re-set the vertical size control because the linearity control also affects the amplification of the tube.
Other conditions which cannot be corrected by setting the linearity control may cause distortion of the vertical linearity. A defective sweep amplifier tube or defective component in the output stage are common faults. A partially shorted winding in the vertical output transformer or deflection coil also affects the linearity. A defective component in the sawtooth generator circuit or low plate supply voltage to the sweep circuits is another possible cause of vertical sweep distortion.
An examination of the waveshape of the voltages at the grid of the sweep amplifier tube and across the deflection coil will help to isolate the trouble to either the sawtooth generator circuit or the sweep amplifier stage.
FOLD OVER AT TOP OF PICTURE
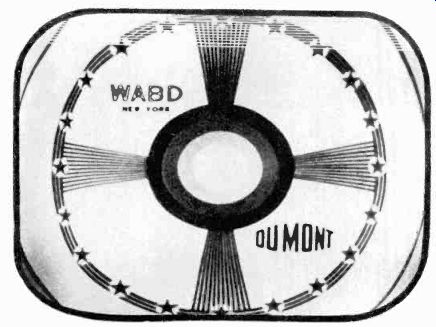
Figure 28.
A type of vertical distortion which may occur in magnetic deflection systems is shown in the test pattern of Figure 28. The top lines of the picture are crowded and, in extreme cases, overlapping or foldover of the lines occurs. This distortion is caused by the vertical discharge circuit and no adjustment of the vertical linearity or size control can eliminate it. It will be recalled that in order to produce a linear sawtooth current in the vertical deflection coil, it is necessary to add a pulse to the sawtooth voltage which is applied to the coil. This pulse is produced in the discharge circuit by inserting a resistor, referred to as a peaking resistor, in series with the charging condenser.
The value of the resistor is chosen to suit the design of the deflection coil, the coupling transformer, and the sweep amplifier tube. If the peaking resistor or charging condenser is defective, the amplitude and shape of the pulse added to the sawtooth voltage are affected, causing crowding of the lines or foldover at the top of the picture.
To correct the peaking voltage, replace the peaking resistor with a potentiometer whose total resistance is greater than that specified for the peaking resistor. Vary the potentiometer resistance until the crowding or overlapping of lines disappears.
Then measure the portion of the potentiometer resistance which is used and solder a fixed resistor or equal value in its place.
NO HORIZONTAL SWEEP
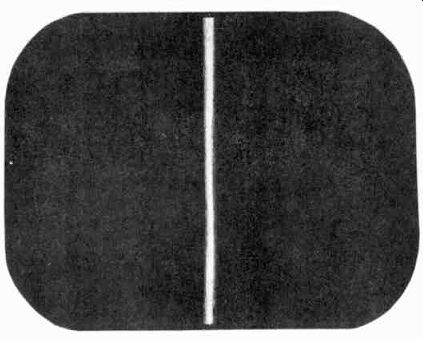
Figure 29.
Failure of the horizontal sweep circuit cuts off the horizontal deflection of the scanning beam, leaving only a vertical line on the screen as shown in Figure 29. In order to avoid burning a line in the screen while troubleshooting for the fault, turn down the brightness control so that the line is barely visible.
Since the vertical sweep is still working, it is probable that the plate voltage which is fed to the sweep circuits is all right.
The fault is most likely caused by a defective component or open lead in the horizontal sweep circuit. A systematic waveform check with an oscillograph should readily isolate the trouble.
Signal trace the horizontal sweep circuit, starting at the horizontal deflection coil and work back in the circuit toward the sawtooth generator. The check points across which the oscillograph may be connected safely are as follows: the horizontal deflection coil, the cathode and grid of the sweep amplifier tube, the plate of the sawtooth generator tube, and the grid of the sweep oscillator tube. At each check point, compare the waveform obtained with that illustrated in the manufacturer's service manual. The waveform should check both in amplitude and shape. Signal tracing in this manner will indicate whether or not the sweep oscillator is functioning and the sawtooth voltages are being generated.
NO VERTICAL SWEEP
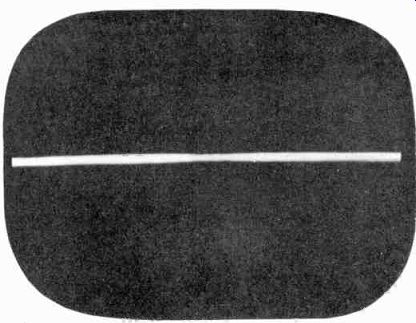
Figure 30. A horizontal line on the screen as shown in Figure 30 indicates
that vertical scanning is not present. Before attempting to troubleshoot the
vertical sweep circuit, turn down the brightness control so that the screen
will not be damaged.
Since the horizontal sweep is working (as are probably the sound and video circuits), the power supplies are functioning properly. The fault is generally due to a defective component or open lead in the vertical sweep circuit. The most common failures in this circuit are open vertical deflection coils or sweep transformer windings, and defective sweep amplifier and vertical discharge tubes. The trouble may readily be isolated by signal tracing the discharge circuit and the sweep amplifier stage with an oscillograph. With the oscillograph connected across the following points in succession, check for signal continuity as well as proper amplitude and waveshape: the vertical deflection coil, the grid and cathode of the sweep amplifier tube, and the plate of the vertical discharge tube. Finally, check the waveform at the grid of the vertical sweep oscillator tube to make certain that this stage is oscillating and feeding discharge pulses to the sawtooth generator. There is no need to check further into the sync circuits for they do not affect the generation of the vertical sawtooth sweep voltage.
NO VIDEO SIGNAL, RASTER ONLY
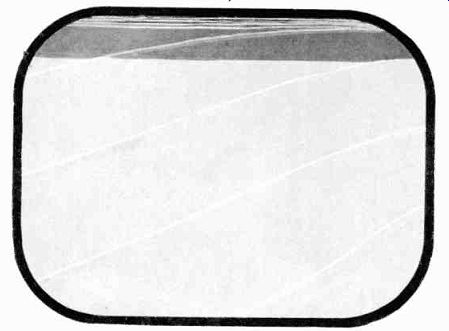
Figure 31.
When a raster appears on the screen as shown in Figure 31, the following line of reasoning may be used to isolate the trouble.
Since a raster is obtained, there is no trouble in the sweep circuits, sweep power supplies, and probably not in the sync circuits. If the audio is coming through, the RF circuits must be operating properly. On the other hand, if both the audio and video are dead, then the trouble most likely lies in the RF section or the power supplies.
Assuming that the audio and video sections are not working, check the supply voltages with a voltmeter. If the voltages are correct, proceed to the RF section. Tap the grid of the mixer tube. A click should be heard in the speaker and dark bands should appear on the screen if the audio and video IF circuits are working. The same results should be obtained when the input to the antenna coupling stage is tapped if the RF section is functioning. Also check the oscillator stage by simply looping the oscillograph input lead around the oscillator tube or coil.
A high frequency oscillation should be observed on the scope if the oscillator is operating. If it is assumed that the audio is coming through, the trouble probably lies in the video section.
It can be isolated by tapping the grid or plate of each tube. Dark bands should be observed on the screen when the tubes are tapped if there is signal continuity.
POWER SUPPLY HUM OR RIPPLE IN PICTURE
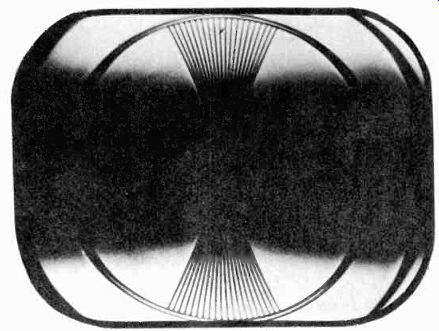
Figure 32.
Hum or ripples show up in the test pattern as dark, horizontal bands of constant intensity or wavy edges of the picture. The cause is usually a defective component or an open lead in the power supply filter section, or in the by-pass circuits of any stage in the receiver. The hum bars are due to excessive 60 cycle or 120-cycle ripple. Troubleshooting should start at the output of the plate and bias supplies. Check these points with an oscillograph for any noticeable ripple. If hum does not exist at this point, the trouble is probably a defective by-pass condenser in the video or sweep circuits. The fault may readily be confined to a particular section of the receiver by recognizing on the screen the hum pattern which shows up in a characteristic manner when a stage is troubled by excessive ripple. The patterns are illustrated in Figures 32, 33 and 34.
Figure 32 shows a test pattern in which 60-cycle hum, coming through the video amplifier or video IF stages, produces uneven illumination.
Excessive 60-cycle ripple in the horizontal sweep circuits is Shown in Figure 33.
The effect of 120-cycle ripple appears as twice the number of dark and light bands that are produced by 60-cycle ripple as shown in Figure 34.
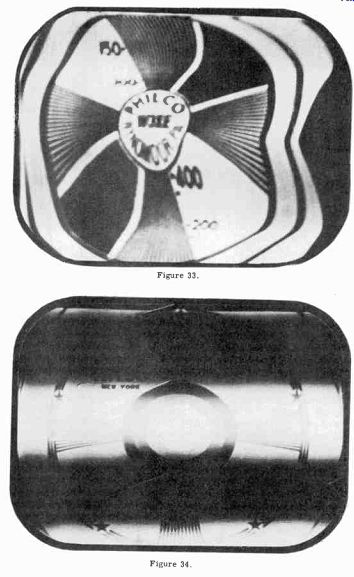
Figure 33. Figure 34.
LOSS OF HIGH VIDEO FREQUENCIES
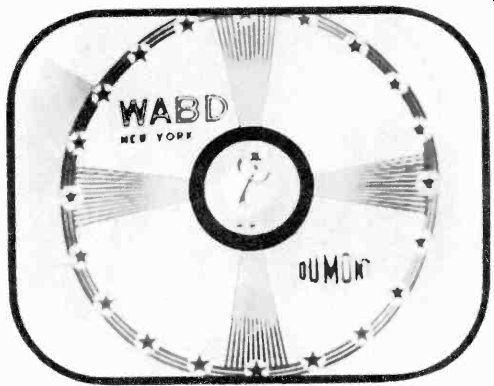
Figure 35.
The loss of the high video frequencies shows up in the test pattern as a lack of sharpness of the fine details, particularly apparent in the vertical wedges. Figure 35 shows a test pattern as reproduced by a receiver which suffers from a considerable loss of high video frequencies. Note that the fine lines in the vertical wedges wash out before they reach the bulls-eye.
In order to reproduce fine details in the test pattern, the amplifiers in the RF and video sections of the receiver must have uniform response up to 3.5 to 4 megacycles. An improperly aligned amplifier stage will narrow the overall bandwidth and attenuate the high frequencies. If this condition exists as indicated by the lack of detail in the vertical wedges, it is best to first check the alignment of the video IF amplifiers with an oscillograph, sweep generator, and signal generator. An overall check of all the video IF stages will suffice, unless this check indicates that the trouble exists in one of the stages. A stage by-stage check should then be made to locate the misaligned coupling transformer.
If the video IF stages are correctly aligned, the RF tuner should be checked on each channel. Finally, the frequency response of the video amplifier should be measured with a signal generator and sweep generator (or square wave generator)
in conjunction with an oscillograph.
LOSS OF LOW VIDEO FREQUENCIES
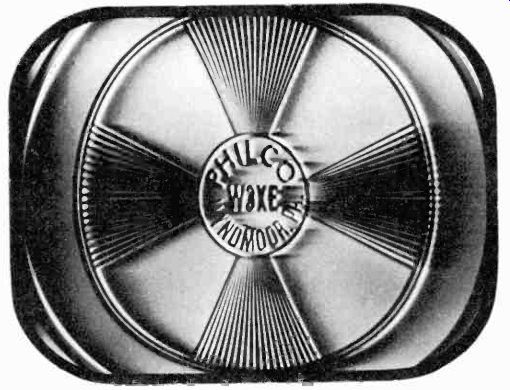
Figure 36.
Poor low frequency response in the amplifiers of the RF and video sections is generally accompanied by phase distortion at these frequencies. This condition is indicated by a smearing of large objects and letters, and a blurring of the horizontal wedges in the test pattern, as shown in Figure 36.
If the sound is loud and undistorted, it is reasonable to assume that the RF section is correctly aligned and that the low frequency distortion is occurring in the video IF amplifiers or the video amplifier. Improper alignment of the video IF amplifiers generally permits sound signals to enter the video circuits.
These signals appear as horizontal bars, drifting up and down on the screen. If these bars are not present and only the smearing effect is observed, it may be assumed that the IF amplifiers are correctly aligned and that the trouble is in the video amplifier.
To definitely establish whether or not the low frequency distortion is taking place in the video amplifier, feed a 60-cycle square wave into the grid of the amplifier and observe its output on an oscillograph which has good low frequency response.
If the top of the square waves slopes downward, low frequency distortion is present in the video amplifier. The poor response is mostly likely caused by a shorted load resistor or an open by-pass condenser in the plate or screen supply circuits.
SOUND IN THE PICTURE
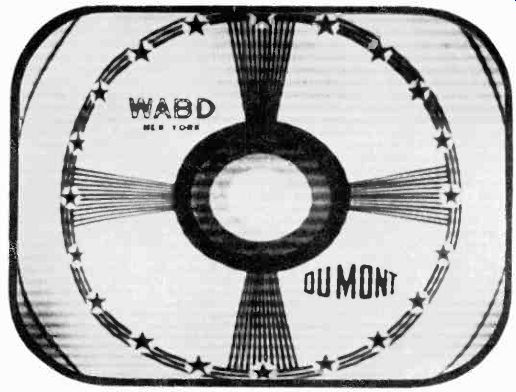
Figure 37.
Figure 37 shows a test pattern which is marred by sound signals riding through the video channel to the grid of the picture tube. The sound signals are those accompanying the video information. When they get into the picture, they appear as horizontal black bands which closely resemble a power-supply ripple in the video amplifier stage. Sound ripple shows up as many bands, changing in intensity and moving up and down the screen in synchronism with the amplitude and frequency of the audio.
The black bands produced by excessive a-c ripple do not vary in intensity, and are one or two in number, depending on whether the ripple is 60 cycles or 120 cycles.
The most common cause of sound modulation of the video signals is improper adjustment of the RF tuner. To tune a receiver correctly, the fine-tuning control should be set for maximum sound. If the sound bars cannot be eliminated by resetting the fine-tuning control, or can only be removed by a tuning adjustment that causes the sound to be distorted, the receiver is probably out of alignment. Misalignment can exist in the RF tuner or the sound traps of the video IF amplifier. First check the alignment of the video IF amplifier and sound traps with a sweep generator, signal generator, and oscillograph. Check the alignment of the RF tuner in the same way.
TOO WEAK A SIGNAL
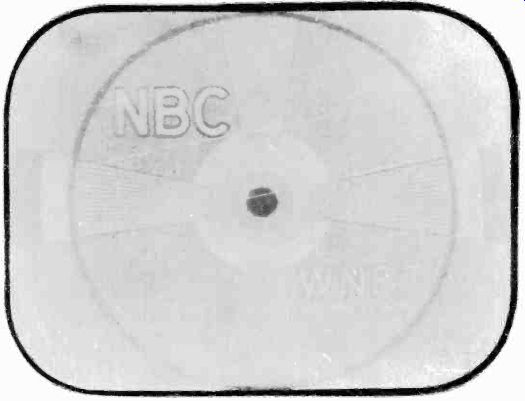
Figure 38.
The signal strength at the receiver may be so low that only a faint picture can be obtained, accompanied by considerable noise and poor synchronization. See Figure 38. This condition may be deceiving and prompt the technician to attempt to realign the video circuits for greater gain, a procedure which would be to no avail. A field strength meter or calibrated receiver connected to the antenna system will readily indicate the signal level. If this level is below the minimum signal for which the receiver is designed (as indicated in the manufacturer's manual), a few things can be done to increase the signal. Increasing the height of the antenna may help, provided the increased length of transmission line does not introduce additional losses which offset the gain in signal strength. A reflector may be added to the antenna if one does not already exist, or one of the high gain antennas described in Section 5 may be tried. Or, finally, an RF amplifier stage may prove effective. R-F amplifiers or "boosters" are available commercially and are easily inserted in the transmission line.
In some areas the signal strength may be sufficient on all stations except one or two. Erecting separate antennas which are cut and directed for the weak stations may prove a convenient solution.
TOO STRONG A SIGNAL
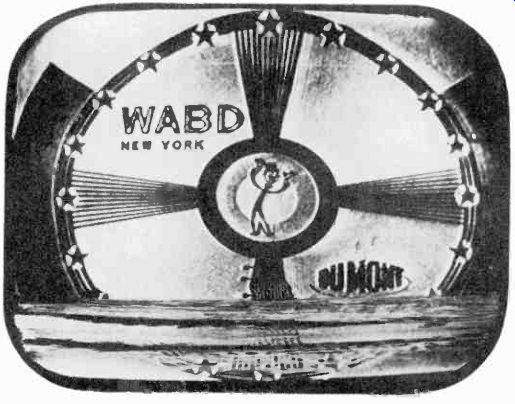
Figure 39.
Often the signal level at the receiver input is so high that it overloads the input circuits. This condition is indicated by a loss of synchronization, an over-contrasty image, and sometimes by sound modulation in the picture. The overload condition may be remedied by reducing the signal input, using an H-pad attenuator inserted between the receiver input terminals and the antenna transmission line so that the signal is below the overload value for the particular receiver. The signal input should be measured with a field strength meter and resistor values selected to make up the required H-pad. Half-watt carbon resistors should be used. If a field strength meter is not available, various H-pads may be made up and tried. The pad with the minimum attenuation that removes the overload conditions should then be wired into the transmission line.
Another effective means of reducing the signal is to hook a piece of solder, several inches long, directly across the antenna terminals of the receiver. Although this solder may appear to be a short circuit, it actually is long enough at the television frequencies to have sufficient impedance so as not to by-pass the signal completely. In some areas the signal strength is so strong from all stations that it is possible to prevent overloading by eliminating the outdoor antenna.
GHOSTS OR MULTIPLE-PATH SIGNAL
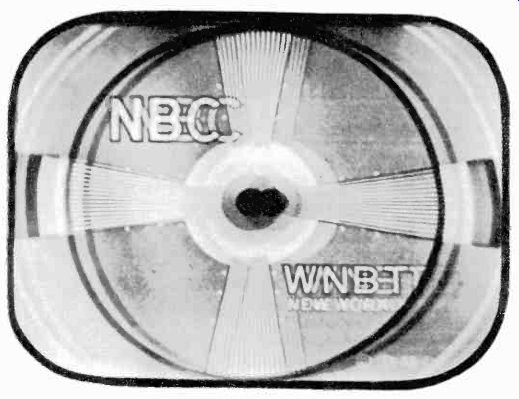
Figure 40.
A ghost or multi-path signal appears on the screen as an offset duplicate of the pattern as shown in Figure 40. The amount of offset is proportional to the difference in the path distance of the direct signal and that of the reflected signal.
If the reflected signal is almost equal in amplitude to the direct signal, it will affect the sync stability of the receiver, since the sweep circuits can synchronize on either the direct or reflected signal.
The reflection can usually be eliminated if a directive antenna, oriented so as to accept the main signal and discriminate against the reflected signals, is used. Under some conditions, where there is no direct path between receiver and transmitter, it is possible to orient the antenna so as to receive a reflected signal. The antenna must then be positioned to accept the best reflected signal and discriminate against all others.
If the reflected signal is received from the same direction as the direct signal, a directive antenna cannot reduce the reflection. The only solution to this problem is to attenuate the composite signal until the reflection disappears. The direct signal will probably still be strong enough to be usable.
If it is impossible to eliminate ghosts on more than one station with a single antenna, separate antennas may be used.
TRANSIENTS IN THE PICTURE
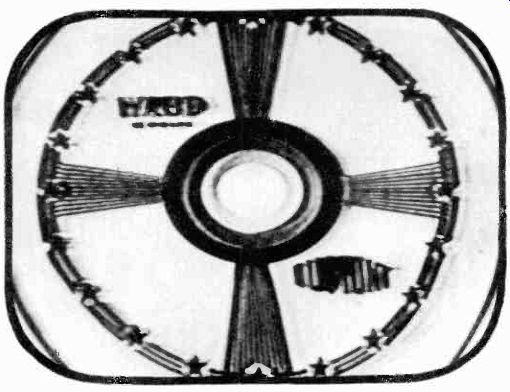
Figure 41.
Transients are caused by improper matching in the antenna system or by improper tuning of the video circuits. As shown in Figure 41, transients closely resemble ghosts in the picture.
In order to establish whether or not the effect is a transient or a ghost, the antenna should be rotated. If the interference disappears or changes, then it is caused by a reflected or ghost signal. If it remains the same, then the effect is due to poor transient response in the antenna system or the video circuits.
Poor transient response is the inability of a tuned circuit to pass sudden amplitude changes without distortion. Instead, there is a tendency toward oscillation when these components occur, resulting in a double image.
To check the antenna system for mismatch, determine the input impedance of the receiver and compare it with that of the transmission line and antenna. If the transmission line or antenna does not match the receiver impedance, suitable matching stubs should be inserted. If it is established that there is no mismatch in the antenna system, then the alignment of the RF amplifier, picture IF amplifier and video amplifier stages should be checked. A sweep generator and oscillograph may be used for the alignment of the RF and video IF amplifiers. No overshoot of the response curve appears when the amplifier has good transient response.
IGNITION INTERFERENCE
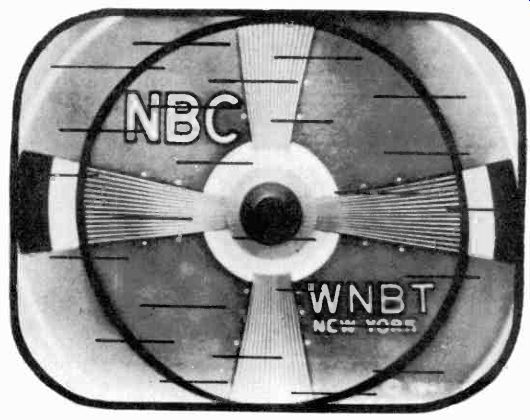
Figure 42.
The ignition systems of automobiles produce static which enters the receiver via the antenna system and causes light and dark spots and horizontal streaks in the picture, as shown in Figure 42. When severe ignition noise is present, picture tearing occurs.
When ignition noise is encountered, an attempt should be made to increase the signal pickup while attenuating the noise. Often this can be accomplished by using a high-gain directive antenna.
Anything else done to increase signal strength will improve the signal-to-noise ratio and improve the picture. Shortening the antenna transmission line, using a low-loss transmission line, and elevating the antenna are effective. Coaxial or shielded parallel cable is usually more effective than twin-lead in reducing noise pickup. If twin-lead is used, it should be twisted, since this reduces noise pickup. The outer shield of coaxial or shielded pair lines should be connected to a good ground.
Moving the antenna out of the direct noise field, even at the expense of signal strength, is .often beneficial. If the signal strength is extremely low, a long wire "V", rhombic, or similar type high-gain antenna will help if one can be erected.
DIATHERMY INTERFERENCE
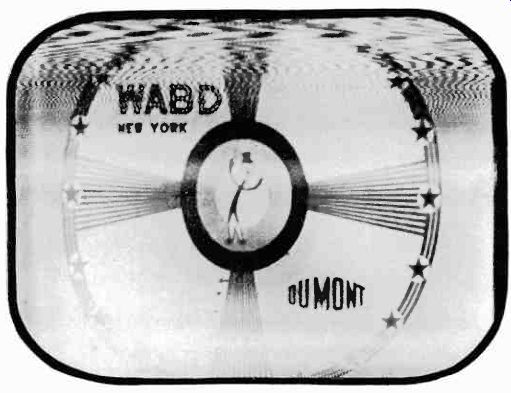
Figure 43.
Although most modern diathermy machines are equipped with RF filters so that radiation and feedback into the power supply system are reduced, there are still many old and defective machines in existence which cause considerable interference with television reception. The high frequency diathermy signals beat with the television carrier and cause the rippled pattern shown in Figure 43. Some diathermy machines operate on fixed frequencies which are close to the IF frequency of television receivers. Often the frequency of the diathermy apparatus drifts and moves into the IF frequency band of the receiver, causing an interference pattern which slowly drifts up and down on the viewing screen. Little can be done to the antenna installation to remove this interference, although a directive antenna may sometimes help. A more practical solution is to locate the machine and ask the owner to maintain the apparatus at its correct operating frequency or shield it. If the technician is absolutely sure that the diathermy machine is operating outside of the assigned frequency band for diathermy machines and the owner is unwilling to cooperate, a report should be made to the Federal Communications Commission.
BEAT FREQUENCY INTERFERENCE
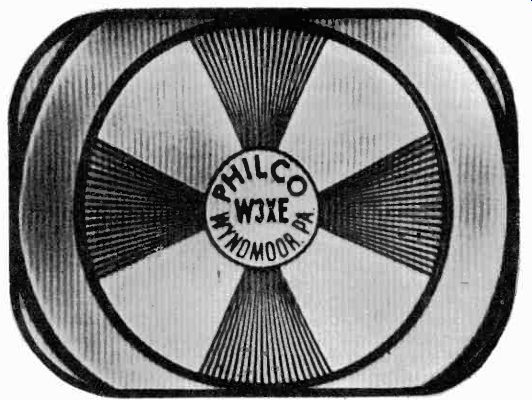
Figure 44.
Often strong AM and FM signals beat with the sound or picture carriers of a television station. If the resulting heterodyne frequency falls within the channel to which the receiver is tuned, an interference pattern is produced which appears in the picture as a series of fine vertical or slanting lines, as shown in Figure 44. The interference pattern drifts slowly through the picture as the television carrier or the interfering carrier changes frequency slightly.
The unwanted carrier maybe filtered out by inserting a wave trap in series or shunt with the antenna lead-in. Suitable values for such traps can be found in Section 8. Another method which is often effective in trapping out the interfering frequency is to connect a piece of coaxial cable or parallel lead-in across the antenna input terminals of the receiver. Starting with a piece about two feet long, the cable is clipped off, a little at a time, until the beat frequency is eliminated. Of course, the use of a wavetrap or piece of transmission line to eliminate the interfering carrier is predicated on the condition that the unwanted signal is fixed in frequency. If it is not and varies over a wide range, little can be done to eliminate it.
9-21 Troubleshooting for other Faults. Many common troubles which occur in the receiver cannot be detected by observing the picture on the screen. In order to locate the cause of such troubles, the technician should first isolate the fault to a particular section of the receiver, as described earlier. To locate the faulty stage and component, two procedures are possible. One is to be thoroughly familiar with the functions of each stage in the section and thus be able to spot characteristic troubles. The other is to signal trace the circuit, looking for the waveforms which are characteristic of a properly and improperly operating receiver. Both of these methods are described, wherever applicable, in discussing other troubles which are common to the six basic sections of a television receiver.
9-22 Troubleshooting the R-F Section. This section includes the antenna, RF input circuit, RF amplifier (if present), the local oscillator, and the first detector. Troubleshooting the RF section must start at the installation itself. Unlike the servicing of a radio receiver which can be brought to the shop and repaired, the location of the television receiver and its antenna and transmission line all affect its performance. Before removing a receiver from the installation, the technician should carefully examine the complete installation to make certain that the trouble does not exist outside the receiver. The troubleshooting procedure for the RF section can be divided into two steps: 1. preliminary checks at the receiver installation, and
2. troubleshooting the set at the shop. A third step might also be considered, that of re-installing the receiver after repairs have been made. This again involves the routine of step 1.
The following troubles can be attributed to the antenna installation and receiver input.
a. Local interference.
b. Too strong a signal.
c. Too weak a signal.
d. Diathermy.
e. Beat frequencies.
f. Transients in the transmission line.
g. Multi-path signals.
These faults were treated in Section 8 and in the previous group of test patterns, where methods were outlined for their cure.
9-23 Switch Contact Troubles. In RF tuners employing a switch arrangement, the transmission line is coupled to the receiver through coupling transformers, each tuned for a different channel. Ganged to the coupling coil switch are the oscillator circuit coils. At the high television frequencies, the contact resistance and inductance of the switch terminals are critical.
Slight variations in contact resistance are enough to detune the oscillator or change the characteristics of the band pass circuits. Gradual wear of the contacts changes the contact resistance and the inductive path. This trouble occurs especially with knife-type switches which do not close in the same position at all times and cause severe oscillator drift.
Most receivers using switches have a small variable trimmer in the oscillator circuit to correct for this drift. The trimmer may or may not have sufficient range to compensate for circuit changes, depending upon the design of the oscillator and the seriousness of the change.
9-24 Oscillator Faults. Severe oscillator drift results in the loss of sound, although the picture is still present. The picture obtained under these conditions will not be good, but some of it will come through, since the picture channel is 4 Mhz wide greater, as a rule, than the oscillator drift. The sound channel for television, on the other hand, is only 50 khz wide and the change in oscillator frequency is often sufficient to move the sound intermediate frequency out of the pass band. If parts of the oscillator circuit, such as the switch or tube sockets have to be replaced, the oscillator frequencies on all channels are usually affected and all the oscillator coils have to be reset.
When neither picture or sound are present it is possible that the oscillator is at fault. If the power supplies are functioning properly, check to see that the oscillator is working by holding the input lead of the oscillograph near the oscillator and noting whether the high frequency is picked up. If no oscillations are generated, the oscillator tube and wiring should be checked. If the oscillator is functioning, the trouble is probably in the RF amplifier (if one is used), or in the tuned RF circuits. Test the RF tube and associated circuit wiring. If any changes are required, the circuits should be realigned.
9-25 The Video Section. If a poor picture is present on the receiver screen at the installation, and the installation does not suffer from antenna or RF section trouble, it is likely that the trouble lies in the video channel. In this case, the receiver should be brought to the shop for troubleshooting and alignment.
If no picture is being received but the sound is coming through, it is a good indication that the RF section is functioning properly and the trouble lies somewhere after the first detector. Obvious faults in this case are open leads, burned-out components, or defective tubes. An efficient method of troubleshooting the video channel rapidly is that of signal substitution. This consists of substituting a signal from a signal generator, for the normally received signal, and noting the output on an oscillograph or vacuum tube voltmeter. The procedure should start from the grid of the picture tube and work back toward the input of the IF amplifiers. For example, a 2 Mhz signal can be injected into the video amplifier grid and the output observed at the grid of the picture tube. If output is obtained, the video amplifier is operating. Now, putting the oscillograph with its probe detector across the grid of the video amplifier and injecting a modulated IF carrier signal into successive IF stages (starting from the output of the last stage), these circuits can be checked. If during the above procedure an injection point is reached which does not produce output, the fault is in the circuits between this point and the last injection point used. The components of the circuits thus indicated should be checked and the faulty ones replaced.
The overall response of the video channel should then be checked.
Microphonic resistors, condensers, or tubes in which the elements are not rigidly fixed, cause patterns of splotches in the picture. Any vibration of the receiver sets the elements in motion, generating transient currents. Noisy components can usually be located by tapping each suspected component with a light object such as the eraser end of a pencil. Sometimes, substitution of tubes is necessary to isolate a faulty one.
9-26 Sound Channel Faults. The usual faults in the sound channel fall into two main categories. 1. No sound at all, and 2. Distortion of sound.
Lack of sound is due to one of two troubles. The first is obvious and is due to an open lead or defective component in the sound channel. A stage-by-stage signal substitution check should isolate such a fault quickly. The second cause of loss of sound reception lies outside of the sound channel and in the RF section. The oscillator may have drifted so far off frequency that the sound IF carrier and its associated side-bands fall outside of the pass band of the sound IF amplifiers. If tapping the grid of the first audio IF amplifier produces an audible click in the speaker, it is likely that the sound channel is operating properly, and that the fault lies in the RF section.
The location of the cause of sound distortion is most quickly accomplished by an alignment check, starting from the audio amplifier and working through the discriminator, limiter, and IF amplifiers. Alignment methods are described later in this section. If in the course of aligning a particular stage it is impossible to obtain the required band-pass characteristic or stage gain, then a check should be made of the tubes, operating voltages, and possible off-value components.
9-27 Vertical Sweep Circuit Faults. If part of the vertical sweep system fails, vertical scanning ceases and a bright horizontal line appears on the picture tube. If the receiver is left on too long after the failure occurs, the line maybe burned permanently into the tube screen because of the concentration of the electron beam on a small area of the tube. When attempting to locate the fault, the set can be left on, but the brightness control should be turned down so that the beam is barely visible.
An oscillograph will most rapidly facilitate the isolation of a fault in the vertical sweep circuit. Set the oscillograph for 60 cycle sweep so that the waveforms in the vertical sweep system can be observed. Starting at the grid of the oscillator, check for the characteristic blocking oscillator pulse at that point. If this stage is oscillating, proceed to the plate of the discharge tube where a sawtooth voltage should be observed. Continue tracing the signal path to the grid of the sweep amplifier tube where the sawtooth voltage is injected. If the signal is coming through to the grid, the next point at which the sawtooth voltage should be checked is across the yoke which is connected to the secondary circuit of the sweep output transformer. Do not place the oscillograph across the high side of the output transformer primary, because an induced voltage as high as 1000 volts is generated in some circuits, which would break down the input circuit of the oscillograph.
If the vertical sweep is not synchronized properly, the picture will jitter or roll in the vertical direction. Usually readjustment of the vertical hold control will re-lock the oscillator, if it has drifted out of synchronization. In some cases, a component may have failed in the integration circuit or in the sync separator circuits so that the sync pulse is distorted or is not coming through, permitting the sweep oscillator to run free.
To check for the presence of a good synchronizing pulse at the oscillator grid, connect the oscillograph between the grid pin of the oscillator tube socket and ground. Pull out the oscillator tube to stop oscillation and make it easier to observe the sync pulse. If no sync pulse appears at this point, go back to the input of the integrating circuit where the composite, clipped sync should be present. Continue the signal tracing, if need be, to the input of the sync clipping circuits, and finally to the output of the second detector. If the sync level appears compressed at the second detector, or a poor video signal is obtained at this point, the fault lies in the video IF or RF circuits.
In the simplified schematic of Figure 45 the points at which the vertical sync signal should be checked are indicated. Figure 46 shows the waveforms of the signals as they appear at these points in the circuit. A in Figure 46 is the composite video signal at the input to the sync separator. B shows the composite vertical and horizontal sync signals at the input of the integrator circuit. C is the waveform at the output of the integrator circuit. The horizontal sync signal has been removed and only the vertical pulses remain. This waveform should appear on the grid pin of the blocking oscillator tube socket when the tube has been removed. D is the waveform on the grid of the vertical sweep generator. The vertical sync pulses are not visible because they overlap the sharp blocking oscillator pulses.

Figure 45. Simplified schematic showing points in vertical sweep circuits
where waveform checks are made.
This signal is used to trigger the sawtooth generator. E is the output of the sawtooth generator. The small peaks in the lower part of the waveform are the peaking pulses produced by the peaking resistor. This signal is applied to the grid of the saw tooth amplifier. F shows the waveform of the signal as it appears across the secondary of the vertical output transformer and deflection coil.
Several vertical sweep troubles occur over which the technician has little control. For example, momentary loss of vertical synchronization due to line voltage surges or ignition interference from a passing automobile is quite common. Severe RF interference also causes unstable synchronization. Unless the interference can be trapped out of the RF stages or reduced by relocating the antenna, there is nothing the technician can do about it.
9-28 Horizontal Sweep Circuit Faults. As with the vertical sweep system, most of the troubles in the horizontal scanning circuits can be readily located by signal tracing and examination of waveforms in each stage. If the horizontal deflection has failed, a bright vertical bar will appear on the screen of the picture tube. To locate a fault in the horizontal sweep circuits, set the oscillograph sweep for about 15 khz and examine the waveforms at the following points in the circuit:
1. Across the horizontal deflection coil in the yoke, where a sawtooth voltage should be observed.
2. At the grid of the sweep amplifier. Note that the plate circuit of the amplifier tube and the primary of the output transformer are not check points. In the horizontal circuit, induced voltages at these points are sometimes as high as 5 kv, far above the allowable input to the oscillograph.
3. Check for sawtooth voltage on the plate of the discharge tube.
4. The final check point is the grid of the oscillator tube where oscillations should be detected.
------------
----------
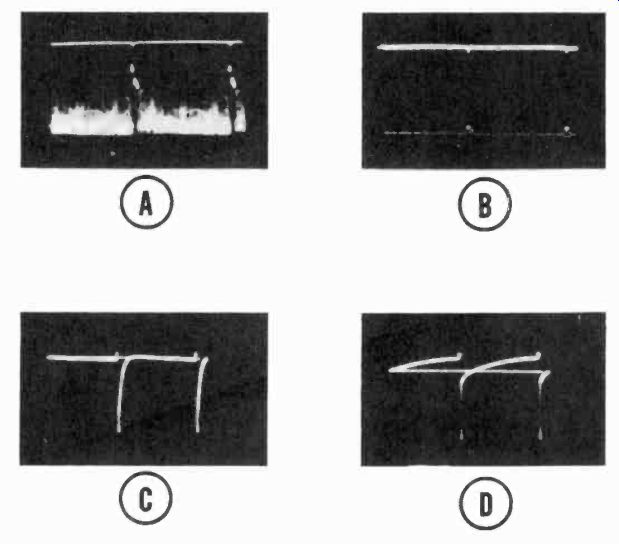
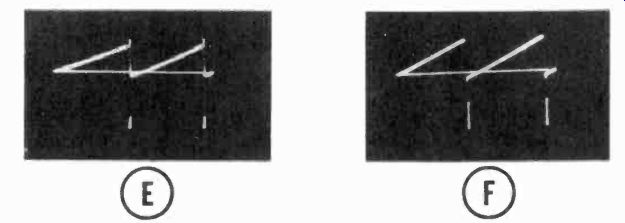
Figure 46. Waveforms at points in vertical sweep circuit indicated in Figure
45. A. Input to sync separator, B. Input to integrating network C. Output
of integrating network, D. Grids of blocking oscillator and sawtooth generator.
E. Plate of sawtooth generator F. Secondary of vertical output transformer.
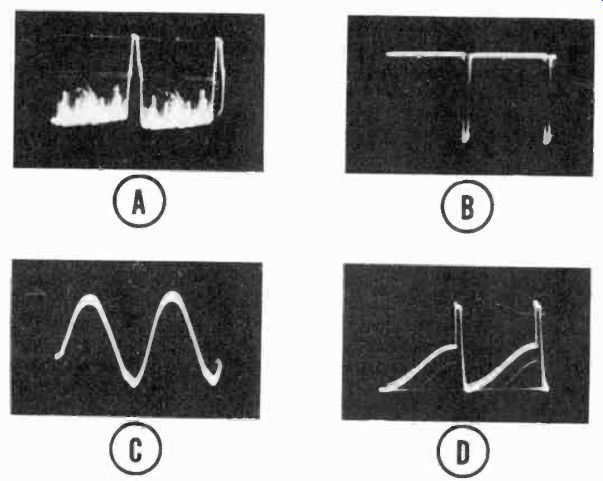
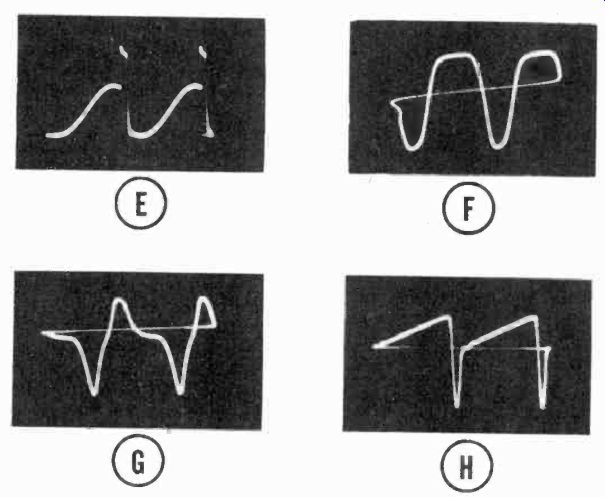
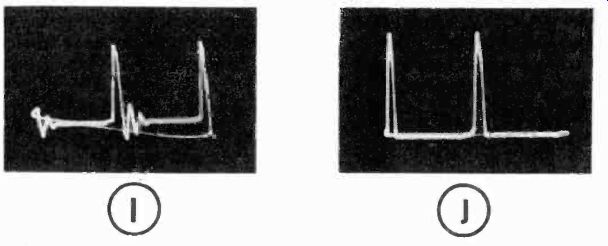
Figure 47. Waveforms in horizontal sweep circuit using flywheel synchronization.
Points at which waveforms appear are indicated in Figure 48. A. Input to sync
separator, B. Output of sync separator, C. Primary of sync discriminator transformer,
D. Center tap of sync discriminator transformer secondary, E. Plates of sync
discriminator diodes, F. Plate of horizontal oscillator, G. Grid of discharge
tube, H. Plate of discharge tube, I. Plate of horizontal deflection amplifier,
J. Secondary of horizontal output transformer.
----------------------
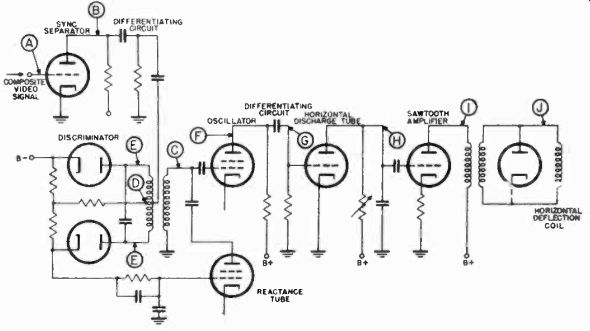
Figure 48. Simplified schematic of horizontal sweep circuit employing fly-wheel
synchronization. Waveforms of Figure 47 appear at points indicated.
A step-by-step procedure for signal tracing a horizontal sweep circuit containing automatic frequency control synchronization is given in the oscillograms of Figure 47. These circuits are somewhat more complicated but a careful examination of the waveforms at important points makes it quite simple to locate a fault. A in Figure 47 shows the waveform of the composite video signal at the input to the sync separator. B is the waveform at the output of the sync separator. Only horizontal pulses remain. C is the sine wave oscillator voltage which should appear on the primary of the sync discriminator transformer.
D is the signal at the center tap of the sync transformer secondary. It consists of the sine wave oscillator voltage and the horizontal sync pulses. E shows the signal which should be present on the plates of the sync discriminator diodes. F is the signal at the plate of the horizontal oscillator. It is a sine wave with a flattened top brought about by overloading the oscillator. G is the waveform which should be secured at the output of the differentiating circuit. These pulses are applied to the horizontal discharge tube. H is the waveform at the plate of the discharge tube. It consists of a sawtooth voltage and a peaking pulse. This signal is applied to the horizontal deflection amplifier. I is the signal on the plate of the horizontal deflection amplifier. This signal has a peak-to-peak amplitude in excess of 5000 volts, and while it can be checked through the use of a suitable capacitive voltage divider, it is usually ignored in normal signal tracing procedure. If the oscillograph is connected directly to this point in the circuit, it will be damaged. J is the signal on the horizontal deflection coil and horizontal output transformer secondary. This point may be checked without fear of damaging the oscillograph.
In Figure 48 the check points described are indicated by letters which correspond to the waveforms of Figure 47.
9-29 Picture Tube Faults. Servicing the picture tube calls for extreme caution. These tubes are evacuated and are thus under great pressure. A sharp blow against the glass may cause the tube to shatter. It is wise to wear goggles when handling the picture tube.
Very high voltages are used to operate the picture tube so that the set should be turned off and the high voltage condenser in the power supply given time to discharge before disconnecting the high voltage lead from the intensifier electrode.
Aging of the tube through use causes the cathode emission to become weak and the screen material to decay from continual bombardment by the electron beam. The result is a picture with reduced brightness and a brownish tinge. Most manufacturers guarantee their picture tubes for one thousand hours of operation, or one year, whichever occurs first.
When deflecting circuits fail, the electron beam concentrates at one point and burns away the screen material, leaving small black spots in the center of the tube. Some receivers are provided with protective circuits which shut off the high voltage if the sweeps fail, thus cutting off the beam and preventing screen burning.
Not all television tubes are designed with ion-trap guns which prevent burning of the screen by positively charged ions. An ion burn shows up in the center of the tube screen as a brown spot about the size of a half dollar.
Picture tubes sometimes develop leaks and, as a result, they gradually fill with air. No usable picture will be obtained under this condition and the "getter" will appear milky white.
When the screen of the picture tube remains blank and the receiver is operating normally in all other respects, an open picture tube filament may be the fault. A glance at the electron gun will determine whether or not the filament is lit and in good condition.
If a receiver uses electrostatic deflection, the deflection electrodes can be knocked out of line as a result of a severe jarring of the tube. This results in a distorted picture. Severe jarring can also throw the entire gun assembly out of line and prevent proper focusing of the beam.
9-30 Power Supply Faults. Most receivers have interlock switches which break the a-c line circuit when the chassis is removed from the cabinet. A jumper must be placed across the interlock switch in order to operate the receiver outside the cabinet.
If trouble is suspected in the high voltage supply, first make continuity and resistance checks with an ohmmeter while the set is off. Most faults can be located in this manner. Should it be desirable to actually measure the high voltage, connect the meter across the supply while the set is off. Then turn it on and take the reading. Be sure to turn the set off again and allow ample time for the condensers to discharge before removing the meter lead from the high voltage terminal.
If the picture tube filament is lit, but no beam current is flowing to the screen to give at least a spot, there is probably an open in the high voltage circuit. Check the rectifier tube and the filter condensers and resistors. The effects of defective filter components are described elsewhere in this section.
If there is a poor contact at the intensifier terminal, caused by a loose connector or dirt between the high voltage connector and the terminal, there will be intermittent breakdown at this point, resulting in picture "bop". The trouble is easily cured by cleaning the terminal and making a secure connection.
Low output voltage from RF high voltage supplies may be caused by drift of the RF oscillator from its correct operating frequency. By tuning the tank circuit of the oscillator and noting the output voltage on a kilo-voltmeter, or by observing the brightness of the picture tube while the oscillator frequency is varied, the maximum voltage can be obtained.
Low voltage may be caused also by a defective oscillator or rectifier tube. The filament of the type 8016 rectifier tube, which is used in most RF supplies, is very susceptible to damage. Even a momentary overload of the heater due to a sudden line voltage surge will cause damage. Although the color of the filament may appear normal to the eye after the overload, the tube will not perform satisfactorily, and insufficient output voltage will be obtained. Substitution of a new tube is the simplest and quickest means of checking for a defective rectifier.
The mechanical construction and layout of RF power supplies are critical, for at the high voltages at which they operate, corona discharge points are difficult to avoid. Corona results in power loss. When present in the RF coil windings, the corona gradually destroys the fine strands of litz wire. Corona on the RF coil is generally due to the weakening of the vacuum varnish with which the coil is impregnated. Corona discharge appears as a bluish glow. It becomes greater in humid weather, so that a coil which appears to operate normally in a dry atmosphere may break down when more moisture is in the air. Applying a good grade of varnish to the points of corona discharge will usually clear up the trouble.
Corona at points of high potential, particularly at poor solder joints and irregularly surfaced conductors is common. The solder should be flowed on all high voltage joints. In general, it should be remembered that a smooth, round surface is less susceptible to corona than a sharp, pointed one. Severe corona will produce noise in the television picture.
If the filament loop on the high voltage, RF coil should move out of place, the filament voltage will drop. If the loop must be moved, care should be taken to place it in the same position it originally occupied. Otherwise, the coupling to the RF transformer may be increased and the rectifier filament overloaded.
Similarly, a loose coupling will not permit the filament to be heated sufficiently, resulting in low output voltage and poor high voltage regulation.
The mechanical troubles described for the RF supply also apply to the pulse-type supply. The autotransformer is pi-wound with litz wire and is subject to corona damage as is the RF transformer. The same precautions hold for the filament winding of the rectifier tube in the pulse-supply as were discussed for the RF supply.
Since the high voltage that is generated in a kickback supply is dependent upon the horizontal sweep circuit, a failure in this circuit will result in loss of high-voltage output. If no high voltage is obtained at the picture tube, signal trace the horizontal sweep circuit, starting at the output transformer and working toward the sawtooth generator. If this circuit is operating correctly, the trouble exists in the high voltage rectifier circuit.
The rectifier tube or a component in the R-C filter is usually the cause.
The foregoing paragraphs have dealt with procedures for troubleshooting television receivers. After the fault is located, it should be repaired and necessary checks and adjustments made to put the receiver back in working order. These checks and adjustments are described on the following pages.
CHECKING AND ADJUSTING THE RECEIVER
9-31 To assist the technician in adjusting a receiver, television stations send out a test pattern several hours a day. The use of the test pattern alone for checking and adjusting the receiver is a hit or miss affair, and in many cases may require undue time and effort if no other technique is understood. A more important reason for not depending entirely upon test patterns for adjustment is that such signals are on the air only a few hours each day. Obviously a shop with several sets to repair and adjust must have other methods available. For this reason, adjustment procedures will be described which depend mainly upon instruments. Minor adjustments can then be made when an "on the air" test pattern is available.
Usually a fault in a receiver is located by the technician during the troubleshooting procedure. When the fault has been located, adjustment is usually necessary to compensate for the slight changes which occur when the repair is made. In addition, it is good practice to make a general check and adjust a receiver before returning it to the customer.
9-32 Checking and Adjusting the Picture Tube. It is important that the picture tube be carefully adjusted so that maximum resolution and definition in the picture will be obtained. It is useless to employ a picture channel with a bandwidth of 4 megacycles unless the size of the luminescent spot produced on the picture tube is small enough to permit the reproduction of the detail possible in a 4 Mhz signal. Such resolution can be obtained only if the gun structure is properly aligned and the electron beam is in focus. Receivers employing picture tubes ten inches or less in diameter are generally designed with bandwidths between 2 and 3 Mhz, because the size of the spot produced in these tubes will not permit greater picture detail. In any event, to realize the full benefits of the band width of a receiver, the spot size must be made as small as the design of the tube permits.
9-33 Adjustment of Electrostatically Focused Tubes. To focus an electrostatic picture tube, it is only necessary to vary the focus control potentiometer. This potentiometer is connected in series with the bleeder of the high voltage supply and controls the voltage on the first anode. The focus adjustment should always be made with a picture on the tube. Since the focus depends upon the amount of beam current, some manufacturers locate the focus control on the front panel of the receiver so that the operator can vary the focus when changing the picture brightness. Other manufacturers place this control on the high voltage chassis, where it is inaccessible to the user. In this case, the technician must adjust the focus for an average brightness condition.
Another control is often used with electrostatically focused and deflected picture tubes. This control is the astigmatism control, which is used to balance the d-c potential on the deflecting plates, and to correct for differences in potential between the plate and second anode. Large differences in potential between these electrodes cause the spot to be astigmatic (oval-shaped). An astigmatic spot causes defocusing of the beam as it scans certain parts of the screen. The astigmatism control, if present, is usually located on the rear of the chassis.
It should be varied simultaneously with the focus control to achieve optimum picture sharpness. There is no need for an astigmatism control if an electrostatically focused and magnetically deflected tube is used.
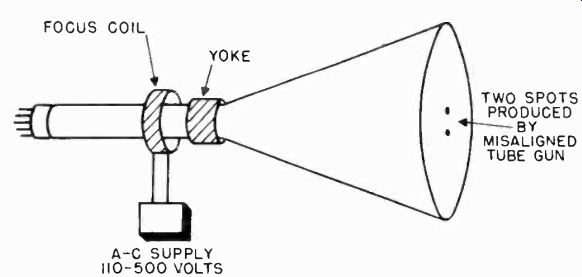
Figure 49. Method used to align focus coil using 80-cycle supply.
9-34 Focusing the Magnetic Tube. The focusing of a magnetic tube is dependent upon the position of the focus coil with respect to the electron gun, and the amount of current flowing through the coil. The positioning of the focus coil can best be carried out using a test pattern. The effects upon the test pattern are observed while the coil is moved about on the neck of the tube. When a test pattern is not available and careful positioning is required, as is necessary with large tubes, the following procedure may be employed:
Pull out the vertical and horizontal oscillator tubes in the deflection circuits so that, when the set is turned on, only a spot will appear on the face of the picture tube. Note: Be sure the power is off when pulling out the tubes, and be careful to have the brightness control down to avoid burning a spot on the screen when the power is turned on again.) Disconnect the focus coil leads from their d-c supply source and connect the coil across an a-c supply. If the focus coil is of low impedance, the line voltage of about 115 volts will be sufficient. If the receiver has a high impedance focus coil, three to five hundred volts will be required, which may be obtained from a transformer. The connections for this adjustment are shown in Figure 49. With the a-c on the focus coil and the receiver turned on, two spots will appear on the face of the tube if the focus coil is misaligned with respect to the electron gun. The two spots are produced by the positive and negative peaks of the a-c current in the focus coil.
The focus coil should be moved around the neck of the tube until the two spots are superimposed. It is only when this condition is achieved that there will be no astigmatism of the electron beam. The focus coil is then properly aligned to avoid trapezoidal distortion and pincushioning.
Receivers with magnetically focused tubes generally have a mounting for the focus coil which enables it to be moved in three planes. After the spots have been lined up, re-connect the coil to its dc supply, and replace the sweep oscillator tubes. The focus control which changes the amount of current flowing in the coil may now be varied to obtain the sharpest picture. This control is generally located on the front panel of the receiver and is adjusted by the operator for the desired setting of the brightness control.
9-35 Orienting the Picture. With the focus coil properly aligned, the raster maybe oriented so that it is "in square" with the mask aperture. In receivers with magnetic tubes, the deflection yoke is rotated to correctly orient the picture. In order to better observe the orientation, the horizontal width and vertical height should be decreased by adjusting the respective controls until the edges of the raster can be seen.
In receivers using electrostatic deflection tubes, the tube itself must be rotated until the raster is oriented correctly with respect to the mask aperture. The same technique of reducing the width and height with magnetic tubes should be used. Note that in a correctly oriented raster the vertical retrace lines, which are normally blanked out when the picture signal is applied, slope upward from left to right, which indicates that scanning is in the proper direction. Sometimes the connections from the sweep amplifiers to the deflecting plates or the yoke are reversed, and the retrace lines do not slope in this direction.
This results in a picture that is backward or upside down.
Adjusting Ion Traps. Magnetic tubes which have ion traps require a different procedure for adjusting the electron beam.
The ion trap magnet should be adjusted before attempting to line up the focus coil and deflection yoke, for unless the magnet is correctly positioned, the electron beam will strike the second anode in the electron gun and no illumination will appear on the tube.
The ion trap magnet is initially positioned so that the rear magnet poles are over two small flags attached to the electron gun. This pre-positioning insures some illumination of the screen. Starting from this position, adjust the magnet by moving it forward or backward, at the same time rotating it slightly around the neck of the tube to secure the brightest raster on the screen. Tighten the magnet adjustment clamp sufficiently to hold it in this position, but leave it free enough to permit further adjustment. Reduce the brightness control setting until the raster is slightly above average brilliance. Adjust the focus control until the line structure of the raster is clearly visible. Readjust the ion-trap magnet for maximum raster brilliance. The final touches on this adjustment should be made with the brightness control at the maximum position with which good line focus can be maintained.
Since an improperly positioned focus coil can cut off the electron beam, the focus coil should be positioned as carefully as possible before adjusting the ion-trap magnet. After the magnet is set, final positioning of the focus coil can be accomplished by using the methods previously described.
9-36 Adjusting the Sweep Circuits. An instrument test procedure to check and adjust the sweep generators and amplifiers in the vertical and horizontal scanning systems is presented here. The technician should not depend upon a test pattern alone to adjust linearity. In addition to the fact that a test pattern is not always available, linearity of the test patterns transmitted by stations varies considerably from day to day. Thus, if the sweep linearity of the receiver circuits is adjusted on one day to give a linear test pattern on a particular station, on another day or on another station the linearity maybe very poor. Until the FCC requires that all stations adhere to a rigid standard for linearity, the instrument method is the only positive procedure for checking and adjusting the scanning system. Once these adjustments are made, no further changes should have to be made when a picture appears on the tube.
It is possible to check the amplitude and linearity of scanning in both vertical and horizontal directions with the aid of a variable frequency oscillator. The oscillator should be capable of supplying at least 20 volts of signal and have a frequency variable from about 60 cps to about 700 khz. Very few shops have such an oscillator available. They will, however, usually have an audio oscillator and an RF oscillator wt ich will provide the necessary coverage. The output of the oscillator is connected between the grid and cathode of the picture tube and also to the grid of the sweep oscillator, as shown in Figure 50. Note the use of an isolating capacitor in the output lead of the signal generator. If sufficient voltage is not available to operate the picture tube directly, the oscillator output may be fed into the video amplifier.
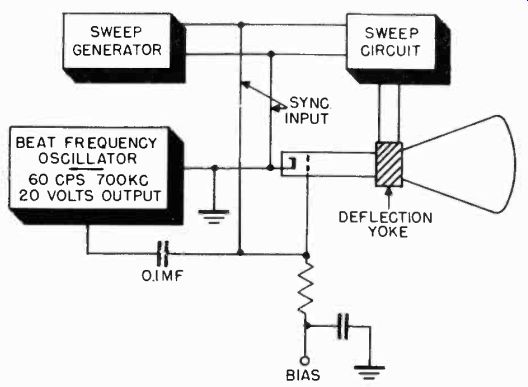
Figure 50. Method used to check linearity of scanning circuits.
To adjust the vertical circuits, the external oscillator should be set at 60 cps. The vertical hold control should then be adjusted until the circuit locks into synchronism with the applied sine wave. The electron beam in the picture tube is modulated by the 60-cycle oscillator signal and consequently, the scanning motion and variation in brightness occur synchronously, resulting in two stationary horizontal bars, one bright, the other dark.
The scanning circuits are operating at standard line frequency and most of the characteristics of the vertical scanning system can be checked.
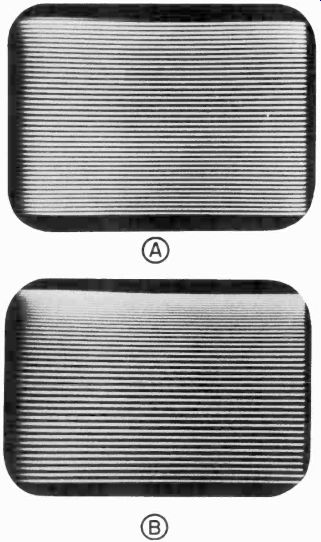
Figure 51. Linearity bars for checking vertical scanning. A. Linear scanning,
B. Non-linear scanning.
The scanning amplitude is indicated by the total height of the synchronized scanning pattern. If the amplitude is insufficient, the height control may be adjusted. When using this method to adjust the height control of a magnetic receiver, it is important that the oscillator be set at a frequency of 60 hz, because in magnetic scanning the sweep amplitude is dependent upon the sweep frequency. The sweep linearity varies with frequency in both magnetic and electrostatic scanning.
The oscillator method enables the technician to pre-set the vertical hold control so that the sawtooth oscillator is operating at the correct frequency. It maybe necessary to vary the vertical sync control very slightly when a television signal is tuned in, in order to obtain proper interlace of the vertical sweep.
The oscillator method does not offer a means of simulating the equalizing pulses necessary for interlaced scanning. However, as long as the sync control is set close to 60 hz, the amplitude and linearity will not be affected by the small sync control variation which may be necessary to interlace the "over-the-air" pattern.
After the vertical scanning amplitude has been adjusted, the linearity of scanning maybe checked by increasing the frequency of the oscillator successively to 120, 240, 480, 960, 1920, 2400, and 3600 hz (or any other multiple of 60). Since these frequencies are multiples of the 60 cps scanning frequency, the scanning circuit will synchronize on every second cycle at 120 hz, every fourth cycle at 240 hz, and so on.
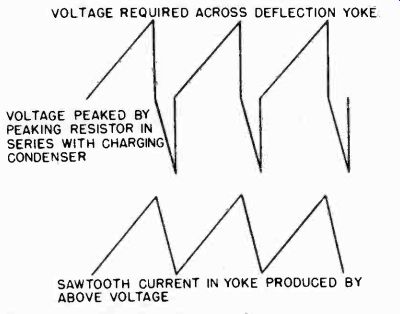
Figure 52. Voltage and current waveforms required for magnetic deflection.
At a frequency of 2400 cps, the scanning circuit synchronizes every fortieth cycle. Since this signal is also applied to the grid of the picture tube, 40 horizontal bars will appear on the screen.
If the vertical scanning is linear, these bars will be equally spaced as shown in Figure 51A. If usually necessary. In order to produce a sawtooth deflection current in the yoke, a voltage having the waveshape shown in Figure 52 must be generated. The output of the discharge tube is normally a sawtooth voltage. The waveform shown in Figure 52, required for linear deflection, is obtained by placing a peaking resistor in series with the charging capacitor. If, due to aging or changes in other components in the charging circuit, the peaking resistor is not of the correct value, the current in the yoke will no longer be a linear sawtooth, and the lines at the top of the raster will begin to fold over into the picture. Since most receivers have a fixed resistor for "peaking", it must be replaced with a resistor of proper value. To do this, substitute a variable resistor to determine the correct value, after which a fixed resistor maybe used in its place. This change will have to be made only if a resistor, capacitor, or other component in the charging circuit changes with age or becomes defective.
Figure 53. Pattern produced in horizontal scanning amplitude test with 15,750-hz
signal on grid.
9-38 Adjusting Horizontal Sweep Circuits. A very similar procedure is followed for checking the performance of the horizontal sweep system. The external oscillator connections shown in Figure 50 are used. The oscillator should be set to 15,750 hz. The horizontal hold control should be adjusted until the sweep oscillator is synchronized with the applied 15,750 hz.
A pattern consisting of two vertical bars should appear on the screen, as shown in Figure 53. The positive half of the sine wave produces the bright bar, while the negative half produces the black bar.
With the horizontal oscillator synchronized at 15,750 hz, the scanning amplitude maybe adjusted so that the pattern fills the mask aperture.
9-39 Effect of Line Voltage on Scanning Circuits. The vertical and horizontal sweep amplitudes are affected by changes in the power line voltages. When the a-c voltage falls, the receiver power supply voltage drops, and the picture is reduced in size.
If the size controls have been set so that the picture just fills the mask aperture when the line voltage is at the nominal 117 volts, the picture will be smaller than the mask opening when the voltage drops below this value. Similarly, the picture will spread beyond the mask limits if the line voltage increases.
Since the line voltage generally varies as much as plus or minus 10 per cent from the nominal 117 volts, a compromise must be made when setting the picture size. Usually the change in picture size will not be noticed if the picture always fills the mask opening or extends beyond its limits, whereas it becomes very obvious to the viewer when the picture does not fill the aperture.
It is therefore best to set the picture size so that the mask opening is just filled when the line voltage is at its lowest (about 10% below 117 volts, or 105 volts). An excellent way to adjust the picture size is to connect the receiver to a variable transformer, such as a "Variac", and adjust the picture with the line voltage set at 105 volts.
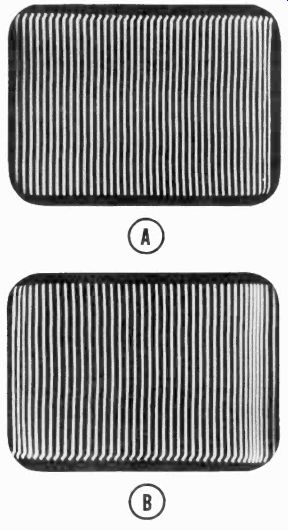
Figure 54. Linearity bars for checking horizontal scanning. A. Linear scanning,
B. Non-linear scanning.
9-40 Adjusting Horizontal Linearity. To check the linearity of the horizontal sweep, the oscillator frequency should be increased to a multiple of 15,750 hz in order to produce a sufficient number of vertical lines on the screen. To obtain a pattern of 40verticalbars, such as shown in Figure 54, a frequency of 630,000 hz is necessary. The linearity controls should then be adjusted until the spacing between bars is uniform.
It is possible that no setting of the horizontal linearity controls will produce linear deflection. If such is the case, the damping tube may have failed. This condition is indicated by an overlapping of the vertical bars on the left side of the picture.
Replacing the damping tube should cure the trouble. In receivers which use a resistor-capacitor combination for damping, instead of a tube, these components should be checked.
Another cause of non-linearity is the failure of a component in the horizontal deflection circuit, as for example a defective charging resistor or capacitor in the sawtooth generator circuit, or a faulty sweep-amplifier tube. Such faults should be isolated by signal tracing the entire sweep circuit and comparing the waveforms with those shown in the manufacturer's service manual.
This completes the adjustment of the circuits which control the motion of the electron beam across the face of the tube. It remains now to describe the methods for aligning the video and audio amplifier circuits.
ALIGNMENT
9-41 Since the band width and selectivity of a television receiver determine the quality of the picture and sound, it is important that the alignment of the tuned circuits be carried out with care in order to obtain the band width and selectivity for which the receiver was designed. Poor alignment will result in loss of picture detail, noise in the picture or distortion of the sound. Before beginning the alignment of a receiver, the technician should determine the intermediate frequencies, sensitivity, band width, and response characteristics of the receiver when it is properly aligned. This information can usually be found in the manufacturer's literature.
When complete alignment of a receiver is necessary, it can be performed most conveniently in the order given below (If only a section of the receiver must be aligned, as determined during troubleshooting, some of the alignment procedures described here can be bypassed):
1. Sound discriminator.
2. Sound limiter.
3. Sound IF transformers.
4. Video amplifier.
5. Picture IF transformers.
6. Picture IF traps.
7. R-F tuner.
8. Overall band width check.
9. Sensitivity check.
Variations in this order may be necessary, depending upon the design of the receiver. As a rule, however, the order given will be the best one.
The various sections of a receiver and the order in which they are aligned are indicated in the block diagram of Figure 55.
It will be noted that the sound system is aligned first, working from the discriminator toward the IF amplifier input. The sound system is aligned first because once it is properly tuned, it serves as a reference for the alignment of the video circuits.
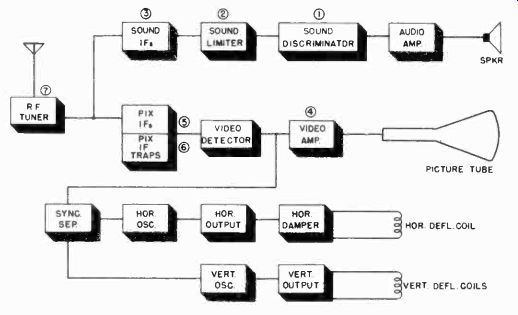
Figure 55. Order in which sound and video circuits are aligned.
It is common practice to tune a television receiver by adjusting for maximum sound and if the receiver is properly aligned, the best picture should be obtained simultaneously.
The video circuits should be aligned by working back from the grid of the picture tube to the video IF circuits and finally to the RF tuner. Using this procedure, the video amplifier is first aligned with an output-indicating instrument connected across its output (the output of the video amplifier is also the input to the picture tube). The indicator is left at this point, and each previous stage aligned in turn. Since the indicating instrument is at the last stage, it will show the overall band width of all of the preceding stages, as each is adjusted in turn.
Another technique is to move the output indicator to the output of each stage, as the alignment proceeds. The overall band width is then the sum of all the stages.
The quickest way to align tuned circuits is to use a sweep generator and cathode ray oscillograph. It is also possible to align
some circuits using a signal generator and vacuum tube voltmeter. Both methods are described here.
DISCRIMINATOR ALIGNMENT
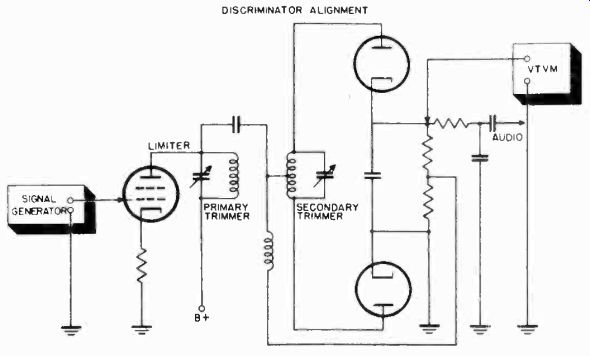
Figure 56. Connections used when aligning discriminator
using v.t.v.m.
When making adjustments to IF and RF circuits a plastic screwdriver several inches long should be used. If a metallic screwdriver is used the circuit being adjusted will go out of alignment each time the screwdriver is removed from its vicinity.
9-42 Discriminator Alignment with Signal Generator and VTVM. The alignment of the discriminator using a VTVM and signal generator may be accomplished using the following procedure:
1. Connect the VTVM between the cathode of the discriminator and ground as shown in Figure 56.
2. Connect the signal generator to the grid of the last limiter stage.
3. Adjust the output of the signal generator to about 0.1 volts and set its frequency to the sound IF carrier frequency specified by the manufacturer (this will be about 21 Mhz).
4. The polarity of the voltages indicated by the VTVM will be plus or minus depending upon the setting of the secondary of the discriminator coil.
5. Adjust the secondary of the discriminator coil to obtain a zero reading on the voltmeter. The secondary trimmer capacitor can be located by checking the two capacitors in the discriminator transformer with a voltmeter. The secondary trimmer will not have any voltage present on it while the primary trimmer has the plate voltage of the previous stage applied to it.
6. Move the VTVM probe to the junction of the two cathode resistors.
7. Adjust the primary of the discriminator coil to secure maximum output, as indicated by the VTVM.
8. Change the frequency of the signal generator to 50 khz above the IF frequency and note the output voltage developed. Then change the signal generator frequency to 50 khz below the center frequency and note the output voltage. The voltages should be equal at equal frequency intervals on either side of the center frequency. The primary should be adjusted until this condition exists.
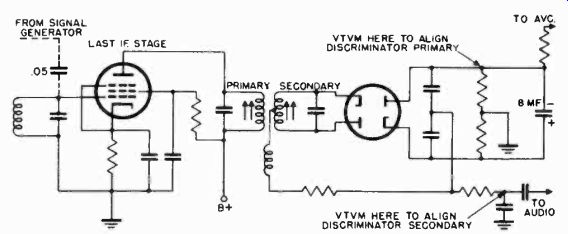
Figure 57. Connections used when aligning ratio detector using v.t.v.m.
If the receiver to be aligned uses a ratio detector, the alignment should be carried out in the following manner:
1. Connect the VTVM across the detector as shown in Figure 57.
2. Set the signal generator to the sound IF frequency.
3. Tune the primary of the detector transformer to secure maximum reading on the VTVM.
4. Move the VTVM to the input of the first audio stage as shown in Figure 57.
5. Adjust the secondary of the detector transformer to secure zero output as indicated by the VTVM. If the circuit in the receiver is similar to that shown in Figure 58, in which the center tap of the load resistor is not grounded, an effective center tap can be secured as shown. Connect two resistors in series across the load resistor. These resistors should each have a resistance equal to about five times the value of the load resistor. The VTVM should be connected to the junction of the resistors when adjusting the secondary of the detector transformer for zero output at the IF carrier frequency.
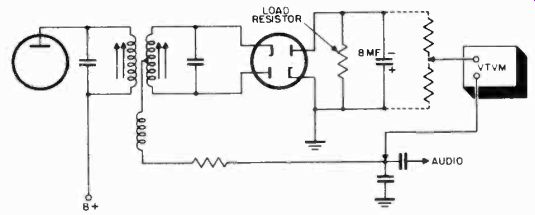
Figure 58. Use of series resistors to obtain midpoint when aligning ratio
detector.
9-43 Discriminator Alignment with Sweep Generator and Oscillograph. A frequency modulated signal generator, marker oscillator, and oscillograph can be used to accurately and quickly align the discriminator stage. The procedure to align a discriminator using this equipment is as follows:
1. Connect the sweep generator between the grid of the last limiter tube and ground as shown in Figure 59. If the sweep generator has a built in synchronizing voltage for locking the sweep signal of the oscillograph to the sweep frequency, this sync voltage should be connected to the "sync" terminal of the oscillograph. Some sweep generators supply a sweep voltage which can be applied directly to the horizontal amplifier terminals of the oscillograph.
2. Set the center frequency of the signal generator to the IF frequency specified by the manufacturer. Adjust the frequency deviation to approximately 200 khz.
3. Connect the oscillograph across the discriminator output. The oscillator sweep circuit should be adjusted so that a single pattern is obtained on the oscillograph screen. Either a double pattern or a single pattern can be obtained, depending upon the type of sweep signal furnished by the sweep generator. To provide a single pattern most sweep generators are equipped with a phasing control.
4. Set the marker oscillator to the IF frequency and connect it across the output terminals of the sweep signal generator.
Another method of inserting the marker signal is to connect the high side of the marker generator output to the point on the chassis where the sweep signal generator is grounded. Connect the ground side of the marker generator to another point on the chassis. While it appears that the output of the marker generator is shorted, this is not the case, since there is sufficient impedance between the two points on the chassis to serve as a load for the marker generator. This method of inserting the marker signal avoids loading the grid of the limiter during alignment.
5. Adjust the secondary trimmer of the discriminator transformer so that the marker signal occurs at the center of the straight portion of the output curve. The curve will actually appear as shown in Figure 60A. The marker signal causes the breaks in the curve.
6. Readjust the marker generator frequency to the band width extremities specified by the manufacturer. The marker signal, or `birdie", as it is called, should appear at one and then the other of the signal peaks as shown in Figure 60B.
7. Adjust the primary trimmer of the discriminator transformer so that the positive peak of the output curve is equal to the negative peak.
If a ratio detector is used, it may be aligned in much the same manner. The sweep generator should be connected to the grid of the last sound IF stage and the oscillograph to the output of the detector.
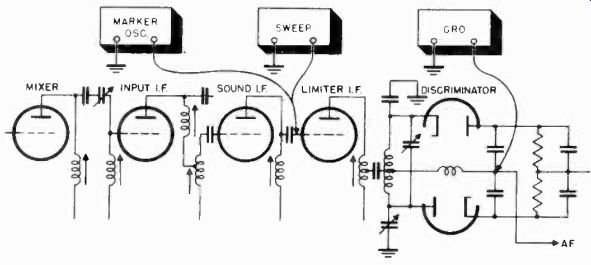
Figure 59. Connections used when aligning discriminator using oscillograph
and sweep generator.
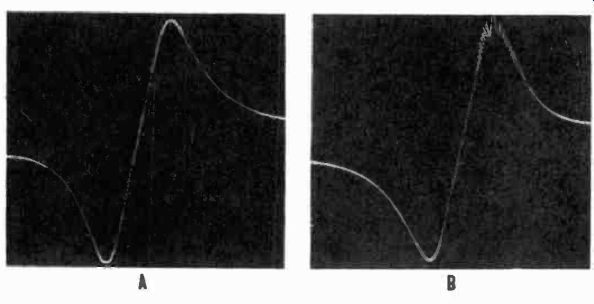
Figure 60. Signal on oscillograph produced by discriminator output. A. Marker
signal at center frequency, B. Marker signal at signal peak.
9-44 Checking the Limiter. When the limiter in an FM circuit is operating properly, it passes all signals up to a certain amplitude. Signals (such as noise riding on top of the sound signal) which exceed this amplitude, are greatly compressed. The characteristic curve of the limiter is shown in Figure 61. This curve represents the output of the limiter for various input voltages. As the input voltage increases, the output voltage increases proportionately. When the input signal exceeds a certain level, a change in input will not produce a corresponding change in output. Above point A (which is referred to as the "knee" of the curve and is the voltage at which limiting action starts), the output voltage stays the same even though increasing signal voltages are fed to the input.

Figure 62. Connections used when checking limiter performance.
To check the action of the limiter, a signal generator and v.t.v.m. are connected as shown in Figure 62. The signal generator is coupled to the grid of the limiter and the v.t.v.m. to the junction of the resistors in the cathode circuit of the detector. Set the v.t.v.m. to read negative d-c volts.
The signal generator output voltage should be adjusted to give about 100 microvolts input to the grid of the limiter. The signal generator output should then be gradually increased while the reading on the v.t.v.m. is observed. The manufacturer's manual should be consulted for the voltage which corresponds to the knee of the limiter response curve. The dc output, as indicated by the v.t.v.m. should increase up to this point, after which the voltage should remain constant. The limiter is operating correctly if the knee point corresponds to the specified value. If not, the voltages on the tube should be measured and compared with the manufacturer's specifications.
9-45 Aligning the Sound IF Amplifiers. Several methods are available for aligning the sound IF amplifier stages of the receiver. The quickest and most effective method requires a sweep generator, an oscillograph, and a marker oscillator.
Using this equipment, the IF amplifier stages may be aligned individually or all together. If a stage is aligned individually, the oscillograph should be connected to its output through a probe and the sweep generator and marker generator connected to its input. The probe required consists of a diode and other components necessary to detect the signal so that it may be observed on the oscillograph. The construction of such a probe is described in Section 10.
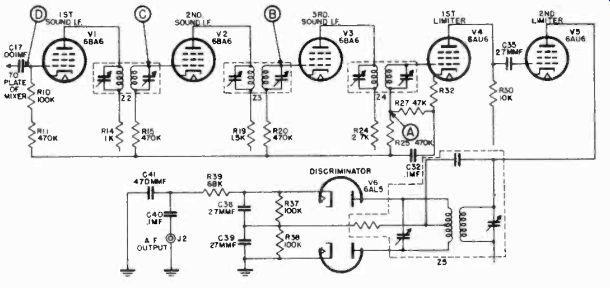
Figure 63. Simplified schematic of sound channel showing points used to connect
instruments for alignment.
While stage-by-stage alignment is considered the best procedure to follow when working with wide band, overcoupled amplifiers, it consumes an excessive amount of time. Since overall alignment, if carefully done, will give generally satisfactory results, it is recommended, except in isolated instances. The following procedure for aligning the sound IF amplifiers of a television receiver is described with reference to the circuit shown in Figure 63.
1. Connect the oscillograph through the probe detector across resistor R27 (point A), which is in the grid circuit of the first limiter tube V4. The oscillograph is left at this point during the alignment procedure.
2. Connect the sweep generator between the grid of V3 (point B), the last sound IF amplifier, and ground.
3. Set the center frequency of the sweep generator to 21.9 Mhz. Adjust the sweep frequency for approximately 200 khz.
4. Adjust the oscillograph to a sweep frequency of 60 cycles and synchronize the pattern which appears on the screen. Then, by increasing the horizontal gain control and adjusting the horizontal positioning control, obtain a single IF curve on the screen, as shown in Figure 64A.
5. Frequency markers may be inserted externally (if the sweep generator does not have built-in markers) by connecting the marker generator in parallel with the sweep generator, point B.
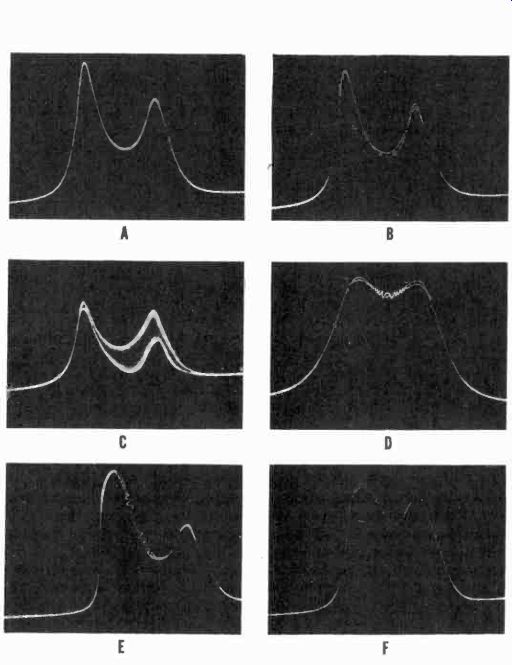
Figure 64. Response curves of sound IF amplifiers. A. Single IF response curve,
B. Response curve with birdie at 21.9 Mhz, C. Effect of too much birdie, D.
Response curve of properly aligned IF amplifier, E. Effect produced by slight
overload, F. Effect produced by excessive overload.
6. Set the output of the marker oscillator to 21.9 Mhz to produce a birdie as shown in Figure 64B. Do not feed too large a birdie signal to the amplifier, otherwise the pattern will be distorted as shown in Figure 64C.
7. Adjust the tuning capacitors in Z4, the f-f transformer between V3 and V4, to obtain a nearly flat response curve which is symmetrical on both sides of the center frequency, as indicated by the birdie. An example of this response curve is shown in Figure 64D. In performing this alignment procedure, it is worth noting that the a.v.c. need not be disconnected, since the low impedance of the sweep generator, which is connected across the grid resistor, automatically shunts the a.v.c. and previous stages.
8. To align the sound IF amplifier, leave the oscillograph at point A and move the sweep generator and marker oscillator to the grid of V2 (point C).
9. Adjust Z3, the IF transformer between V2 and V3 to obtain a flat response curve, using the procedure just described.
10. The first IF stage is adjusted in a similar manner. Move the sweep generator and marker oscillator to the grid of V1 (point D).
11. Adjust Z2, to obtain a flat response curve. In making this adjustment, be sure that the output of the sweep generator is not so high that it overloads the second and third IF stages. Figure 64E and 64F show conditions of overload when the sweep generator signal is set too high.
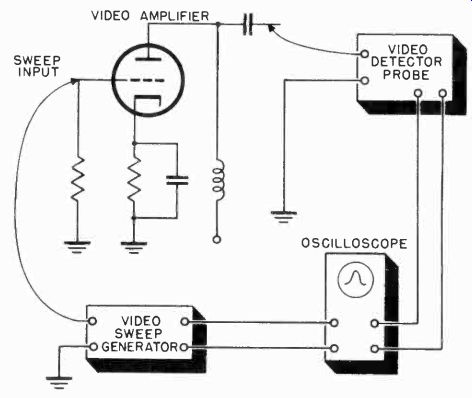
Figure 65. Connections used to adjust video amplifier using sweep generator
and oscillograph.
9-46 Adjusting the Video Amplifier. In order to secure the broad band response required of them, one or more peaking coils are used in the video amplifier circuits of the television receiver. As a rule, the impedance of the coils is variable, and they must be adjusted to secure the required band width characteristics.
Three methods are available for adjusting the peaking coils in the video amplifier: (1) Using a signal generator and v.t.v.m., (2) using an oscillograph and sweep generator, and (3) using a square wave generator and oscillograph. The first method mentioned is tedious and time consuming, since it requires that the output of the amplifier be measured at several different frequencies each time an adjustment is made. The second and third methods are both good ones and will be described here.
The following procedure is used when aligning the video amplifier with a sweep generator and oscillograph:
1. Connect the output of the sweep generator to the input of the amplifier to be tested, as shown in Figure 65. Set the sweep deviation to approximately six megacycles. Some video amplifiers are d-c coupled so that the sweep generator cannot be connected directly to the grid without upsetting the dc level.
If the sweep generator is not provided with an isolating capacitor, a series capacitor of approximately 0.01 mf must be used when the sweep generator is connected to a video amplifier in which d-c voltage is present at the grid.
2. Connect the probe detector (the same probe that was used for aligning the sound IF amplifiers) from the output of the stage to ground.
3. Adjust the attenuator of the sweep generator until sufficient signal input is obtained to give a pattern on the oscillograph screen.
4. Connect the marker oscillator in parallel with the sweep generator.
5. By varying the marker frequency, the birdie can be moved to any position on the pattern and the band width measured.
6. If the correct response curve is not obtained, tune the adjustable peaking coils until the amplifier is properly aligned.
If all the frequency compensating components in the video amplifier stage are fixed, but the response is poor, it is necessary to substitute a variable peaking coil which can be adjusted to provide the proper response.
9-47 Aligning the Video Amplifier with a Square Wave Generator and Oscillograph. A square wave generator offers a convenient method for checking the frequency response of a video amplifier. A square wave is formed by combining a sine wave with its odd harmonics as shown in Figure 66. Square waves contain harmonics as high as fifteen or twenty times the fundamental frequency. Thus, when a 200 khz square wave is applied to an amplifier circuit, it tests the frequency response from 200 khz to 4 Mhz (200 khz x 20). By noting the shape of the square wave output from the video amplifier on an oscillograph, one can check the high frequency response. Similarly, a low frequency square wave of about 30 cycles will indicate the video amplifier response between 30 cycles and 600 cycles. There is no need to check the response between 600 cycles and 200 khz, because most video amplifiers are substantially flat in this region.
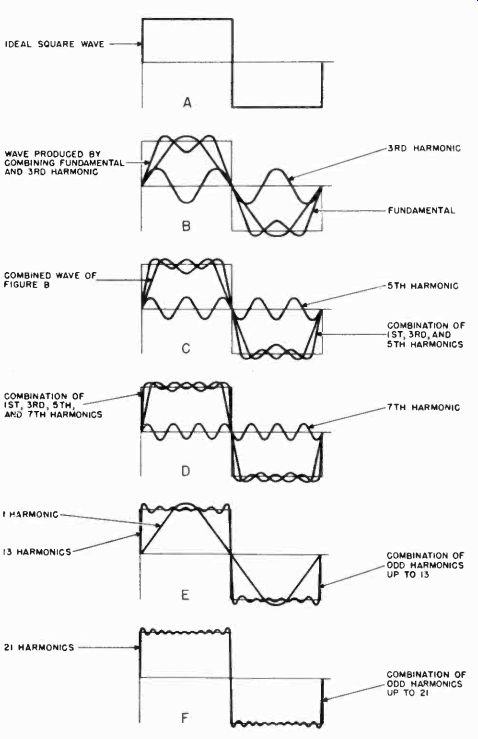
Figure 66. Creation of a square wave.
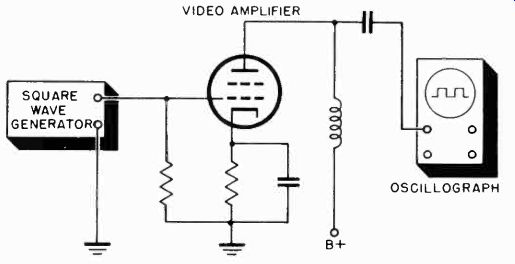
Figure 67. Connections used to adjust video amplifier using square wave generator
and oscillograph.
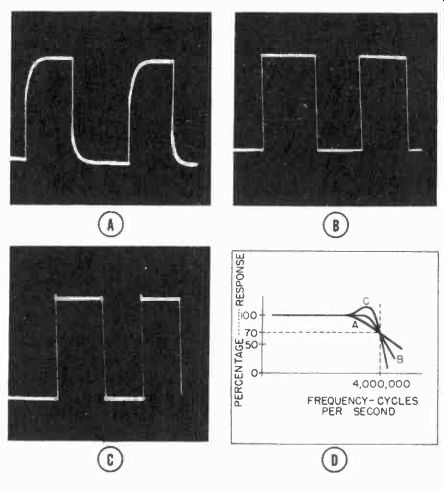
Figure 68. Patterns obtained on oscillograph when checking high frequency
response of video amplifier. A. Insufficient high-frequency compensation,
B. Good square wave response, C. Overshoot caused by over-peaking.
One precaution should be taken when using the oscillograph with a square wave generator. So that the oscillograph does not introduce distortion to the square waves, it must have good frequency response between 30 cycles and 4 megacycles. If the oscillograph amplifier does not have good response, the output signal from the video amplifier may be connected directly to the deflection plates of the oscillograph cathode-ray tube. Terminals for connecting the deflection plates are generally found on the front or rear of the oscillograph. To quickly check the response of the oscillograph amplifier, connect the square wave generator to the oscillograph amplifier terminals and set the square wave frequency to 30 cycles and then 200 khz. No perceptible distortion of the square waves should be noted if the amplifiers are flat from 30 cycles to 4 megacycles.
To check the high-frequency response, connect the square wave generator and oscillograph to the video amplifier as shown in Figure 67. Set the square wave frequency to 200 khz. With a little experience in interpreting the square wave patterns obtained on the oscillograph, the technician will be able to determine the approximate high-frequency response of the video amplifier. Typical patterns are shown in Figure 68. The rounded front edge of the square wave shown of A is typical of an amplifier without sufficient high-frequency compensation. The good square wave shown in B results from an amplifier that is correctly compensated to 4 Mhz. The slight amount of overshoot on the leading edge of the square wave shown at C is typical of an amplifier which is over-peaked. The corresponding frequency response curves for each square wave are shown on the graph in D.
The low frequency response is checked in the same manner, only the square wave frequency is reduced to 30 cycles. The oscillograms shown in Figure 69 are examples of good and poor low-frequency response of a video amplifier. Poor low-frequency response is recognized by the sloping of the top and bottom portions of the square wave.
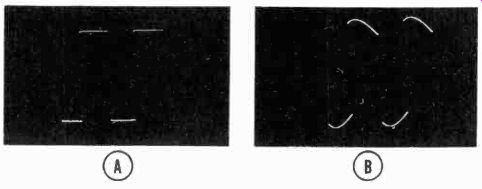
Figure 69. Square wave patterns obtained when checking low frequency response
of video amplifier. A. Good low-frequency response, B. Poor low-frequency
response.
9-48 Checking the D-C Restorer. After the video amplifier has been properly adjusted, the d-c restoration should be checked. This check should be made only if some radical change has
been made in the video circuits. Otherwise, the d-c restorer should not require changes when an alignment of the amplifier is made. The following is the procedure used:
1. Measure the residual d-c voltage on the grid of the picture tube without any signal.
2. Measure the d-c voltage at the same point with a 15- khz sine wave fed to the video amplifier from the signal generator (this simulates the horizontal sweep frequency upon which the d-c restoration depends). Be careful not to overload the amplifier.
3. Measure the peak-to-peak amplitude of the sine wave at the grid of the picture tube, using an oscillograph and voltage calibrator.
4. If the dc restorer is working properly, the change in dc voltage from the residual value to that when the sine wave is fed to the video amplifier should be 85 percent of the peak-to peak sine voltage at the grid.
For example, if the dc restoration is correct, a 15-khz, 2.5 volt peak-to-peak sine wave fed into the video amplifier, which
would result in a 50-volt amplified signal at the grid of the picture tube, would cause a change in the dc bias on the grid of about 42 volts.
A d-c voltage change as low as 65 percent is permissible, since this amount will maintain good dc restoration and picture contrast. If the restorer is not working properly, the constants of the circuit must be changed.
9-49 Aligning Wide-Band Video IF Amplifiers Stage-by Stage. A sweep generator, marker oscillator, and oscillograph are used to align over-coupled, wide-band, video IF amplifiers.
Either a stage-by-stage or overall alignment technique may be employed. The more complete stage-by-stage method is described first, with reference to the circuit shown in Figure 70.
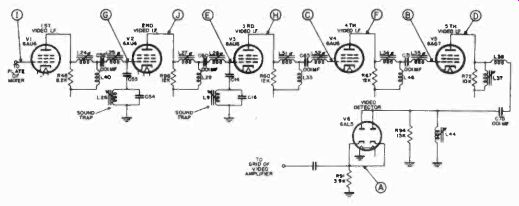
Figure 70. Simplified schematic of wide-band video IF amplifier, showing
points at which instruments are connected when alignment is performed.
This circuit should have a flat response from 22.4 to 25.65 megacycles. The 26.4-megacyle point on the response curve is down 6 db (50%); and the 22.4-Mhz point is down 1 db, as shown in Figure 71.
Since the overall response calls for the 26.4- Mhz point on the curve to be down 6 db, each individual IF stage should be aligned so that this point is down about 1 db. This will result in an overall IF response curve on which the 26.4- Mhz point is down a total of 6 db. In order to maintain this overall response, it is necessary to align each IF stage separately. To be sure that each stage is separately aligned without the influence of other sections of the circuit, it is recommended procedure to remove, from their sockets, the tubes preceding and following the stage being aligned.
The alignment procedure begins with the last video IF stage and proceeds, stage-by-stage, toward the first IF amplifier, as follows:
1. Connect the oscillograph between the cathode (point A in Figure 70) of V6 and ground. It is not necessary to use a probe detector at this point because the signal has already been detected by the video detector.
2. Connect the sweep generator between the grid of V5 (point B) and ground, in the 5th video IF amplifier stage.
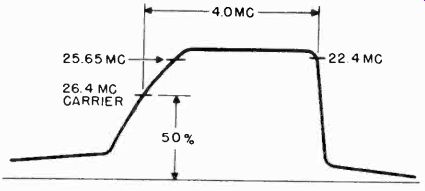
Figure 71. Ideal response curve for video IF amplifier.
3. Set the sweep generator to furnish a sweep signal between 21 and 28 Mhz.
4. Remove V4 from its socket.
5. The pattern obtained on the oscillograph should appear similar to that shown in Figure 72A. This pattern shows a dual response curve on the screen of the oscillograph.
6. Connect the high side of the marker oscillator to the point on the chassis where the sweep generator is grounded. Connect the ground side of the marker oscillator to another point on the chassis several inches from the point where the sweep generator is grounded.
7. Set the frequency of the marker oscillator to 26.4 Mhz.
This places a birdie on both the IF curves, as shown in Figure 72B. Since these response curves are too narrow to permit accurate work, it is necessary to expand the horizontal sweep of the oscillograph. This gives the single response curve shown in Figure 72C.
8. Adjust variable inductors L37 and L34 to obtain a response curve similar to that shown in Figure 72D. The adjustment should be made so that the point indicated by the birdie is down about 1 db (10%) below the flat top of the response curve.
9. Figure 72E shows the position of the birdie when the marker generator is set to 22.4 Mhz. It is not absolutely necessary to check this point now, because the 22.4-Mhz point is determined in the overall response by the sound traps.
10. The output of the sweep generator should be set to about 0.1 volts when aligning each stage. Be certain that the output is not too high or the video amplifier may be overloaded.
11. Replace V4 and remove V3.
12. Connect the sweep generator between the grid (point C) of V4 and ground.
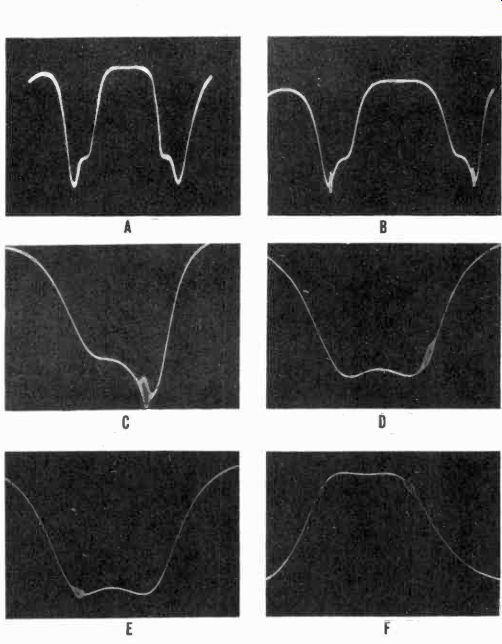
Figure 72. Response curves obtained when aligning video IF amplifiers. A.
Dual response curve, B. Birdie at 26.4 Mhz, C. Single response curve, D. Birdie
1 db down from flat top, E. Birdie at 22.4 Mhz, F. Birdie at 28.4 Mhz.
13. Connect the oscillograph between the plate (point D) of V5 and ground, through the probe detector.
14. Set the marker generator to 26.4 Mhz.
15. Tune inductors L34 and L35 to obtain the response curve shown in Figure 72F. Adjust this curve so that the 26.4 Mhz point is 1 db down.
16. Replace V3 and remove V2 and V5 from their sockets.
17. Connect the sweep generator between the grid (point E) of V3 and ground.
18. Connect the probe detector between the plate (point F) of V4 and ground.
19. Repeat the alignment procedure, tuning this time inductances L31 and L32. The frequency response curve obtained by tuning these inductances is shown in Figure 73A. It will be noted that a slight nick in the response curve appears at its low-frequency end. This nick is at 21.9 Mhz and is due to the sound trap in the grid circuit of V3. The sound trap should be adjusted at this time.
20. Change the setting of the marker oscillator to 21.9 Mhz to check the tuning of the sound trap.
21. If the sound trap is not properly aligned, vary inductance L9, until the birdie appears at the bottom of the nick in the response curve.
22. Replace tubes V2 and V5, and remove V1 and V4 from their sockets.
23. Connect the sweep generator between the grid (point G) of V2 and ground.
24. Connect the probe detector between the plate of V3 (point H) and ground.
25. Repeat the alignment procedure tuning inductances L27 and L28 to obtain the response curve shown in Figure 73B. The presence of the two sound traps, one in the grid circuit of the second IF stage, and the other in the grid circuit of the third IF stage, are additive and produce a very pronounced dip in the response curve. Adjust sound trap L26 in the grid circuit of V2 until the dip in the curve occurs at 21.9 Mhz. The birdie is barely visible in the region of 21.9 Mhz, because of the severe attenuation of the signal by the sound trap.
26. Replace V1 and V4 and remove V3.
27. Connect the sweep generator between the grid (point I) of V1 and ground.
28. Connect the probe detector between the plate (point J) of V2 and ground.
29. Repeat the alignment procedure, tuning inductances L24 and L25 to obtain the response curve shown in Figure 73C. 30. Return V3 to its socket.
After aligning all the video IF amplifier stages, an overall check of the response should be made. If the receiver chassis has a bottom plate, it should be in place when the response check is made. Otherwise, regeneration in the video IF amplifier stages may distort the output signal, as shown in Figure 73D. This regeneration is not evident when a stage-by-stage examination is made, because the signal is isolated to the stage being adjusted.
31. Connect the sweep generator to the grid (point I) of V1.
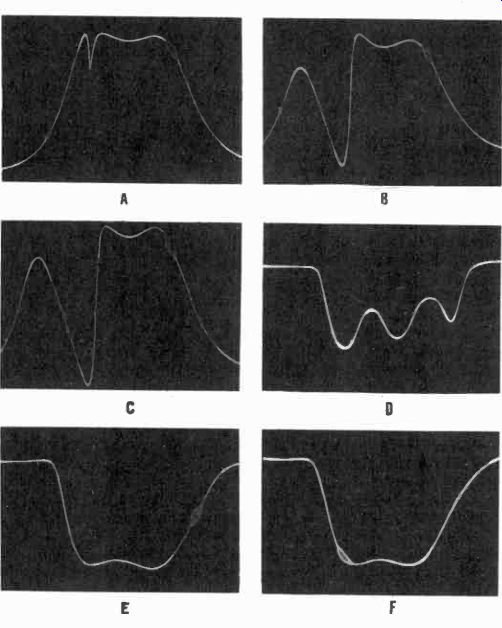
Figure 73. Response curves obtained when aligning video IF amplifiers.
32. Connect the oscillograph directly to the grid of the picture tube. (It is assumed that the video amplifier stages have been previously aligned.
33. Note the response curve as it appears on the screen of the oscillograph. Figure 73E shows a typical overall response curve. The 26.4 Mhz point is indicated by the birdie and is 6 db down on the right edge of the curve. Figure 73F shows the same response curve with the birdie set at 22.4 Mhz. These two response curves indicate that the overall alignment of the five stages is correct.
9-50 Overall Alignment of the Video IF Amplifiers. Stage by-stage alignment requires an oscillograph equipped with comparatively high gain deflection amplifiers. If such an instrument is not available, a low gain oscillograph may be used to align the video IF amplifier stages by connecting it to the output of the video detector. The following procedure is used:
1. Connect the oscillograph to the output of the video detector, point A, in Figure 70. The probe detector is not necessary since the signal has already been detected at this point.
2. Connect the sweep generator and marker oscillator to the grid of the last video IF stage (point B, Figure 70).
3. Following the procedure described in the paragraph on stage-by-stage alignment, adjust the last video coupling transformer.
4. Move the sweep generator and marker oscillator to the grid of the next video IF stage and repeat the procedure, adjusting the coupling between the last and next to last IF stages.
5. The sweep generator and marker oscillator should be moved to the grid of each IF stage in turn, until all stages have been aligned.
9-51 Checking The Sound Trap Attenuation. The effect of the two sound traps, one in the grid circuit of the second IF stage of V2, Figure 70, and the other in the grid circuit of the third video IF stage, V3, is additive. The overall attenuation to the sound signal should be approximately 40 db. Therefore, each trap is responsible for 20 db attenuation. 40 db down corresponds to an attenuation of the sound signal 100 times more than the video signal; that is, for every volt of sound signal which is passed by the amplifier, there are 100 volts of video signal.
20 db attenuation means that for every volt of sound signal passed, there are 10 volts of video signal.
To measure the total attenuation of the sound traps, the following procedure should be followed:
1. Connect a marker oscillator between the grid of V1 and ground.
2. Set the frequency of the signal generator to the sound IF frequency of 21.9 Mhz.
3. Modulate the 21.9 Mhz signal with a 400-cycle sine wave.
4. Connect the oscillograph between the grid of the picture tube and ground. With sufficient input signal and the gain control of the oscillograph set to a high level, a 400-cycle wave will appear on the screen of the oscillograph.
5. Set the amplitude of the 400-cycle wave to give a 2-inch deflection (20 scale divisions).
6. Adjust the wave traps to give minimum deflection of this 400-cycle wave.
7. Again adjust the gain control of the oscillograph to secure a two-inch deflection on the screen.
8. Change the frequency setting on the signal generator so that it falls at some other point in the passband of the video IF amplifier (for example, 25 Mhz). The pattern appearing on the oscillograph will be greatly increased and much overloaded.
9. Utilizing the calibrated attenuator in the output circuit of the signal generator, step down the input signal until the amplitude of the 400-cycle wave is again 2 inches.
10. Note the change in gain setting of the calibrated attenuator of the signal generator. This is the attenuation introduced in the input signal by the sound traps in the video IF channel.
If the total overall attenuation is less than 100:1, each trap must be checked in turn. If insufficient attenuation of the sound carrier exists, sound signals may enter the picture.
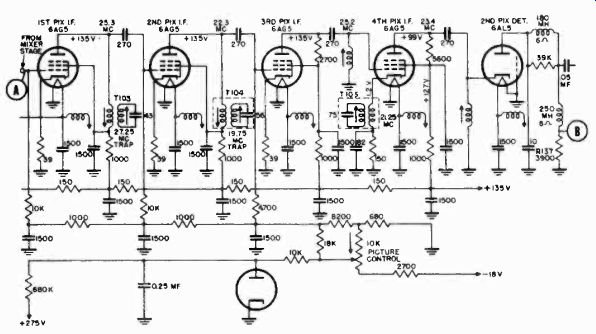
Figure 74. Schematic diagram of stagger-tuned video IF amplifier.
9-52 Aligning Stagger-Tuned Video I-F Amplifiers. Stagger tuned IF amplifiers are easier to align than over-coupled, wide band amplifiers. A signal generator and v.t.v.m. are used to peak each of the stagger-tuned stages to a particular frequency.
The v.t.v.m. is connected to the output of the second video detector and the signal generator to the grid of the first IF stage.
The alignment of a typical stagger-tuned, video IF amplifier is described with reference to the circuit shown in Figure 74.
1. Connect the signal generator to the grid (point A) of the first IF amplifier.
2. Connect the v.t.v.m. across the video detector load resistor R137 (point B).
3. Set the signal generator to each of the following frequencies and peak the specified adjustment for maximum indication on the v.t.v.m.
21.25 Mhz
27.25 Mhz
19.75 Mhz
T105
T103 (secondary)
T104 (secondary)
It may be desirable at times to observe the individual IF stage response. This can be accomplished in the following way:
1. Connect a sweep generator to the grid of the first IF amplifier.
2. Shunt all IF transformers and coils with a 330-ohm carbon resistor, except the one whose response is to be observed.
3. Connect the oscillograph across the video detector load resistor and observe the response curve. The response obtained will be essentially that of the un-shunted stage. The effects of the various traps on the response of the stage are also visible.
4. Figure 75 shows the response characteristics of each stage obtained in the above manner. Relative stage gain is not shown.
9-53 Aligning R-F Tuners. After the IF system of the receiver has been adjusted for satisfactory bandwidth and selectivity, the RF stages can be aligned. A sweep generator is of value here, but not as essential as in IF amplifier alignment. The bandpass characteristics may be determined simply by applying three test frequencies (with 400-cycle modulation) to the antenna input, (1) at the picture carrier, (2) at the upper edge of the channel, and (3) at the lower edge of the channel. If substantially equal response is obtained on a v.t.v.m. or oscillograph connected across the second video detector, the amplifier is correctly aligned. It is not necessary to observe the shape of the RF response curve, because the IF response curve will provide sufficient selectivity if the three test frequencies show that the RF amplifier is substantially flat.
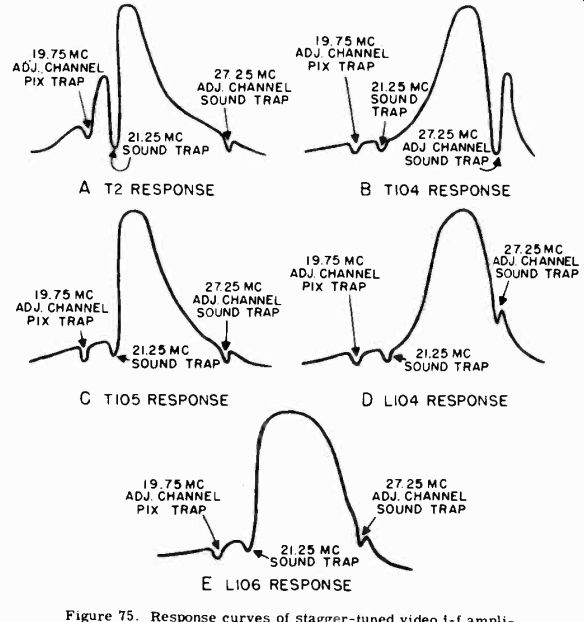
Figure 75. Response curves of stagger-tuned video IF amplifiers.
If a sweep generator is used, it must have a frequency deviation sufficient to cover each RF channel and one megacycle above and below it. Connections for RF alignment with a sweep generator and oscillograph are shown in Figure 76. The procedure is the same as described for aligning a single over coupled IF amplifier stage. The only difference is that the center frequency of the sweep generator is now set at the RF frequency corresponding to the midpoint of the channel under test. For example, if the RF amplifier is tuned to Channel two (54 to 60 Mhz), the sweep generator center frequency is set at 57 Mhz.

Figure 76. Connections used when aligning RF section.
OSCILLOGRAPH
The type of RF circuits used in receivers will vary, and the reader is referred to the manufacturer's service manual for information on the adjustable elements of these stages.
The continuous tuning "Inputuner" described in Section 7 calls for an entirely different approach to the alignment problem.
The Inputuner must be first aligned by feeding a 71.25 Mhz signal to it, setting the dial to channel 4 and adjusting the oscillator trimmer capacitor to obtain maximum output at the sound
IF frequency. A 215.75 Mhz signal is then fed to the antenna input and the oscillator coil pulled or squeezed. After the tuner has been aligned a sweep generator and marker oscillator are used to adjust the bandwidth.
9-54 Final Sound Trap Adjustment. The tuning of a television receiver is determined by the exact setting of the discriminator.
When the discriminator is aligned properly, a television channel may be best received by adjusting the tuner for maximum sound. The best picture will be obtained under these conditions.
To obtain a clear picture free from interference, it is also equally important that the sound channel fall precisely on a frequency to which the sound traps are adjusted. In order to assure that the sound traps and the discriminator transformers are in exact agreement, a final adjustment must be made after the rest of the receiver has been completely aligned.
1. Connect the signal generator to the antenna terminals of the receiver.
2. Connect the oscillograph between the grid of the picture tube and ground.
3. Adjust the receiver to a free channel (one on which no station is transmitting) in the lower television band.
4. Set the signal generator to the sound carrier frequency for the particular channel.
5. Adjust the tuner until a null is obtained on a v.t.v.m. connected across the discriminator output.
6. Reduce the contrast level until no overload is obtained in the video IF when the signal generator is modulated 30% with 400 cycles.
7. Adjust the sound trap coils until a minimum of 400 cycle output is obtained on the oscillograph.
9-55 Sensitivity Check. A comparative sensitivity check can be made by operating the receiver on a weak signal from a television station and comparing the picture and sound obtained to that on other receivers of the same make under the same conditions. This weak signal can be simulated by connecting the shop antenna to the receiver through an attenuator pad of the type described in Section 8. A sufficient number of stages should be inserted in the pad so that somewhat less than normal picture contrast is obtained when the contrast control is set for maximum gain. Only carbon type resistors should be used to construct the attenuator pad.
To obtain an absolute measure of the receiver sensitivity, use the following procedure:
1. Connect the signal generator to the antenna terminals of the receiver.
2. Connect the oscillograph between the grid of the picture tube and ground.
3. Calibrate the oscillograph so as to be able to read 25 volts peak-to-peak (this value is used as an approximate standard and is about the average peak-to-peak voltage required in most receivers for normal contrast and brightness levels).
4. Tune the receiver to a free television channel in the lower television bands.
5. Adjust the calibrated signal generator to the center of the television channel.
6. Amplitude modulate the signal generator 30% with a 40ß cycle sine wave signal.
7. Set the receiver contrast control to maximum and adjust the output of the signal generator until 25 volts peak-to-peak of the 400-cycle signal is obtained on the oscillograph.
The input signal (read on the signal generator output attenuator) required to obtain this level is the voltage sensitivity of the receiver.
9-56 Troubleshooting Charts. On the following pages the reader will find a series of charts which summarize common television receiver faults. These charts are useful when attempting to diagnose a defective receiver.
-------------