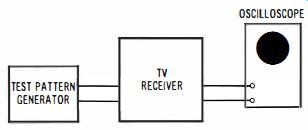
Fig. 3-1. Test setup for basic video signal distortion check. OSCILLOSCOPE; TV RECEIVER ; TEST PATTERN GENERATOR
| Home | Audio mag. | Stereo Review mag. | High Fidelity mag. | AE/AA mag. |
3-1. To Check the Video Signal for Distortion
Equipment: Test-pattern generator.
Connections Required: Connect output cable from generator to antenna-input terminals of tv receiver under test; connect output from video amplifier (or picture detector) to scope, as shown in Fig. 3-1 .
Fig. 3-1. Test setup for basic video signal distortion check. OSCILLOSCOPE;
TV RECEIVER ; TEST PATTERN GENERATOR
Procedure: Display the video signal at field rate and at frame rate, as shown in Figs. 3-2 and 3-3.
Evaluation of Results: A standard test pattern contains peak whites; in turn, the horizontal sync tip should occupy 25 percent of the peak-to-peak signal excursion. If the sync tip occupies more than 25 percent of the signal amplitude, white compression and/or clipping is occurring. If the sync tip occupies less than 25 percent of the signal amplitude, sync ...
SYNC NORMAL; VERTICAL-SYNC INTERVAL IS LEVEL WITH THE HORIZONTAL SYNC INTERVAL; SYNC PUNCHING; VERTICAL-SYNC INTERVAL IS BELOW HORIZONTAL SYNC LEVEL; OPPOSITE DISTORTION FROM SYNC PUNCHing ; VERTICAL-SYNC INTERVAL IS ABOVE HORIZONTAL SYNC LEVEL
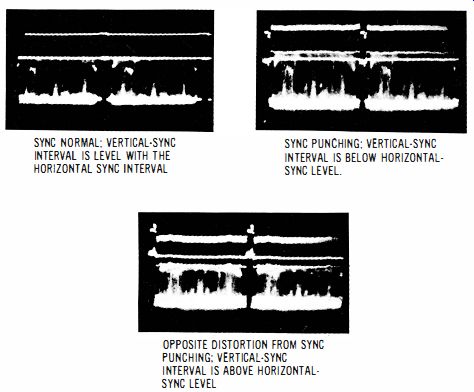
Fig. 3-2. Video signal at field rate.
... compression and/or clipping is occurring. In a case where the vertical sync interval has less amplitude than the horizontal sync interval , sync punching is occurring. On the other hand, if the vertical sync interval has greater amplitude than the horizontal sync interval, horizontal sync attenuation is occurring. Incorrect percentage of horizontal sync tip with respect to the signal amplitude results from overload (often, incorrect bias voltage). Sync punching or its opposite distortion is caused by high-frequency attenuation or by low-frequency attenuation, respectively. Note that when the signal at the picture-detector output is normal, but is distorted at the video-amplifier output, the trouble will be found in the video amplifier.
3-2. To Check the Overall Signal Gain of a TV Receiver
Equipment: Calibrated am generator.
Connections Required: Connect output cable from generator to antenna-input terminals of tv receiver; connect output from video amplifier to oscilloscope, as shown in Fig. 3-4.
SYNC TIPS occupy MORE THAN 25 PERCENT OF THE SIGNAL AMPLITUDE; WH ITES AND LIGHT GRAYS ARE COMPRESSED (SYNC PUNCHING IS ALSO PRESENT) CLIPPED SYNC HORIZONTAL SYNC TIP IS PRACTICALLY ABSENT; EXAMPLE OF CLIPPED SYNC
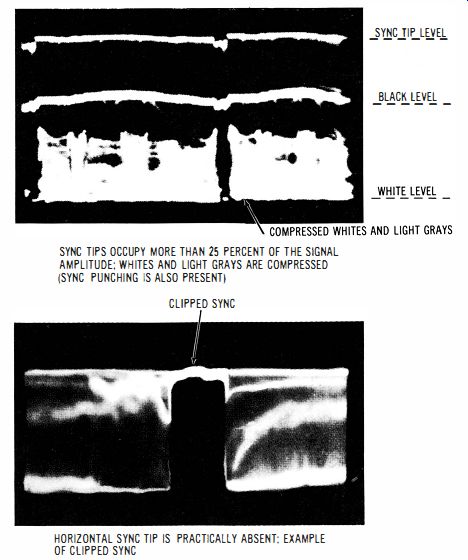
Fig. 3-3. Video signal at field rate (above) and at frame rate (below).
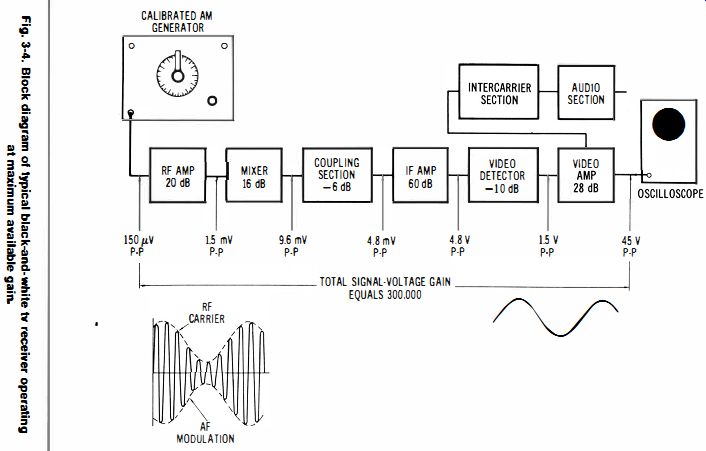
Fig. 3-4.
Procedure: Tune generator to picture-carrier frequency of chosen channel, with 150 microvolts output and 90 percent modulation. Display the demodulated signal envelope on the scope screen (envelope frequency is usually 1 kHz).
Evaluation of Results: A typical black-and-white tv receiver operating at maximum available gain normally develops a 45-V p-p output in response to a signal input of 150 microvolts.
Note that the output waveform should not have visible noise ("fuzz"). However, at lower in put signal levels, noise will become evident on the output waveform. Excessive noise is often caused by collector junction leakage in a transistor.
3-3. To Measure the Sensitivity of a TV Receiver
Equipment: Calibrated signal generator.
Connections Required: Same as in Fig. 3-4 except that the oscilloscope is connected at the output of the picture detector.
Procedure: Observe the peak-to-peak voltage of the noise output from the picture detector when the generator signal is zero. Then, advance the output from the generator until the combined noise voltage and signal voltage is twice as great as previously noted for the noise voltage.
Evaluation of Results: From a practical standpoint, the useful sensitivity of a tv receiver is given by the number of microvolts signal input that is required to produce a picture detector output (signal plus noise) which is double the value of the noise output in the absence of signal.
NOTE 3-1 The Four Fundamental Waveforms
The four fundamental waveforms are depicted in Fig. 3-5. The sine-wave, square wave, and exponential wave are basically different from the noise waveform because they have a repetitive cyclic form, whereas a noise wave has a nonrepetitive random form. Sine, square, and exponential waveforms can be represented by simple algebraic equations, whereas a noise waveform must be described in terms of statistical functions. Although the peak-to-peak voltage of a sine wave, for example, can be precisely measured, the peak-to-peak voltage of a noise waveform can only be approximated because of its random characteristics.
3-4. To Signal-Trace the IF Section of a TV Receiver
Equipment: Demodulator probe; pattern generator will be helpful.
Connections Required: Connect output from pattern generator (or a tv antenna) to the receiver; connect demodulator probe to vertical-input terminals of oscilloscope.
Procedure: Set receiver controls for normal operation. Apply demodulator probe in turn at the collector of the first if stage, at collector of second if stage, and so on. Use high vertical gain and substantial generator output when checking the first if stage.
Evaluation of Results: When a demodulator probe such as depicted in Fig. 3-6 is used, and the scope is operated at a 30 Hz deflection rate, a "stripped" vertical-sync pulse will be:
(A) Sine wave is basic steady-state waveform.
(B) Square wave is basic transient state wave.
(C) Exponential wave is basic growth/decay wave.
(D) Noise wave is basic random wave.
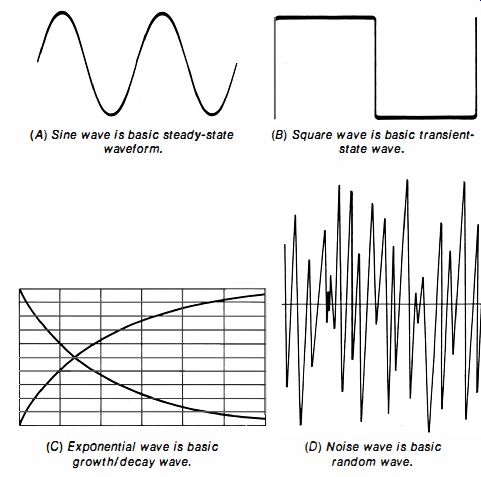
Fig. 3-5. Four fundamental waveforms.
displayed on the scope screen, if the signal is present. Only a small residue of camera signal and horizontal sync pulses will be reproduced when this type of demodulator probe is used, because of its limited demodulating capability (Fig. 3-7). The chief advantage of this probe design is its comparatively high impedance. However, the probe has a marked loading and detuning action, and its application is limited to determining whether if signal is present or absent. Therefore, other methods must be used to measure stage gain.
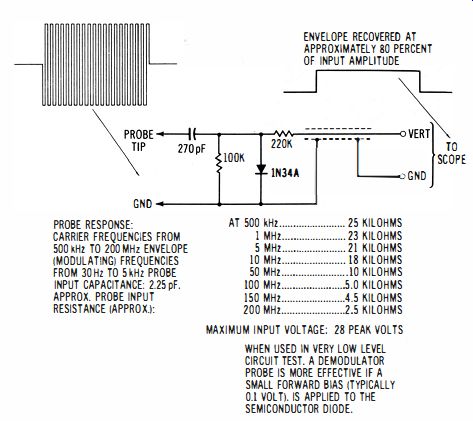
Fig. 3-6. Standard demodulator probe configuration and characteristics.
NOTE 3-2 Simplest Type of Demodulator Probe
The simplest demodulator probe consists of a single diode, as shown in Fig. 3-8. However, it is not entirely practical because its demodulating capability is poor (the probe distorts a 50-Hz square-wave envelope substantially). Moreover, its application is limited to frequencies below 10 MHz, due to its development of standing waves on the oscilloscope input cable. Standing waves result in serious attenuation of the signal at various frequencies for which the cable is parallel-resonant.
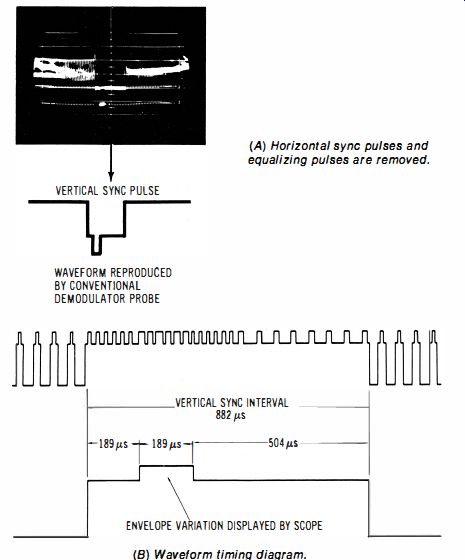
Fig. 3-7. Only the lower frequencies are reproduced by a conventional demodulator
probe.
-------------
VERTICAL SYNC PULSE WAVEFORM REPRODUCED BY CONVENTIONAL OEMODULATOR PROBE
(A) Horizontal sync pulses and equalizing pulses are removed.
VERTICAL SYNC INTERVAL=1 882 us
ENVELOPE VARIATION DISPLAYED BY SCOPE
(B) Waveform timing diagram.
-----------
3-5. To Monitor the IF Section of an Intermittent Receiver
Equipment: Demodulator probe{s) and/or lo-C probe.
Connections Required: With reference to the diagram in Fig. 3 9, connect a lo-C probe and a demodulator probe to the input terminals of a dual-trace oscilloscope. Connect the demodulator probe at the input of the third if stage, and connect the lo-C probe at the output of the picture detector. If two dual trace scopes are available, connect demodulator probes to the input terminals of the second oscilloscope. Connect one of the demodulator probes to the input of the second if stage, and connect the other demodulator probe at the input to the picture detector.
Procedure: Tune in a station signal (or use a pattern generator), and adjust the receiver controls for normal operation. Adjust the oscilloscope(s) to display the signals at the monitored points. If the intermittent does not occur within a reasonable time, it can often be speeded up by tapping circuit boards, devices, and components, by flexing leads, by heating and cooling suspected parts, or by varying the line voltage. Sometimes the intermittent will occur if the receiver is switched on and off several times in succession.
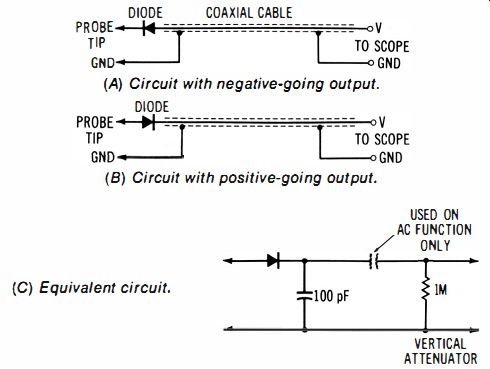
Fig. 3-8. Simplest demodulator probe design (series detection).
Evaluation of Results: When the signal is suddenly blocked , or attenuated, this fact becomes evident on one or both channels of the oscilloscope. It is helpful to use two dual-trace scopes, because more signal points can be monitored simultaneously, thereby helping to pinpoint the intermittent. Monitoring is the most practical approach to tracing intermittents, because transfer of a probe from point to point, as in ordinary signal tracing procedures, causes transients which frequently trigger the intermittent, thereby defeating the analytical process.
----------
(A) Circuit with negative-going output.
(B) Circuit with positive-going output.
(C) Equivalent circuit.
-------------
NOTE 3-3
Medium Impedance Demodulator Probe
A medium-impedance demodulator probe, such as depicted in Fig. 3 10, is preferred by some technicians because it provides a reasonably good display of the horizontal sync pulse, as well as the vertical sync pulse. The chief disadvantage of the medium-impedance probe is the increased circuit loading that it imposes. When several probes are simultaneously applied in the signal channel, loading may be a serious "side effect" unless an appropriate technique is used. Capacitive coupling is helpful in reduction of loading; instead of applying a demodulator probe directly at a test point, one or more layers of masking tape can be inserted. Although the signal level is attenuated, sufficient pickup is obtained for practical testing at the higher-level points.
(A) A dual-trace scope monitoring the output of the second if stage and output of picture detector_ SEE NOTE SEE NOTE
DEMODULATOR -- II PROBE
DUAL-TRACE OSCILLOSCOPE LOW-C PROBE
DUAL-TRACE OSCILLOSCOPE
(B) Two dual-trace scopes monitoring four signal points in the if section_
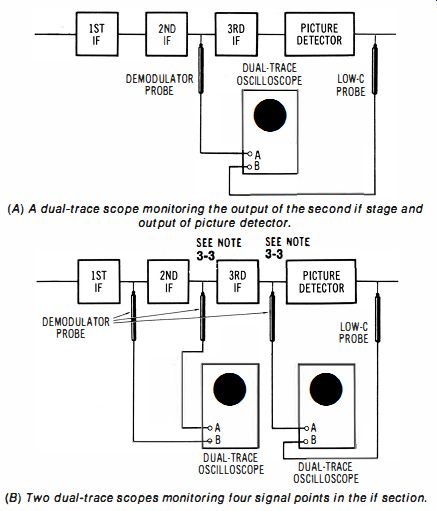
Fig. 3-9. Dual-trace scopes can monitor two or more signal points simultaneously.
3-6. To Measure the Gain of a TV IF Stage
Equipment: An am signal generator, agc override dc source.
Connections Required: Connect scope to the picture-detector output via a lo-C probe, as shown in Fig. 3-11. Connect a bias box between the agc line and ground. Apply output from the generator at the output, and then at the input of the stage under test.
--------
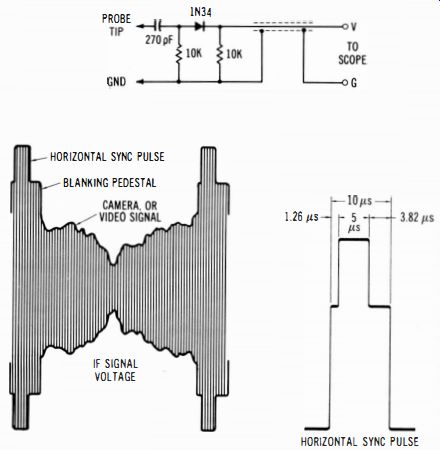
Fig. 3-10. A medium-impedance demodulator probe that can reproduce horizontal
sync pulses.
---------
Procedure: If the generator does not have a series output capacitor, insert a capacitor as shown to avoid drain-off of bias voltage. Set generator to center frequency of if channel, and use amplitude-modulated output; 30 percent modulation is adequate. Adjust override bias to normal age value, as specified in the receiver service data. As the generator signal is transferred from the output to the input of a stage, observe the change in pattern height on the scope screen. Do not overload a stage-back off on the generator output level, as required. Overload is evidenced as compression or clipping (flat-topping) of the displayed sine wave.
Evaluation of Results: The voltage gain of the stage is given by the ratio of pattern heights when the generator injection point is changed from the output to the input of the stage. The gain of an age-controlled stage is not fixed, but will change in accordance with the value of override bias that is used. Note that unless the bias is clamped by a dc source, the agc level will change as the signal-injection point is transferred, and the result will be in appreciable error.
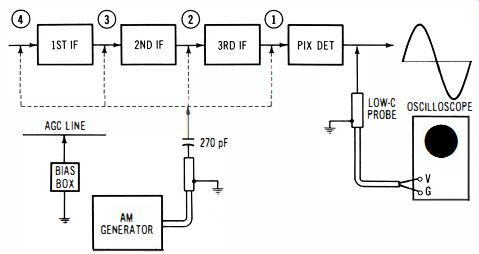
Fig. 3-11. Gain of third H stage is measured by transferring signal-injection
point from (1) to (2).
NOTE 3-f
Series and Shunt Detector
Configuration
Both series and shunt detector configurations are used in probes and in signal detectors (Fig. 3-12). An occasional demodulator arrangement (Relatively low output impedance)
(A) Series detector.
(Relatively high output impedance)
(B) Shunt detector.
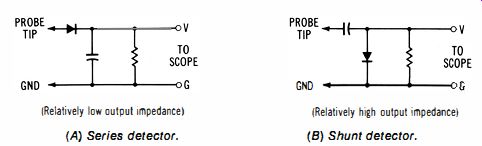
Fig. 3-12. Basic detector arrangements.
... uses combination series/shunt detection. The chief distinction between series and shunt detection is that the latter has comparatively high output impedance. Maximum signal power is transferred when the source impedance matches the load impedance.
3-7. To Check the Overall RF/IF Response Curve in a TV Receiver
Equipment: Sweep-and-marker generator, resistive "isolating". probe, agc clamp voltage.
Connections Required: Connect output from generator to antenna-input terminals of receiver; connect bias box between agc line and ground; connect scope to picture-detector load resistor via resistive "isolating" probe, as shown in Fig. 3-13.
(A) Test connections for check of overall rt/if response curve.
SOUND
(B) Standard response, showing valley tolerance.
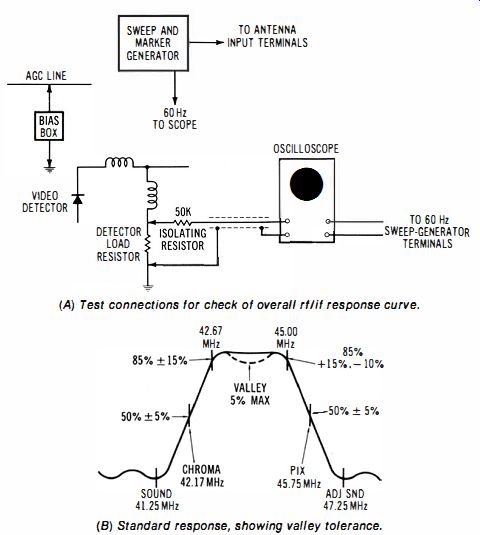
Fig. 3-13. Application of resistive "isolating" probe in sweep alignment.
Procedure: Set generator for sweep-if and marker output; observe any procedural notes provided in the receiver service data; operate scope on 60-Hz sine-wave horizontal-deflection voltage from sweep generator; adjust output level from generator to avoid overload and resulting artificial flat-topping of displayed response curve.
Evaluation of Results:
Check displayed response curve against specified curve in receiver service data. A standard overall response curve is depicted in the accompanying diagram; the bandwidth is 3.58 MHz. Black-and-white receivers may utilize somewhat less bandwidth.
NOTE 3-5
Injection of IF Sweep-and-Marker Signal
In normal operation of a receiver, the rf/if frequency response curve will have practically the same shape as the if response curve, since most of the gain and selectivity is developed by the if amplifier. To check the if response, the same test setup is used as above, except that the if sweep-and-marker signal is injected at the base of the mixer transistor, as shown in Fig. 3-14. Check the receiver service data for any special instructions; for example, directions may be given for disabling the local oscillator, for use of an emitter-injection point, or for a two-part procedure to check the if response.
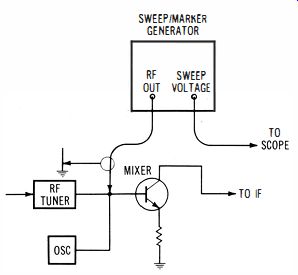
Fig. 3-14. Standard signal-injection point for checking the if frequency response.
3-8. To Check the RF Response Curve in a TV Receiver
Equipment: Same as in Fig. 3-1.
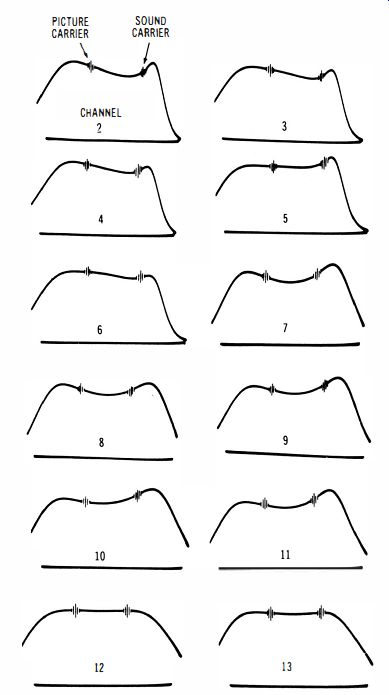
Fig. 3-15. The rf response curves showing normal tolerances on the 12 vhf
channels for a good-quality receiver.
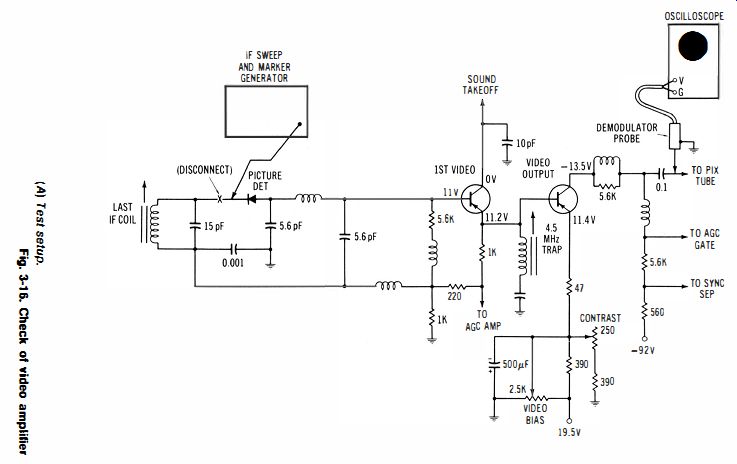
Fig. 3-16.
(a)
(B) Typical video amplifier response curve. [frequency response. ]
Connections Required: Same as in Fig. 3-1, except that the scope takeoff point is made at the mixer transistor (a "looker" point in the mixer base return circuit may be specified in the receiver service data). Procedure: Set generator for vhf sweep-and-marker output; observe any procedural notes that may be provided in the receiver service data; operate scope on 60-Hz sine-wave horizontal-deflection voltage from sweep generator.
Evaluation of Results: As exemplified in Fig. 3-15, the frequency response of each channel should be checked. Although successive channels will not have identical response curves, a reasonable tolerance includes both the picture carrier and the sound carrier on top of the curve, absence of substantial sag, and absence of sharp and high peaks. When the response curve cannot be contoured satisfactorily by adjustment of the alignment trimmers and slugs, it is indicated that troubleshooting is required. Most shops prefer to send defective tuners to specialized repair depots.
3-9. To Check the Video-Amplifier Frequency Response
Equipment: Sweep-and-marker generator, demodulator probe.
Connections Required: Disconnect picture-detector diode from the last if coil, and apply sweep-and-marker signal through the picture-detector diode to the input of the video amplifier, as shown in Fig. 3-16. Connect scope via demodulator probe to output of video amplifier.
Procedure: Use if output from the sweep generator, and adjust the marker frequency to obtain a video-frequency response curve with zero frequency at the left-hand end of the base line, as exemplified below. The 4.S-MHz trap dip will normally be displayed toward the right-hand end of the base line. Usually, maximum output is required from the generator, and the scope is operated at fairly high gain.
Evaluation of Results: Although this basic method of testing does not provide markers on the video-amplifier frequency response curve, the 4.5-MHz trap dip serves as a guide and permits the technician to determine whether the bandwidth is seriously subnormal, and if there are abnormal peaks or suck-outs in the response curve. If an absorption-marker box is connected in series with the "hot" lead of the demodulator probe, "dip" markers will be displayed at specified frequencies along the response curve.
Alternate Method: If an elaborate sweep-and-marker generator is used which provides a video-frequency sweep output, the test signal is then applied directly at the input of the video amplifier (not through the picture-detector diode). This type of sweep generator usually has built-in absorption-marker facilities.
NOTE 3-6 Formation of Video-Frequency Test Signal
When an if sweep-and-marker signal is used to check the video-amplifier frequency response, the if test signal is passed through the picture detector diode in order to heterodyne the two frequencies and thereby develop a zero- to 5-MHz sweep signal. In other words, the video-frequency test signal is the difference frequency between the if sweep and marker signals. Note that absorption markers are generally preferred for marking a video-frequency response curve in order to avoid inter-harmonic beats with resulting spurious markers.
3-10. To Check the Overall Picture-Channel Response With a VITS Signal
Equipment: None.
Connections Required: Connect oscilloscope at output of video amplifier (or at output of picture detector) via lo-C probe.
Procedure: Tune in a color-tv station signal, and adjust receiver controls for normal reception. Adjust triggered-sweep scope controls to display the multiburst VITS signal. Then, adjust scope to display the next horizontal line with the sine-squared pulse.
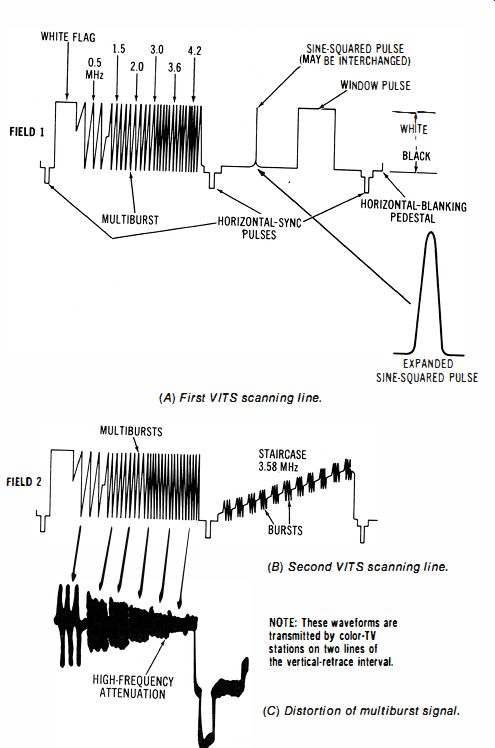
Fig. 3-17. Vertical-interval test signal (VITS). (A) First VITS scanning line.
(B) Second VITS scanning line.
NOTE: These waveforms are transmitted by color· TV stations on two lines of the vertical retrace interval.
(e) Distortion of multiburst signal.
Evaluation of Results: As shown in Fig. 3-17, the VITS multi burst signal is transmitted with uniform amplitude from 0.5 MHz to 4.2 MHz. After passage through the receiver circuits, the bursts will become attenuated in accordance with the overall frequency response of the picture channel. In turn, a helpful quick-check is provided; if the probe is transferred to the picture-detector output, a comparative evaluation of video amplifier frequency response is provided. Next, as shown in Fig. 3-1 8, the sine-squared (T pulse) waveform is transmitted without undershoot. After passage through the receiver circuits, the pulse will normally undershoot with one leading lobe and one trailing lobe. Additional lobes indicate abnormal frequency response. Unsymmetrical leading and trailing undershoots indicate nonlinear phase response.
(A) Transmitted waveform with half
amplitude duration (HAD.) of 0. 125 u-s.
(B) Normal reproduction of T pulse by receiver circuits.
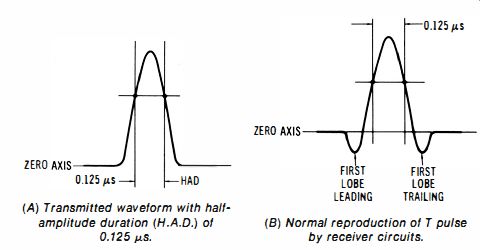
Fig. 3-18. T pulse waveforms.
NOTE 3-7
Sine-Squared Pulse and Picture Element
The sine-squared pulse with a half-amplitude duration of 0.125 us (T pulse) is very informative in tv test procedures because the pulse is practically the same as one picture element. In other words, picture elements will be distorted by the receiver circuits to the same extent that a T pulse is distorted. Note also that the scope used in this test should have better T-pulse response than a normally operating tv receiver.
3-11. To Make a Square-Wave Check of the Video Amplifier
Equipment: Square-wave generator.
Connections Required: As shown in Fig. 3-19, connect the output from a square-wave generator to the input of the video amplifier (disconnect video-detector diode from input of video amplifier). Connect scope via lo-C probe at the output of the video amplifier.
(A) Test setup.
(B) Norma/ 100-kHz square-wave response.
LOW·C PROBE
PICTURE TUBE
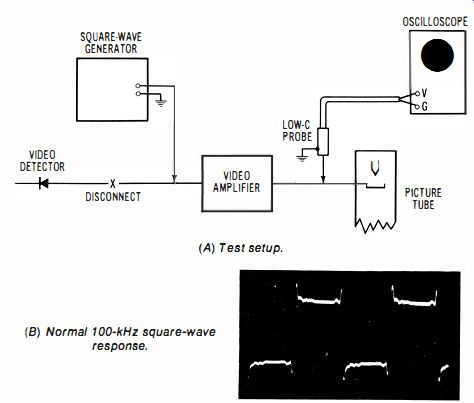
Fig. 3-19. Checking square-wave response of a high-performance video amplifier.
Procedure: Adjust square-wave generator fo r an output of approximately 1 V POp, at a repetition rate of 100 kHz. Set contrast control of receiver to its normal operating position.
Evaluation of Results: A reasonably undistorted 100-kHz square wave will be reproduced by a normally operating good-quality receiver. As exemplified in Fig. 3-19B, video amplifiers are often designed to provide a small amount of overshoot. This is done to minimize the rise time of the waveform, and also to provide accented edge transition ("crispening") of the image. Subnormal rise time and excessively rounded corners in the reproduced square wave indicate inadequate frequency response, often due to capacitor defects.
NOTE 3-8 Rise Time Versus Cutoff Frequency
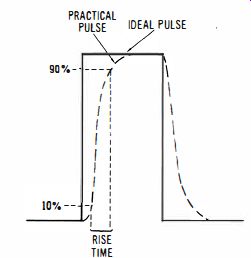
Fig. 3-20. Measuring rise time.
Rise time is measured from the 10 percent point on the leading edge to the 90 percent point, as shown in Fig. 3-20. A triggered-sweep oscilloscope must be used, and the vertical amplifier of the scope must have greater bandwidth than the video amplifier under test. Note that the rise time of the reproduced square wave is related to the frequency response of the video amplifier as follows: where, f.o is the amplifier's cutoff frequency, T, is the amplifier's rise time.
For example, if a video amplifier has a 4-MHz cutoff frequency, its square-wave rise time will be 0.08 microsecond.
3-12. To Signal-Trace a Sync-Buzz Pulse
Equipment: None, although a pattern generator may be helpful.
Connections Required: None.
Procedure: With a lo-C probe, start signal tracing at the primary of the ratio-detector transformer, and proceed back through the intercarrier-if amplifier and the video amplifier. As shown in Fig. 3-21, a buzz pulse often appears as downward modulation of the 4.S-MHz intercarrier signal by a stripped vertical sync pulse. Operate the scope on 30-Hz sweep.
Evaluation of Results: The source of a sync-buzz pulse is often in an overloaded video-amplifier stage. In such a case, the scope will display a pulse at the malfunctioning stage, but not at any preceding stage. In marginal situations, the buzz pulse will be most prominent when a white-background signal is present without any camera signal. Overload commonly results from incorrect bias voltage, or collector leakage in a transistor.
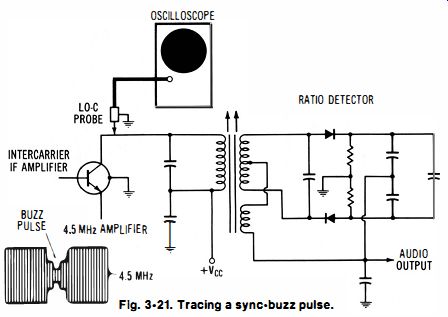
Fig. 3-21. Tracing a sync-buzz pulse.
NOTE 3-9
Sync Buzz Versus Sweep Buzz
Although less common, sync buzz can also arise in an if amplifier stage. Misalignment, in which the sound carrier rides too high on the frequency response curve, is the most probable cause. The intensity of the sync buzz is increased when nonlinear amplification (overload) occurs. Sync buzz should not be confused with sweep buzz. If the vertical sweep pulse gains entry into the sound channel, 60-Hz sweep buzz will occur. Sweep buzz sounds similar to sync buzz. However, when the vertical-hold control is turned to roll the picture, sweep buzz will change in tone, whereas sync buzz will not change its tone.
Note also that an intercarrier-if amplifier can be signal traced by using a service-type am generator as a signal source. Although the fm detector and limiter reject amplitude modulation, a service-type am generator produces incidental frequency modulation, as depicted in Fig. 3-22. Incidental fm is generally greater at high percentages of amplitude modulation.
3-13. To Check Sync Separator Action
Equipment: None (unless a pattern generator is preferred as a signal source).
Connections Required:
Connect oscilloscope via lo-C probe to output of differentiating circuit, and then to output of integrating circuit, as exemplified in Fig. 3-23. Connect output from pattern generator (if used) to antenna-input terminals of receiver.
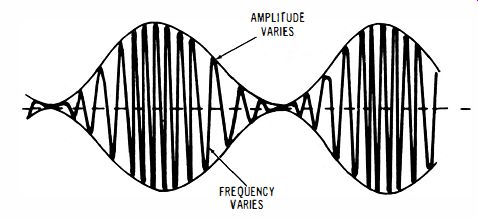
Fig. 3-22. A 1 DO-percent amplitude-modulated output signal from an am generator,
with incidental frequency modulation.
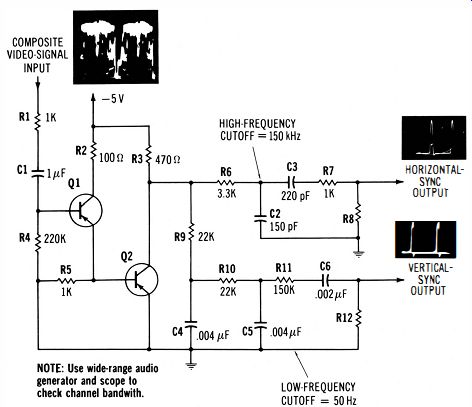
Fig. 3-23. A widely used sync-separator arrangement
Procedure: Adjust receiver controls for normal operation.
Evaluation of Results: The output waveform from the differentiating circuit should be similar to that specified in the receiver service data, and should have an amplitude within ±20 percent of the specified value. In particular, the differentiator output should be practically free from residual camera signal.
The output waveform from the integrator should have a shape similar to that specified in the service data, and an amplitude within ±20 percent of the specified value. (Some receivers have a ±10 percent amplitude specification.)
NOTE 3-10 Bandwidth of Horizontal Sync Channel
A horizontal sync channel should have a bandwidth of 135 kHz, from 15 kHz to 150 kHz. This bandwidth provides maximum reduction of noise, without undue sync-pulse attenuation. Bandwidth is controlled by RC values in the sync channel. A vertical sync channel normally has a lower frequency-response limit of 50 Hz to ensure rejection of possible low frequency interference. Sync-pulse tolerances of ±10 percent and of ±20 percent are indicated in Fig. 3-24. Observe that the sync-separator circuit has a clipping and limiting action which tends to keep the output pulse amplitude constant as the input signal amplitude varies.
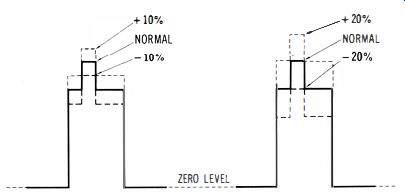
Fig. 3-24. Sync pulse amplitude tolerances.
3-14. To Check an AFC Section (Ringing Circuit Type)
Equipment: None.
Connections Required: Apply scope via lo-C probe at base of horizontal-oscillator transistor.
Procedure: Adjust receiver controls for normal operation.
Evaluation of Results: With reference to Fig. 3-25, observe the leading edge of the base waveform. In normal operation, the rise is rapid into the conduction region of the transistor (near the peak of the waveform). A slow approach to the conduction region results in poor noise immunity. Adjust the horizontal stabilizer coil to obtain the maximum rate of change as the leading edge approaches the peak of the base waveform.
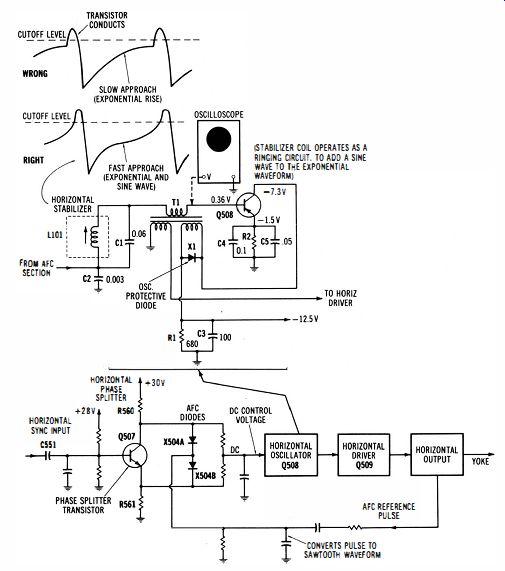
Fig. 3-25. The afc section is a portion of the servo (feedback control system).
NOTE 3-11 Faulty Sync Locking Action
The dc control voltage for a ringing-circuit afc arrangement is derived from a pair of afc diodes, as exemplified in the diagram. These diodes operate in a balanced-bridge configuration, which is part of the afc servo-system. Unless the diodes are closely matched, the bridge will operate in an unbalanced state, and horizontal locking action will be impaired.
Unstable sync lock also results from leaky capacitors in the afc section.
Collector-junction leakage in the phase-splitter transistor reduces the dynamic range of the control system and causes "touchy" sync locking action.
3-15. To Check the Drive Waveform to the Horizontal-Output Stage
Equipment: None.
Connections Required: Apply scope via lo-C probe at base of horizontal-output transistor, as shown in Fig. 3-26.
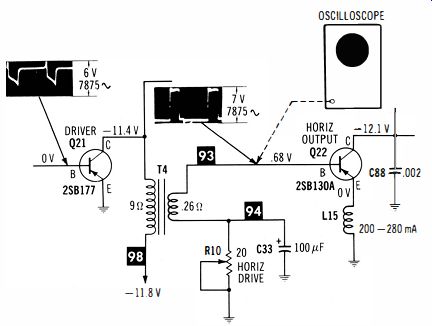
Fig. 3-26. Drive waveform must have normal amplitude and fast rise.
Procedure: Observe amplitude of drive pulse. Adjust horizontal drive control, if necessary, to obtain specified peak-to-peak voltage. Measure the rise time of the drive pulse.
Evaluation of Results: In case that adequate driving amplitude cannot be obtained, check driver input waveform (Fig. 3-26). A subnormal driver input waveform may result from a defect in the horizontal-oscillator circuit, or from collector junction leakage in the driver transistor. Note that although the drive waveform to the horizontal-output transistor has normal amplitude, the output transistor will overheat unless the drive waveform has a sufficiently fast rise time-make a comparison test with a receiver in good working condition, in case of doubt. Slow rise time generally points to capacitor defects.
3-16. To Check the Operation of a Vertical Sweep System
Equipment: None.
Connections Required: Apply scope via lo-C probe to the input and output terminals of the oscillator, driver, and output terminals progressively.
Procedure: Observe the pattern waveshapes and amplitudes, with receiver controls adjusted for normal operation.
Evaluation of Results: With reference to Fig. 3-27, the waveshapes should agree reasonably well with those specified in the receiver service data, and the waveform amplitudes should fall within ±20 percent of the specified values. Note that nonlinearity in this type of vertical-sweep system is often the result of failing electrolytic capacitors. Because of stage interaction, it is impractical to localize a marginal electrolytic capacitor on the basis of scope tests alone.
3-17. To Check the Color Burst in the Complete Color Signal
Equipment: None (unless a color-bar generator is preferred as a signal source).
Connections Required: Connect oscilloscope via lo-C probe to output of picture detector or at a point in the video amplifier prior to the color-subcarrier trap. Connect output from color-bar generator (if used) to antenna-input terminals of receiver.
Procedure: A dual-trace scope is preferable; triggered sweep is necessary. With the complete color signal displayed on one channel, adjust time-base controls to display the color-burst waveform on the other channel ; advance vertical gain control for second channel to display the burst at convenient amplitude.
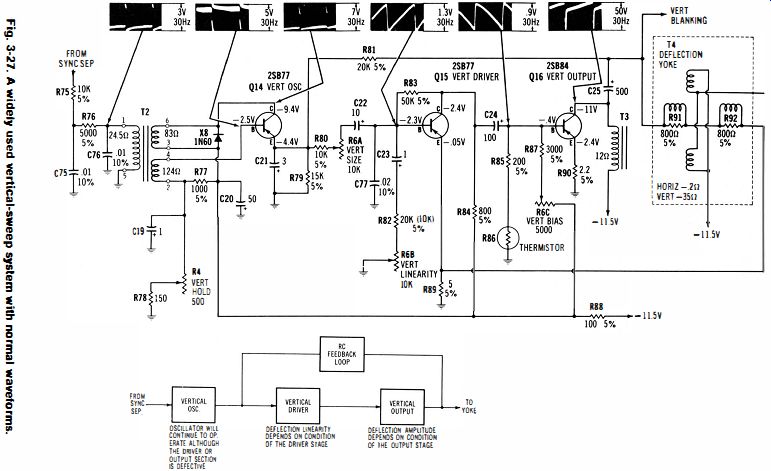
Fig. 3.27
Evaluation of Results: As exemplified in Fig. 3-28, the waveshape of the color burst becomes clearly visible at increased gain on the second channel. Although the burst is transmitted at the same amplitude as the sync tip, the if response is normally 6 dB down at 3.58 MHz, with the result ...
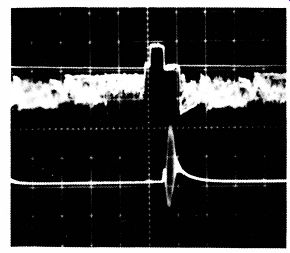
Fig. 3-28. Display of the color burst from the complete color signal.
... that the burst undergoes attenuation to one-half the amplitude of the sync tip. In the case of an antenna signal, propagation anomalies and lack of flat frequency characteristic in the antenna system may result in additional attenuation of the burst. If the color burst becomes excessively attenuated, the color-sync section of the receiver cannot operate normally.
NOTE 3-12
Subcarrier-Sound Beat Waveform
When a 920 kHz "ripple" occurs in the video signal pattern, as exemplified in Fig. 3-29, it is indicated that the sound signal and the color subcarrier are heterodyning abnormally, causing a beat frequency to appear in the video waveform. A substantial 920-kHz beat will also be visible as an interference pattern on the picture-tube screen. A scope is helpful in this situation to signal trace the beat interference back to its source. In general, the 920-kHz beat will not be visible if the receiver is properly aligned, and if the color-subcarrier trap is operating normally.
NOTE 3-13
Time Bases in Dual-Trace Oscilloscopes
A dual-trace oscilloscope provides two vertical attenuators; one attenuator operates in the A channel and the other attenuator operates in the B channel. Service-type oscilloscopes generally provide one set of time-base controls; in other words, channels A and B are deflected by the same time base. A more elaborate design provides separate time bases, so that the channel A signal can be deflected at a different rate from the channel B signal. Provisions for delayed triggering of the channel-B time base may be included. With reference to Fig. 3-28 simultaneous display of the complete color signal and of the color burst from the complete color signal requires separate time bases for the two vertical channels.
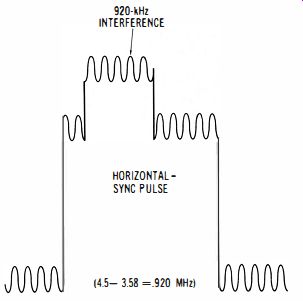
Fig. 3-29. Appearance of 920-kHz Interference in the video signal.
3-18. To Check the Operation of the Color Burst Amplifier
Equipment: None (un less a color-bar generator is preferred as a signal source). Connections Required: Connect the oscilloscope via lo-C probes at the input and at the output of the burst amplifier.
Connect output from color-bar generator (if used) to antenna input terminals of the receiver.
Procedure: Adjust vertical-gain controls for convenient pattern height on each channel. Both channels are deflected from the same time base in this type of display.
Evaluation of Results: As shown in Fig. 3-30, the color burst normally falls on the top of the burst keying pulse. If the burst falls on the side of the keying pulse, it will become attenuated and distorted accordingly. Note that the position of the burst on the keying pulse will move when the adjustment of the horizontal-hold control is varied. In case that the burst is in correctly positioned when the horizontal-hold control is correctly adjusted, it is most likely that a defect is present in the burst keying circuit. Subnormal amplitude of the burst keying pulse also points to a defective burst-keying circuit.
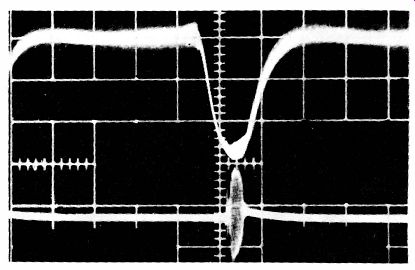
Fig. 3-30. Display of the burst keying pulse with the color burst, and of
the separated burst.
NOTE 3-14
Options in Dual-Trace Oscilloscope Functions
As noted previously, a dual-channel oscilloscope may provide A+B and A-8 displays, to supplement conventional A and B displays. The more elaborate oscilloscopes may include a vertical delay line, trace alignment (trace-rotation) control, Z-axis modulation facilities, separate trigger controls for channel-A and channel-B time bases, and delayed time-base triggering. A choice of alternate or chopped display modes is often provided. Intensification of the channel-A display is sometimes provided by the delayed time base in order to identify the "window" in the channel-A signal which is being deflected by the channel-B time base.
The chart in Fig. 3-31 exemplifies the chief options that are available.
3-19. To Check the Operation of the Chroma Demodulators
Equipment: Keyed-rainbow color-bar generator.
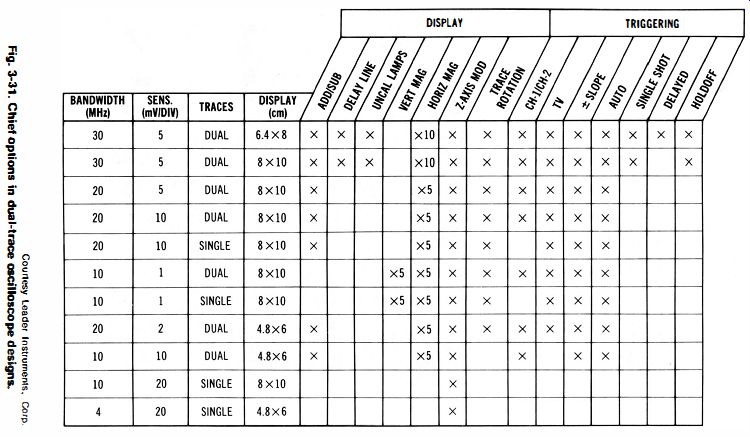
Fig. 3-31.
Connections Required: Connect output from generator to antenna-input terminals of receiver. Connect oscilloscope via lo-C probe in turn to the outputs of the chroma demodulators, as shown in Fig. 3-32.
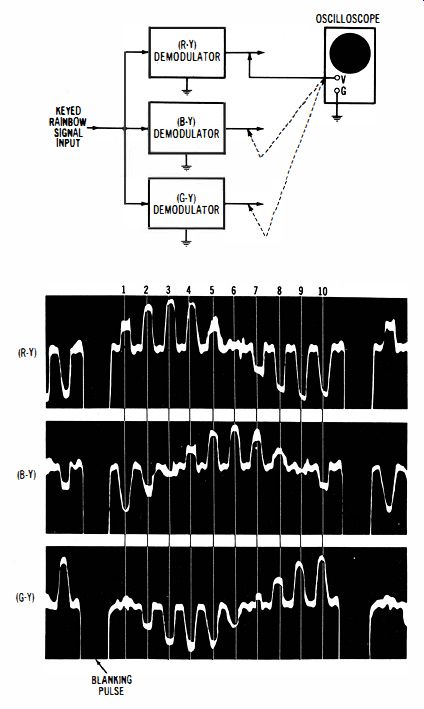
Fig. 3-32. Phase checks of R-Y, B-Y, and G-Y waveforms.
Procedure: Adjust receiver for normal operation; adjust scope controls for convenient display of the demodulated waveform.
Evaluation of Results: In an R-Y /8-Y /G-Y system, the R-Y waveform normally nulls on the sixth pulse; the 8-Y waveform normally nulls on the third and ninth pulses; the G-Y waveform normally nulls on the first and seventh pulses. Lack of proper nulls points to a defect in the color-subcarrier phasing circuitry.
NOTE 3-15 Types of Chroma Demodulator Arrangements
Some color receivers use the X/Z demodulator arrangement; others use the RG8 configuration. Chroma-demodulation nulls for these designs are somewhat different from those for the R-Y /8-Y /G-Y system.
Refer to the receiver service data for the particular receiver. Note also that chroma-demodulation nulls are affected in some receivers by operation of the automatic tint control. In such a case, the waveform nulls should be checked with the tint control turned to the off position. In all receivers, the nulls will shift in accordance with the setting of the manual tint control. Therefore, the tint control should be adjusted to produce correct nulls in the R-Y waveform ; in turn, correct nulls will normally be found in the 8-Y and G-Y waveforms.
3-20. To Display a Vectorgram
Equipment: Keyed-rainbow color-bar generator.
Connections Required: Connect output from generator to antenna-input terminals of receiver. Connect V and H channels of oscilloscope via lo-C probes to the R-Y and 8-Y chroma output terminals of the receiver, as depicted in Fig. 3-33.
Procedure: Adjust receiver controls for normal operation. Adjust vertical and horizontal gain controls of scope for convenient size of pattern.
Evaluation of Results: As exemplified in Fig. 3-33, the displayed vectorgram should approximate a circle. When the tint control is adjusted to make the first "petal" fall at 30 degrees, the third petal normally falls at 90 degrees, and the tenth petal normally falls at 300 degrees. An incorrect phase display points to a defect in the color-subcarrier phasing circuitry.
NOTE 3-16 Distortion in Vectorgram Patterns
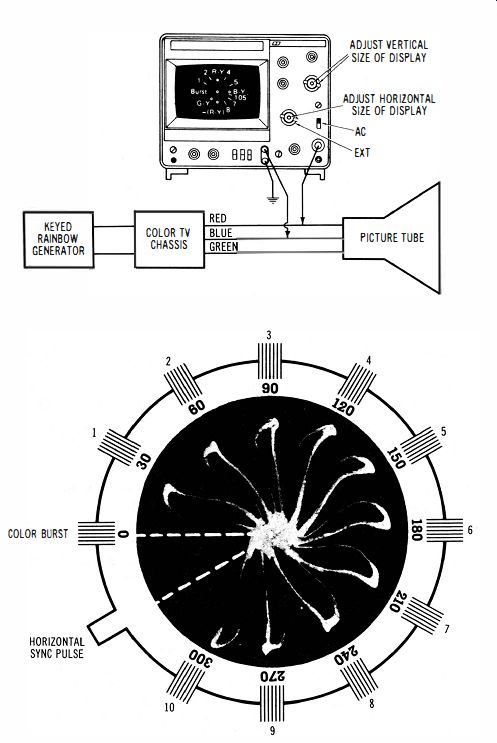
Fig. 3-33. Display of an R -Y IB -Y vectorgram.
A low-level vectorgram is obtained by connecting the oscilloscope at the outputs of the R-Y and 8-Y chroma demodulators. A high-level vectorgram is displayed by connecting the oscilloscope at the R-Y and 8-Y inputs to the picture tube. If a high-level vectorgram is distorted by one or more "flats," it is indicated that a chroma output amplifier is overloading (Fig. 3-34). This possibility is confirmed by a 10W-level vectorgram check. However, in case that the demodulator vectorgram is also distorted by one or more "flats," the trouble will be found in the ...
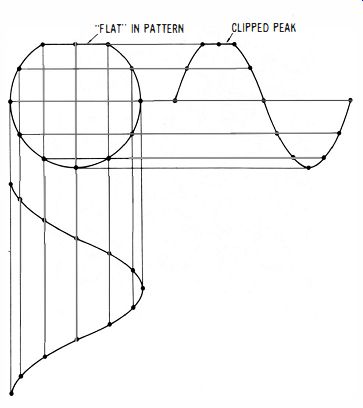
Fig. 3-34. Pattern becomes flattened when one of the input waveforms is clipped.
... demodulator circuitry. A demodulator diode is likely to be found defective in this situation.
3-21. To Check the Bandpass-Amplifier Response Curve
Equipment: Video-frequency sweep and marker generator.
Connections Required: Connect output from generator to input of bandpass amplifier per receiver service data. Connect oscilloscope via demodulator probe at output of bandpass amplifier (or as may be specified in the service data) . Procedure: Sweep the band pass amplifier over a range from 2 to 5 MHz; observe any incidental inst ructions, such as provision of override bias, that may be given in the service data.
Evaluation of Results: The shape of the frequency response curve should approximate the specified display (the exemplified curve shows a rising high-frequency response), and the markers should fall at the specified points (Fig. 3-35).
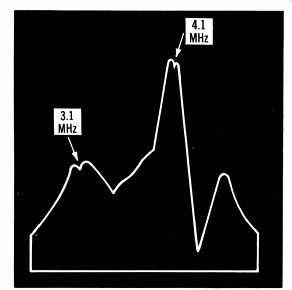
Fig. 3-35. Typical bandpass-amplifier response curve, with absorption markers
at 3.1 and 4.1 MHz.
Absorption markers are often used to avoid possible spurious marker production.
3-22. To Make a Video Sweep Modulation Check of a Color Receiver
Equipment: VSM generator, or video sweep generator, marker generator, and absorption marker box.
Connections Required: Connect equipment as shown in Fig. 3-36.
Procedure: Tune marker generator to chosen picture-carrier frequency; adjust video sweep generator for 0- to 5-MHz sweep; adjust scope controls to display pattern as exemplified in Fig. 3-36B. Then, transfer lo-C probe to output of video amplifier; finally, transfer probe to output of bandpass amplifier.
Evaluation of Results: Normally, the outline of the VSM pattern from the picture-detector output is basically the same as the if response of the receiver. The outline of the VSM pattern from the video-amplifier output (in many receivers) is normally flat-topped through 3.58 MHz (check the receiver service data). The outline of the VSM pattern from the band pass amplifier output is normally flat-topped from 3.0 to 4.1 MHz in most receivers.
NOTE 3-17 Basic VSM Test Data
VSM patterns may be displayed with use of a lo-C probe, as in Fig. 3-36, or with use of a demodulator probe. When a demodulator probe is used, demodulated response curves are displayed, as shown in Fig.3-37. In this example, the frequency response at the output of a chroma demodulator is included. Note that a chroma demodulator normally has a bandwidth of 1 MHz. The basic advantage of a VSM test is that it shows how the picture-channel stages operate together as a team. Normally, the end result is to obtain a reasonably uniform frequency response from 3.0 to 4.1 MHz in each of the chroma demodulators.
3-23. To Make a Ringing Test of a Quartz Crystal
Equipment: Pulse generator and lab-type signal generator.
Connections Required: As depicted in Fig. 3-38, connect output from pulse generator to external-modulation terminals of signal generator. Connect quartz crystal in series between the output from the signal generator and the vertical-input channel of the scope.
Procedure: Tune the signal generator precisely to 3.58 MHz; modulate the generator output with a 2 u-s pulse. Thereby, the crystal is tested with a simulated color burst. Pulse generator repetition rate should be 15.75 kHz, or less. Observe the resulting display.
Evaluation of Results: As exemplified in the illustration, a normal crystal ringing pattern is almost constant in amplitude; it decays very slowly, because the crystal has a Q value of approximately 8000. If the pattern shows Substantial decay over a 60 us interval, the crystal is defective and should be replaced. Note that the top of the ringing pattern is slightly "wavy," due to the fact that the principal mode of vibration is accompanied by residual minor modes of vibration.
3-24. To Measure the Characteristic Impedance of a Lead-In
Equipment: Vhf sweep generator, assortment of composition resistors.
Connections Required: As shown in Fig. 3-39, connect output from sweep generator to one end of a sample length of the lead-in (such as a 3-foot length). Connect a resistor of suitable value, such as 300 ohms, across the other end of the
(A)
Equipment connections.
(b) Representative scope pattern at picture detector output.
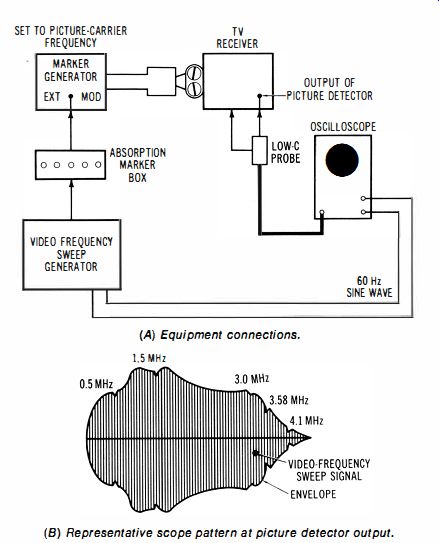
Fig. 3-36. Typical video-sweep line. Connect scope via double-ended demodulator
probe across the resistor.
Procedure: Set vhf sweep generator to any channel from 2 to 13, with a 10-MHz sweep width. Observe pattern on scope screen, using 60-Hz sine-wave horizontal deflection.
Evaluation of Results: A flat-topped pattern indicates that the line is correctly terminated . The value of the terminating resistor will then be equal to the characteristic impedance of the line. However, if the top of the pattern slopes or is uneven, the value of the terminating resistor is not equal to the characteristic impedance of the line. Substitute other values of resistors until a flat-topped pattern is obtained.
(c) Typical pattern at video amplifier output.
(c) Pattern at bandpass amplifier output.
modulation test setup.
NOTE 3-18
Check of Sweep-Generator Output Signal
Most sweep generators have a virtually flat output over any vhf channel. However, if a defect develops in the generator, its output may not be flat. To check this possibility, connect the output from the sweep generator directly to the input of the demodulator probe shown in Fig. 3 39. A flat-topped pattern should be displayed; if not, the sweep generator is in need of service. Note that two representative double-ended demodulator probe circuits are shown in Fig. 3-39. Either configuration is suitable. Most vhf sweep generators have double-ended (push-pull) output. In other words, both of the generator output leads operate above ground.
(A) Output of video detector.
(B) Output of bandpass amplifier.
(c) Output of chroma demodulator.
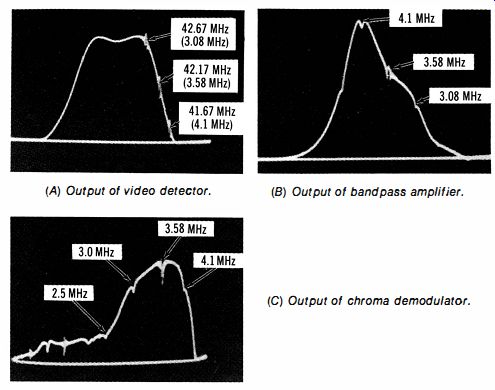
Fig. 3-37. Examples of demodulated VSM frequency response curves.
3-25. To Check the Input Impedance of a TV Tuner
Equipment: Vhf sweep generator, sample length of lead-i n of the type normally used with the tuner.
Connections Required: With reference to Fig. 3-40, connect one end of a section of lead-in to the input terminals of the tuner.
Connect the other end of the lead-in section to the output of a vhf sweep generator, and also to the input terminals of a double-ended demodulator probe.
Procedure: Adjust the tuner for normal operation, and operate the sweep generator on the same channel as the tuner. Use approximately 6 MHz deviation (sweep width). Evaluation of Results: If the input impedance of the tv tuner is the same as the characteristic impedance of the lead-i n, a flat-topped pattern will be displayed, as shown in Fig. 3-39.
Impedance mismatch shows up as a slope or other irregularity in the top of the pattern. Each of the tuner channels should be checked in the same manner.
(A) Test setup.
(B) 3.58-MHz ringing pattern (Q=8000 approximately) .
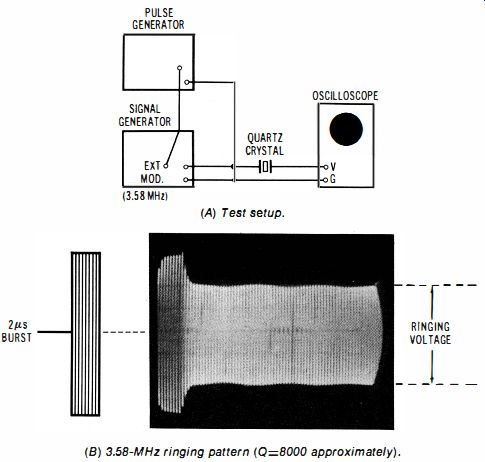
Fig. 3-38. Pulse ringing test of color subcarrier oscillator crystal.
NOTE 3-19
Measurement of Tuner Input Impedance
In case that a tv tuner is mismatched on one or more channels with respect to its rated value of impedance, it is possible to measure the tuner impedance by a follow-up test procedure. With reference to the diagram in Fig. 3-40, the amount of slope and/or curvature in the scope pattern is noted; this pattern will then be duplicated. To do so, disconnect the tuner, and substitute various values of resistance. Thereby, the mismatch pattern can either be matched or approximated. If approximated, a precise match can be obtained by using various values of small capacitances and/or various small inductance values in series with resistance. Sometimes, a small value of capacitance will be needed in shunt to the resistance. Finally, the actual impedance of the tuner input can be accurately determined.
3-26. To Check the Impedance of an Antenna
Equipment: Vhf sweep generator.
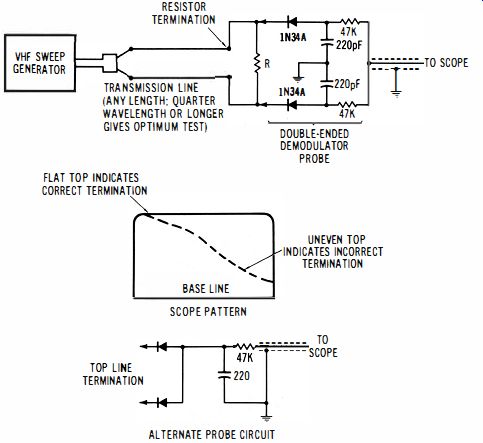
Fig. 3-39. Measurement of lead-in (transmission line) characteristic impedance.
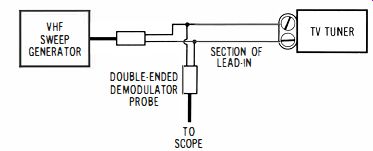
Fig. 3-40. Check of tv tuner input impedance_
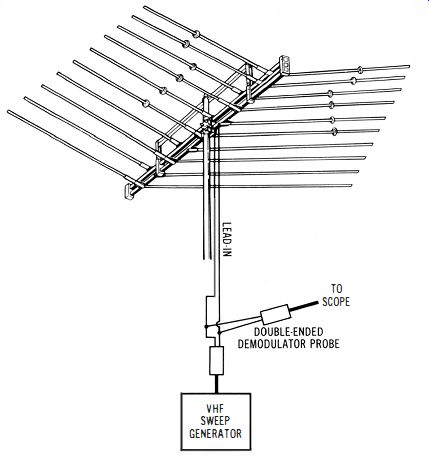
Fig. 3-41. Check of antenna impedance.
Connections Required: Connect output from vhf sweep generator to lead-in, and also connect the lead-i n to a double-ended demodulator probe, as shown in Fig. 3-41 . Procedure: Set sweep generator for 10-MHz deviation (sweep width) and observe the scope patterns as the generator output frequency is switched progressively from channel 2 through 13.
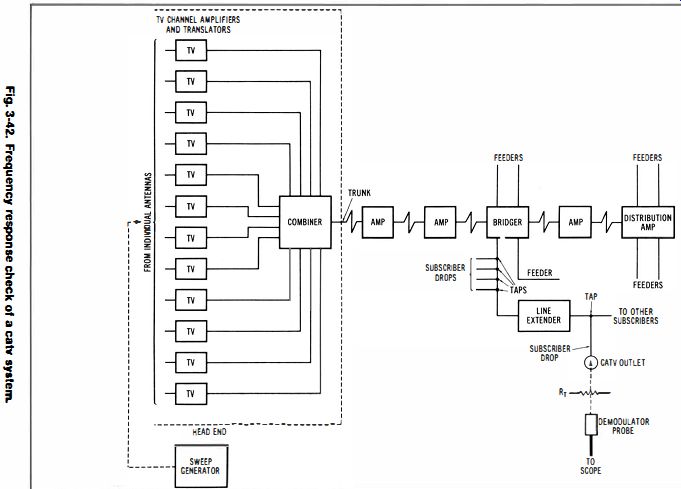
Fig. 3-42
Evaluation of Results: If the antenna impedance is the same as the characteristic impedance of the lead-in, a flat-topped pattern will be displayed, as shown in Fig. 3-39. Impedance mismatches show up as uphill or downhill slopes and/or curvatures in the tops of the patterns.
NOTE 3-20
Test of Coaxial Cable Installation
Although 300-ohm twin lead is the most widely used type of tv transmission line, some installations employ 75-ohm coaxial cable. The foregoing tests can be easily made in coaxial cable systems. However, since there is only one "hot" conductor in a cable circuit, a single-ended (conventional) demodulator probe is utilized. Note that single-ended vhf output is al so used in the generator connections in this case; if a single-ended vhf output cable is not provided, one-half of the double-ended output cable may be used. In other words, the coaxial cable under test is driven from one of the "hot" output leads, and the shield of the coaxial cable is returned to the ground lead of the generator output cable.
Note also that the foregoing tests are valid, whether the generator output cable matches or mismatches the twin lead or the coaxial cable under test.
3-27. To Make a Sweep Frequency Check of a CATV System
Equipment: Vhf sweep generator, terminating resistor for a catv outlet.
Connections Required: With reference to Fig. 3-42, connect the output of the sweep generator to the input of a chosen channel amplifier. Connect a suitable terminating resistor across the terminals of a chosen catv outlet. Connect a scope via a single-ended demodulator probe across the terminating resistor.
Procedure: Adjust the sweep generator to the center frequency of the channel under test, and use approximately 10-MHz sweep width. Observe the resulting pattern on the scope screen.
Evaluation of Results: In normal operation, a flat-topped pattern will be displayed, as was depicted in Fig. 3-39. Otherwise, a frequency compensator in an associated amplifier or line extender is in need of adjustment. These are called tilt controls, or compensators. (If the top of the pattern slopes uphill or downhill, it is said to be tilted.) It is good practice to make an initial test at the most remote catv outlet. A flat response at this point verifies that the main portion of the system is operating properly. However, a comprehensive checkout requires that an outlet along each feeder from a bridger, line extender, or distribution amplifier be checked for frequency response.
NOTE 3-21
Application of Wide-Band Sweep Generator
To speed up sweep-frequency checks of catv systems, a wide-band sweep generator may be used which sweep all 12 of the vhf channels.
Similarly, wide-band generators that sweep channels 14 through 83 simultaneously may be used. Catv installations can also be checked with either conventional or with wide-band sweep generators. Note that low level systems may require demodulator probes with suitable preamps.
3-28. To Measure the Distance to a Short or an Open in a Cable
Equipment: Pulse generator.
Connections Required: Connect output from pulse generator to input end of cable. Also connect input end of cable to vertical channel of scope, as shown in Fig. 3-43.
Procedure: Drive the cable with a comparatively narrow pulse, and observe the relative position of the reflected pulse in the scope pattern.
Evaluation of Results: A reflected pulse that has the same polarity as the initial pulse indicates that the cable is open-circuited at its far end. On the other hand, a reflected pulse that has opposite polarity from the initial pulse indicates that the cable is short-circuited at its far end. The elapsed time from the peak of the initial pulse to the peak of the reflected pulse is proportional to the distance from the generator to the cable defect. For example, suppose that the reflected pulse has opposite polarity to the initial pulse, and arrives after an elapsed time of 5.36 u-s. This means that the cable is shorted at a distance corresponding to 2.18 u-s (one-half the total travel time) . If an air-dielectric cable were utilized, this would correspond to a distance of one-half mile (a pulse travel rate of 328 yards/ /1-s). If a solid-dielectric cable is utilized, the pulse travel rate will be slower; thus, if the rated velocity constant of the cable is 0.8, the distance to the short circuit will be 0.5/0.8 = 0.625 mile (5/8 mile).
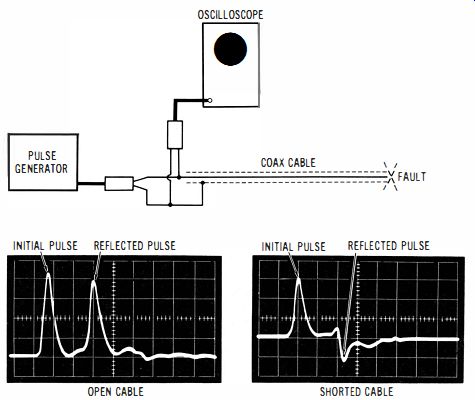
Fig. 3-43. Measurement of distance to a cable fault.
3-29. To Check the Operation of a Delay Line
Equipment: Pulse generator.
Connections Required: Connect output from pulse generator to input of delay line. Connect A channel of dual-trace scope to the input of the delay line. Connect B channel of scope to output of delay line, as shown in Fig. 3-44.
PULSE GENERATOR OSCILLOSCOPE
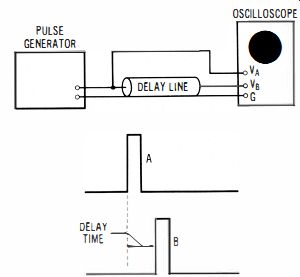
Fig. 3-44. Checking delay line action.
Procedure: Observe the displacement of the output pulse with respect to the input pulse.
Evaluation of Results: The displacement of the output pulse is proportional to the delay time. For example, if the sweep speed is 1 cm/ }Ls, and the pulse displacement is 0.9 em, the corresponding delay time is 0.9 /1-s. Note that pulse delay is always referenced to the 50 percent of maximum amplitude on the input pulse, and to the 50 percent of maximum amplitude on the output pulse. This method avoids possible confusion or error resulting from pulse rise times, and eliminates cornering characteristics from the calculation.
(A) Test setup. (B) Testing a yoke. (C) Calculating approximate Q value.
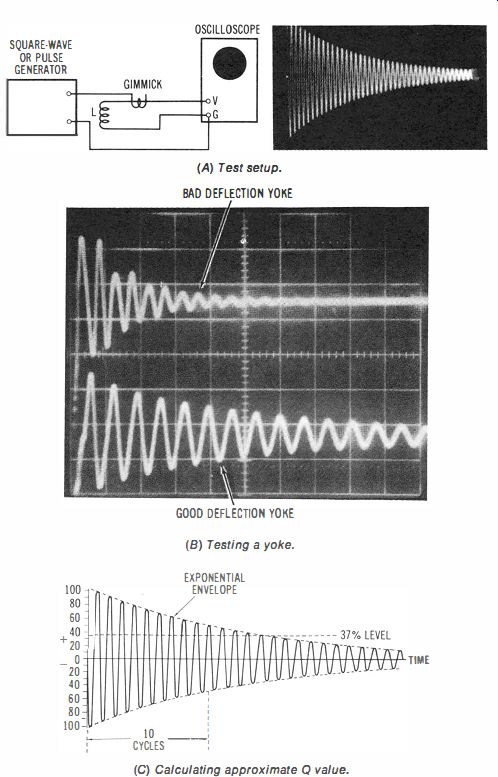
Fig. 3-45. Ringing test for yoke or other inductor.
NOTE 3-22 Rise Time of Pulses on Lines
Pulses displayed in checking the operation of a delay line do not have zero rise time. In other words, the leading edges of the input and output pulses tend to slope. The output pulse may display somewhat more slope than the input pulse. In any case, precise measurement of delay time is made by observing the elapsed time from the 50 percent point on the leading edge of the input pulse to the 50 percent point on the leading edge of the output pulse.
3-30. To Make a Ringing Test of a Yoke (or Other Inductor)
Equipment: Square-wave or pulse generator that provides fast rise.
Connections Required: Connect equipment as shown in Fig. 3-45. (Use small capacitor instead of gimmick for a large coil.) Procedure: Display the ringing waveform as illustrated.
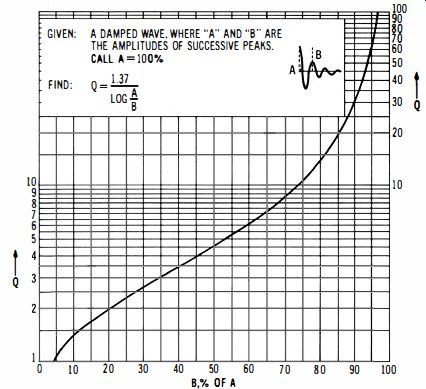
Fig. 3-46. Chart of Q values for a ringing system in terms of successive peak
amplitudes.
Evaluation of Results: In the case of a yoke or fly back transformer, a comparative test is made; the pattern for a suspected yoke is compared with the pattern for a known good yoke. In other applications, the Q value of a coil is determined from its ringing pattern. Count the number of peaks (cycles) in the pattern from its 100 percent to its 37 percent amplitude point. Multiply this number of cycles by pi (3.14); this gives the approximate Q value of the coil at its natural resonant frequency. The ringing frequency is equal to the coil's natural resonant frequency, and is easily measurable with the calibrated time base in the scope. This natural resonant frequency results from the inductance and the distributed capacitance of the coil.
NOTE 3-23 Precise Measurement of Q Value
When it is desired to measure the a value of a coil precisely, reference may be made to the chart in Fig. 3-46. It is based on the rate of decay of a ringing waveform. For example, suppose that each peak in a ringing waveform has 10 percent less amplitude than the preceding peak.
In such a case, the chart shows that the a value of the coil is 30. By way of comparison, the approximate method gives a value of 31 .4 for a in this example; thus, the approximate method is in error by less than 5 percent.