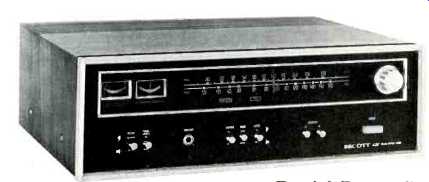
by Daniel R. von Recklinghausen [Technical Director, H. H. Scott, Inc.]
EVERY YEAR buyers' guides are published which present a summary of the performance characteristics of tuners and receivers. Every month magazines publish reviews of this equipment in which they present the findings of their tests. Seemingly every week advertisements, in newspapers or magazines, in catalogs or through the mail, vie for the prospective buyer's attention. Once the prospect is ready to buy a tuner or receiver, he may receive advice from his friendly salesman in addition to the advice he has gotten from his friends, neighbors, and relatives. How can he assimilate all this and then make a rational decision? There should be several factors influencing a decision.
Broadly, they may be classified as convenience factors (or "features"), cost, and performance capabilities.
The most important convenience factor which may influence a decision to select a tuner or receiver is the desire to have all operating controls on one piece of equipment. In this case a receiver (or tuner-amplifier combination) is the obvious choice.
If little space is available to install the electronics, the same choice should be made.
Tuners, without the added audio controls of an amplifier, generally permit greater flexibility in connecting a high fidelity music system and permit equipment of various manufacturers to be used. This simplifies the up-grading or modification of such a system at a later time.
Tuners often duplicate some controls of an amplifier, such as noise filters or level controls. They also require their own chassis and enclosure with panel and knobs, as well as power supply components to operate the receiving circuits.
Since many of these parts are also required in an amplifier, this duplication makes the combination of a separate tuner and a separate amplifier more costly than a receiver. In the early days of high fidelity equipment, when only tube circuits existed, there was the feeling that the tuner portion might be of a lower quality in receivers than in tuners. Principally, the heat generated by the vacuum tubes was thought to cause the tuner circuits to drift. Even back in the "tube" days, the designers were able to lick this problem, which now, in the "solid state" days, is no longer of any consequence. Tuner performance in receivers can be and is fully as good as found in separate tuners.
The last, hardest and the most important step remains: The evaluation of the performance capabilities of a tuner.
Only one question really need be answered: How many stations' programs will the tuner reproduce and how well? It is often impossible to compare all tuners under consideration side-by-side in one's home, comparing the quality of each station's signal, because for a complete listening test, signal quality and interference susceptibility must be compared for each tuning position-a truly imposing task.
The majority of high fidelity equipment users live either in the city or its suburbs. The majority of the 4350 AM stations in the United States, the majority of the 2750 FM stations, and the majority of the 900 TV stations are located in metropolitan areas. The local AM and FM stations will most likely carry different programs since the Federal Communications Commission (FCC) ruled that AM and FM stations under the same ownership may not duplicate more the 50% of their programs if they are assigned to the same city of more than 100,000 population. Unless all the AM programs are of no interest to the listener, or he has enough AM radios, it is wise to consider the purchase of an AM/FM receiver or tuner rather than the FM-only variety.
Even though AM broadcasting stations have to provide at least 5000 Hz frequency response, and many of them provide as much as 15,000 Hz response, interference from other stations and many electrical appliances will make wide frequency range listening difficult in most locations. For this reason the FM reception capabilities of a receiver are considered more important.
Again, keeping the metropolitan FM listener in mind, the FM tuner will have on the average three or four strong local signals (and perhaps as many as 24) picked up by its antenna.
These signals will tend to intermodulate with each other in the RF amplifier and converter stages of the tuner, causing spurious signals and cross-modulation products to be generated.
These stray signals will usually appear on frequencies other than those occupied by the local signals. They may masquerade as "other" stations but really are nothing but a repetition of the local signals. If these signals were to appear only on unoccupied channels they would cause no harm except that of repetition. More than likely, these stray signals will interfere with weaker, more distant signals and may even obliterate them. Consequently, the number of listenable FM stations is reduced from what it could be.
In choosing a tuner it is wise to select one which resists overload due to strong signals, i.e., a tuner which has good cross-modulation rejection. Cross-modulation rejection (or spurious response rejection) is measured in dB in accordance with the standard of tuner measurement published by the Institute of High Fidelity. The number may be thought of as representing the "dynamic range" of r.f. signals the tuner is capable of accepting without problems.
At least 70 dB cross-modulation rejection should be available for metropolitan FM reception if other than local stations only are considered as program sources. Higher numbers are, of course better, with each additional 6 dB permitting signals of twice the field strength (corresponding to approximately one-half the distance to a transmitting antenna) to be available to the tuner without trouble.
Since the IHF cross-modulation measurement is performed with only one interfering signal, and since interference may be caused by several signals of varying strengths, a high cross-modulation figure is not an absolute guarantee against all forms of tuner overload due to strong signals but it is still the best available performance indicator. A set of interference measurements on one tuner under all possible signal conditions would take a very long time. A full report might be the size of one volume of an encyclopedia and would be harder to interpret.
An abundance of strong and weak FM signals are the typical conditions in a metropolitan area. In the writer's home (in a suburb of Boston) 41 different listenable FM signals were recently counted using a high-quality tuner operating from a folded dipole antenna located indoors on the ground floor of a frame building.
To receive this many FM stations (when available) requires a tuner of high selectivity. FM stations are assigned by the FCC to 100 channels 200 kHz apart, ranging from 88.1 to 107.9 MHz. In any one locality, stations are assigned to channels 800 kHz or more apart. Stations in nearby areas are assigned to frequencies in between. These may be assigned to the adjacent channel (200 kHz away), the alternate channel (400 kHz away) or perhaps the third channel (600 kHz away). Selectivity for an FM tuner is measured for the interference experienced when tuned to the desired channel, with a stronger interfering signal fully modulating the alternate channel. It is measured in dB, with a higher number indicating better performance.
Selectivity and bandwidth of a tuner are linked together. While selectivity may be thought of a measure of rejection of signals away (in frequency) from the desired signal, bandwidth may be thought of as denoting the width of the signal spectrum of the desired station accepted by the tuner.
The width of the signal spectrum depends not only on the maximum deviation of the instaneous station frequency from its average (and assigned) carrier frequency, but also on the modulation frequency. The FCC defines 75 kHz deviation as 100% modulation for an FM broadcasting station. Since audio signals have both plus and minus values the station frequency varies both above and below its average value, resulting in instantaneous frequencies spread over a range of 150 kHz.
The actual spectrum occupancy of the transmitted signal is larger because the actual transmitted frequencies are not instantaneous but involve an infinite number of "sidebands" (of the carrier) when the carrier is deviated at a modulation frequency rate. These sidebands decrease in strength at frequencies further away than the "deviation" from the carrier, yet the tuner must process all of them for truly distortion-free reception. This could not permit any selectivity because of the requirements for "infinite" bandwidth. The elimination or attenuation of sidebands away from the carrier causes distortion.
Calculations for a special ideal (and therefore mathematically treatable) filter indicate bandwidths of 265 kHz and 225 kHz if harmonic distortion of 1% and 3% respectively may be tolerated at certain modulation frequencies. Practical, well-designed filters produce less distortion than these figures for the same bandwidths. Since such a bandwidth includes some of the channel space assigned to adjacent-channel stations, and since selectivity is measured with a 100% modulated signal, it is evident that very little selectivity is obtained for adjacent channel signals. The figure may even be negative, indicating the need for a stronger desired signal compared to the interfering signal. For this reason, selectivity is measured for alternate channel signals.
The full story of selectivity is not found in a single selectivity number, but in a selectivity curve as seen in Fig. 1.
Here, the desired signal is indicated by a cross, denoting its strength and relative frequency. The interfering signal is represented by a curve. This curve shows the frequency of the interfering signal and its strength adjusted so that the desired signal predominates in the audio output and therefore "captures" the interference. This selectivity curve (made according to the procedure outlined in the IHF tuner standard) is a dynamic selectivity curve and does not show the response of a selective filter measured in the conventional manner.
At a frequency difference of 0 kHz a special selectivity point is measured-it is the capture ratio. This ratio indicates the ratio of signals required for the tuner to reproduce the stronger of the pair while rejecting the weaker.
In the example shown, the selectivity curves are shown for a desired signal equal to that giving IHF usable sensitivity and for a desired signal 20 dB stronger. For weak signals, the residual noise provides a second interfering signal, resulting in the slightly wiggly curve shape between ± 100 kHz. At stronger signals, the noise influence is eliminated and the true two-signal selectivity curve emerges. The measured "capture ratio" is also improved.
From these curves, it can also be seen that weak adjacent channel signals may be received if the receiver is tuned off to the side so as to discriminate against the interfering signal. Of course, detuning causes distortion, but detuning is usually made so as to minimize the total of audible distortion and interference products.
Selectivity, when reported as a single number, denotes the point on the selectivity curve which is 400 kHz from the desired (center) frequency. For asymmetrical selectivity curves, the center frequency is assumed to be located halfway between the two (low and high frequency) intersections of identical selectivity spaced by a total of 800 kHz.
Selectivity curves of practical tuners are always slightly asymmetrical because coupling of the selective elements is generally by some reactive rather than a resonant elements.
Selectivity curves of tuners which use mechanical elements, such as quartz crystal or ceramic resonators, as selective elements usually show substantially reduced selectivity at the higher frequency portion of the selectivity curve and also show a substantial reduction of the slope at selectivities in excess of, say, 45 dB. This is usually caused by a combination of electrical and mechanical coupling and by other than desired resonant modes of the ceramic or crystal elements.
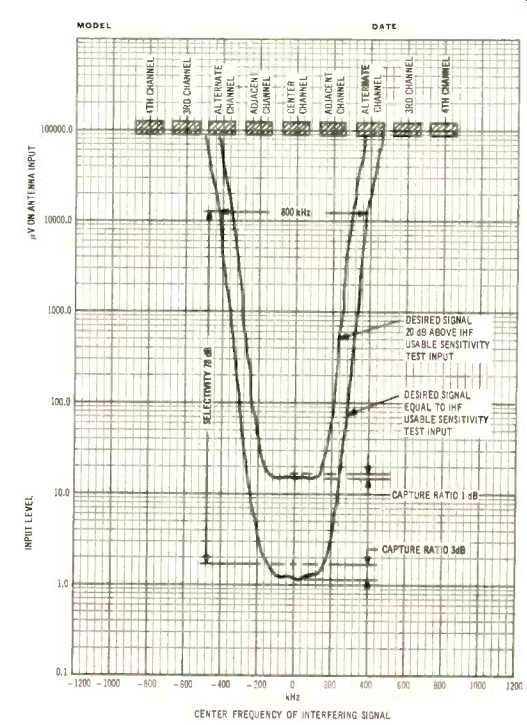
Fig. 1-Selectivity curves and level of desired signal.
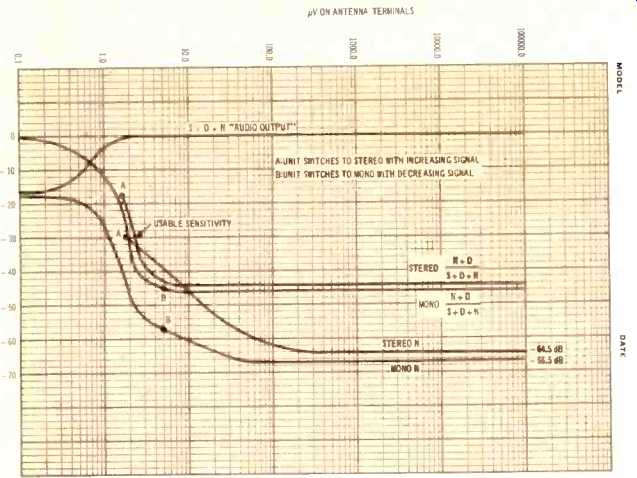
Fig. 2--FM performance.
Overload of the input circuits of a tuner will also cause this widening of the selectivity curve.
The next set of curves which should be examined when selecting a tuner are those often published under the general title of FM characteristics. An example of these is shown in Fig. 2. The first curve of interest is the "audio output" curve, showing total tuner output voltage due to 400 Hz, 75 kHz deviation monophonic, modulation with respect to the (300 ohm) antenna input signal. This output contains the audio signal, its distortion, and whatever noise there may be; it is labeled "S+D+N." The ideal tuner shows this output to be constant for input signals in excess of approximately 5 µV. At the signal level corresponding to IHF usable sensitivity, the audio output will have decreased by approximately 1 dB and in the absence of any input signal will be approximately 15 dB lower than its "normal" output value. These figures assume that the limiter is fully limiting with the random noise generated in the first amplifying stage of the tuner. Only by this action can one be assured that the tuner is sensitive to frequency modulation only and does not respond to amplitude modulation.
At this point it should be noted that the term "full limiting" has been misused-often denoting some arbitrary relative audio output or signal-to-noise ratio rather than its proper meaning--the removal of amplitude modulation.
Practical FM tuners approach the ideal S + D +N curve very closely. Tuners which show markedly lower (by more than 6 dB) audio output at 0 input signal probably have inadequate gain for weak signal processing and may not be fully adequate for critical listening. Tuners which show a variation in audio output of more than 2 dB for signals stronger than their usable sensitivity signal, may be inadequate for many high-fidelity installations because the normal audio output may vary audibly during moderate signal fading experienced when aircraft cause the received signal to vary (a phenomenon known as "airplane flutter") by adding a varying multipath reflection to the direct station signal.
The second set of curves, labeled "mono N" and "stereo N" show the residual noise output of the tuner when subjected to an unmodulated ("mono N") carrier signal or one modulated with a 19 kHz stereophonic pilot signal ("stereo N"). At moderate to high input signals, these curves will be horizontal, showing the total residual noise of the tuner and generator circuits. The "stereo N" curve may also contain residual amounts of the 19 kHz and 38 kHz signals passing through the audio filters of the tuner and some stereo modulator and demodulator noise.
The distance in dB of the "mono N" curve to the S + D +N curve shows the monophonic signal-to-noise ratio of the tuner, and the distance of the "stereo N" curve to the S + D +N curve shows the stereo signal-to-noise ratio. The rated values are usually found at the 1000uV level.
It should be noted that the "N" curves merge with the "S +D +N" curve for a 0 input signal.
In the range of the IHF sensitivity input, the "mono N" curve for the ideal tuner shows its steepest decent, with the noise output decreasing in the steepest portion as much as 6 dB for a 1 dB increase in signal level. Non-ideal tuners will show a lesser figure.
Once the mono signal-to-noise ratio has reached about 48 dB, the noise level will decrease proportionally to the signal increase (a 1 dB signal increase causes a 1 dB noise decrease) until the ultimate signal-to-noise ratio has been reached. The 48 dB point shows the "knee" for mono performance, while the 25 dB point of the stereo signal-to-noise ratio is the "knee" of the stereo performance.
The third set of curves show the total relative undesired output of the tuner, i.e., the total of noise and distortion with respect to the total output. They are labeled "mono N+D/S+D+N" and "stereo N+D/S+D+N". In the absence of any signal, these curves approach 0 dB, and at moderate to high inputs they show the total distortion of the tuner. At all levels, these curves have a higher value than the corresponding "mono N/S+D+N" and "stereo N/S+D+N" curves (which are not shown). In the steep transition region, the corresponding mono or stereo curves should be no more than a few dB apart. Otherwise, the tuner may be suspected to be of narrow bandwidth-which should also be reflected by relatively high stereo distortion.
The signal level at which the "mono N+D/S+D+N" curve crosses the-30 dB line is the point of IHF usable sensitivity--and the rated value for this is the highest number of microvolts found at the carrier frequencies of 90, 98, and 106 MHz.
As may be imagined, listening to programs at the usable sensitivity input is not a hi-fi listening experience, but measurement at this level can be repeatedly performed and is valuable as a basis for comparison. For example, enjoyable mono listening requires signal-to-noise ratios in excess of 50 dB. Some tuners may reach this at the IHF input level, and others may require as much as 6 dB higher signal level. Here, the shape of the curves will help decide this fact.
Enjoyable stereo listening also requires at least 50 dB signal-to-noise ratio. As can be seen, substantially higher signal levels are required-from 10 dB to over 20 dB above the IHF test input.
These figures illustrate that substantially more useful information can be obtained from a few sets of curves than from a list of numbers.
How can a metropolitan listener evaluate the various sensitivity curves? If he lives in the middle of the city in a tall steel-and-concrete building without access to an outdoor antenna he faces most difficult signal reception conditions.
Not only will he not be likely to be able to receive the direct un-reflected signal, but he will be subject to a conglomerate of signal reflections, varying considerably in signal strength from fairly weak to very strong. His signals will be often pure "multipath" and laced with pulse noise interference from automotive traffic and other sources. Such a listener should choose his tuner to have good spurious signal (cross-modulation) rejection and to have good performance for signals of weak to high intensity. Extreme sensitivity is not required because signals below 5µV may be riddled with man-made noise. The selectivity requirements in the city are usually moderate (30 dB or more), because distant signals will be severely attenuated and often buried in noise.
The suburban listener usually has better signals available; generally all of them, local and distant, are stronger than those "downtown." His tuner still must have excellent spurious response rejection. Since listenable distant signals are available, a prime requirement should be good selectivity (40 dB or more). Sensitivity of a tuner need not be extreme, but must not be sacrificed at the expense of spurious responses. Since the man-made noise is lower than in the city, good signal-to-noise ratio with moderate to strong signals should be sought.
The minority of rural listeners should place sensitivity of a tuner high on the list, followed by good signal-to-noise ratio. Most important is a good installation of a high-gain directional antenna to capture as much as possible of the little signal available. An antenna rotator is a "must." Two very important FM tuner characteristics are usually not reported in curve form and one of them is even difficult to express as a number. The first of these is the AM suppression.

Fig. 3a--Simple multipath caused by one reflected signal and one direct
signal.

Fig. 3b--Vectorial addition of direct and reflected signals vs. frequency.
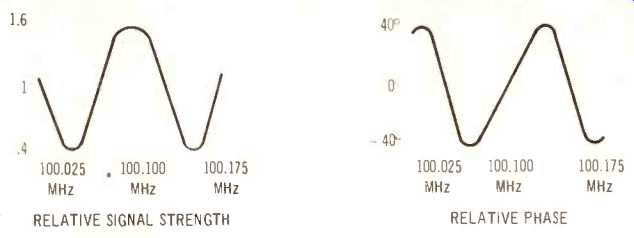
Fig. 3c--Amplitude and phase response of total transmission path containing
one reflection.
The signals broadcast by the FM station are modulated by varying the transmitter's frequency while keeping its power output constant. All the tuner circuits in the transmitter and its antenna system are usually adjusted to minimize any output variation. The tuner circuits in the receiver usually are of narrower bandwidth than those of the transmitter since they have to select the desired signal and reject signals on other frequencies.
For this reason, the received signal at the input to the limiter stages will be attenuated by 0.5 to 3 dB (in typical tuners) as the signal varies from its center frequency to the maximum deviation. This in effect is incidental amplitude modulation of the FM signal, occurring at twice the audio modulation frequency. If the tuner were fully sensitive to this amplitude modulation, its detected signal would experience 3% to 17% distortion. Fortunately, the limiter circuits (along with the detector circuit) remove most of the amplitude modulation, and low distortion reception is possible. The effectiveness with which these circuits remove this amplitude modulation is known (and rated) as amplitude modulation rejection and is measured in dB. Any high fidelity tuner worthy of the name should have at least 40 dB AM rejection when measured with 30% AM. Claims of AM rejection in excess of 60 dB are within the realm of the possible, but are difficult to verify since normal laboratory test equipment is generally not capable of generating AM signals sufficiently free of incidental frequency modulation.
Good AM rejection in a tuner is required not only for removal of incidental amplitude modulation generated within the selective circuits but also for removing as much audible distortion as possible when receiving signals under multipath signal conditions.
As the name indicates, multipath means that the signal reaches the receiver's antenna by a multitude of paths, each having a different loss, and because of their length, a different delay. The effect may be demonstrated as shown in Fig. 3a. Here, just two signal paths are considered, a direct path and a path involving a reflecting obstacle (a hill or a group of tall buildings) located about one mile away. This would cause the reflected signal to have a delay of approximately 10 microseconds. The direct and reflected signals add vectorially in amplitude and phase as shown in Fig. 3b. The resultant now has neither the amplitude nor the phase of the original signal. As the frequency of the signal changes, the relative phase of reflection to direct signal changes 360° for every 100 kHz of signal change. Thus, there may be as many as two instantaneous signal maxima or minima within the normal ±75 kHz modulation range in this example. The resultant amplitude modulation may now include strong components of fourth harmonic distortion of a strength determined by the ratio of direct-to-reflected signal.
The limiter circuits will probably remove most of the incidental amplitude modulation, but they will not affect the phase of the resultant. This phase now varies with deviation of the carrier. Since the carrier is deviated by the modulation signals, the resultant also phase modulates the signal.
This in turn is an incidental frequency modulation of the signal-but one increasing with modulation frequency and containing practically pure distortion. Consequently, under multipath reception conditions, distortion increases with modulation frequency and is most serious at the highest modulation frequencies--those which contain the stereo sub-channel. This is the main reason for stereo reception in cities being often unacceptable when monophonic signals sound much better.
No high fidelity tuner can remove multipath signals. (Extremely complex circuits may be able of minimize multipath problems, but they require laborious adjustment, and so far only the military services have been able to experiment with them). The best cure for multipath problems is the use of a directional antenna along with careful orientation and adjustment. Even indoor antennas of the "rabbit ear" kind can be used with good effect and may be most practical when readjustment is required for each signal.
To minimize multipath problems requires one additional tool, the multipath indicator. As shown above, the increased high-frequency distortion or stereo distortion may be used with the ear acting as an indicator. Unfortunately, the ear is not a reliable tool, particularly when the broadcast station does not "cooperate" by playing music containing a lot of high frequencies or by playing stereo material.
The best results can be obtained when a multipath indicator is connected to the tuner. An oscilloscope may be connected to many tuners to display multipath. Essentially, these connections involve vertical trace deflection with an output containing a signal proportional to signal strength, and horizontal deflection with the FM detector output. Detailed information for connections will have to be obtained from the manufacturers of these tuners, or their representatives or dealers.
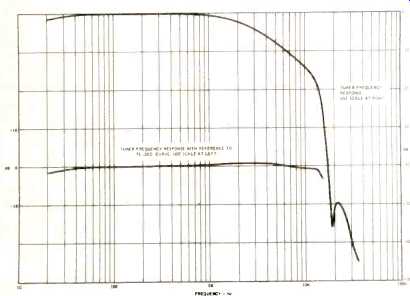
Fig. 4-Tuner frequency response.
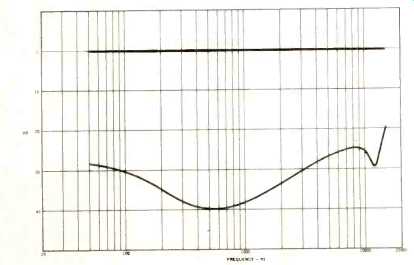
Fig. 5--FM stereo separation.
Other tuners may have these connections already provided and some of them contain built-in multipath indicators such as oscilloscopes or meters. By just being able to adjust the antenna for the best signal, these tuners will be able to give results superior to other installations when difficult multipath reception conditions exist. These difficult conditions can be predicted with good accuracy in most any city having tall buildings, and in any hilly or mountainous area. Flat country or over-water signal paths are rarely subject to serious multipath problems.
The next important tuner characteristic not reported as a curve (or even a number) is the tuner's pulse noise rejection.
As shown above in the section on selectivity, the capture ratio indicates the tuner's ability to have the stronger of two signals predominate in its output while suppressing the weaker one.
When a tuner is subjected to a noise pulse, the pulse should "capture" the signal from the station for the length of time in which the pulse is stronger than the signal. The strength of the pulse in the FM band caused by a passenger automobile ignition system may be 1000 microvolts per meter at a distance of 500 feet. This is 20 times stronger than the old "grade B" service contour of 50 microvolts per meter of an FM broadcast station.
It is important that the pulse cause no worse problems than capture of the signal. As soon as the pulse becomes weaker than the signal, the signal should predominate and no transient due to previous pulse overload should remain. A single pulse should sound as a "tick" pretty much regardless of its strength and not as a "pop". In particular, a pulse or a series of pulses, should not be audible with the receiver tuned off-station. If pulse noise were audible under this condition, listening quality for other than local stations may be impaired.
All the previous tests and curves have documented the important aspects of tuner performance from antenna to the final FM detection. The group of curves in Figs. 4 and 5 describe the performance of the circuits which handle the detector output.
Figure 4 shows the audio frequency response of the tuner circuits. It is shown as a normal frequency response, including the response above 15,000 Hz, the maximum audio frequency broadcast by a stereo FM station. The region above 15 kHz shows how well the 19 kHz pilot signal and the 38 kHz re-insert carrier signal are removed from the tuner output. These frequencies may cause intermodulation with the bias oscillator in tape recorders and the recording of whistle frequencies.
The frequency response is also shown with respect to the standard 75 microsecond de-emphasis curve. It shows how accurately the signals are reproduced. This error should be less than +2 dB between 50 Hz and 15 kHz, the limit frequencies for FM broadcast stations.
Figure 5 shows the stereo separation of a tuner. As may be appreciated, more information can be gleaned from a curve than from a single figure, say, 30 dB separation and without specification of frequency.
For good listening, the tests performed by the Bell Laboratories and by General Electric show that at least 20 dB separation be available over the range of 100 to 8000 Hz.
Most tuners are capable of exceeding this figure--but only a curve will prove it.
There are many more tests which can be and are performed on tuners. They may deal with more refined aspects of the characteristics discussed above, or they may deal with squelch performance, tuning indication, drift, or many other factors.
In all cases, the basic characteristics analyzed here should be considered most when choosing a tuner or receiver. Only after these have been evaluated with respect to the expected signal conditions for city, suburb, or country should other convenience features not discussed here be analyzed.
Last, but not least, reliability and reputation, leadership in technology, and soundness of design should be evaluated. The tuner bought today should give years of good service.
=============
(Audio magazine, Jan. 1972)
Also see:
A Novel FM Probe Unit (Nov. 1970)
How To Align Your Stereo Tuner (Part I)--Modifying the FM Generator (Jun. 1970)
"An Integrated Circuit FM Detector" (Feb. 1970)
Men of Hi-Fi--The Perfect FM Tuner (Jan. 1972)
New Specs for the New Tuners (Jan. 1973)
AM Stereo: An FCC Fiasco (July 1982)
FM Fidelity: Is The Promise Lost? (March 1985)
The Problem with FM (March 1985)
= = = =