by DON DAVIS
[Don Davis, who has more than 30 years of experience in the audio field, is a Fellow of the Audio Engineering Society, a member of the Acoustical Society of America, and a senior member of the Institute of Electrical and Electronic Engineers. He is co-owner, with his wife, Carolyn, of Synergetic Audio Concepts or Syn-Aud-Con, as it is more often known. This audio consulting firm conducts seminars on sound-system design, installation, operation, and maintenance techniques. Davis is the co-author (with his wife) of Sound System Engineering and also a contributor to Handbook for Sound Engineers: The New Audio Cyclopedia, which is part of the Howard W. Sams & Co. Audio Library series. ]
One audio term often used and seldom properly understood is phase. Quite often when this word is used, the person actually means polarity. On other occasions, I have seen signal delay over the propagation path labeled as phase in a principal learned journal. In another similarly important learned journal, a tutorial article by a distinguished professor recommended teaching university-level engineering students about frequency response, directivity, and distortion measurements relative to the analysis of loudspeakers, but it failed to make any mention of phase. One cannot even find the word "phase" in the indexes of most basic texts on audio and acoustics. Yet phase can affect what we hear.
Indeed, many electronics-oriented engineering students have been taught that phase makes no difference, or is inaudible, at the frequencies commonly of interest to the human ear. It is true that most electronic circuits commonly encountered in hi-fi or sound systems have a minimum phase characteristic, but when one goes over to acoustic phase from electrical phase, the group of knowledgeable individuals familiar with acoustic phase measurements becomes quite small. (Those using Techron's TEF analysis or dual-channel FFTs to make loudspeaker and microphone measurements are an exception.) Yet I sincerely feel that, had I been shown phase measurements first in my career, I doubt I ever would have bothered with acoustic amplitude measurements. Amplitude was simply what scientists first learned to measure, but it is not necessarily what was important to measure or necessarily most relevant to what we hear.
For those readers mathematically inclined, I recommend the referenced articles. They are correct, succinct, and thoughtfully thorough. It is really unfortunate that such a simple thing as phase had its mathematics labeled "complex numbers."
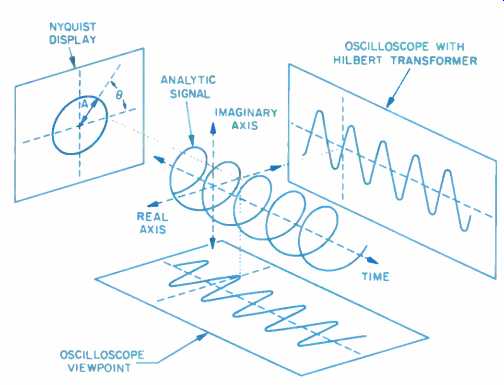
Fig. 1--The analytic signal shown in its multidimensional form.
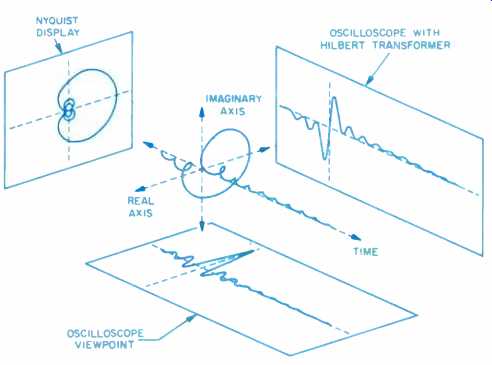
Fig. 2--The analytic signal of a bandpass filter. Note that when the Nyquist
display is at a maximum on the horizontal real axis, the vertical imaginary
axis is at a minimum.
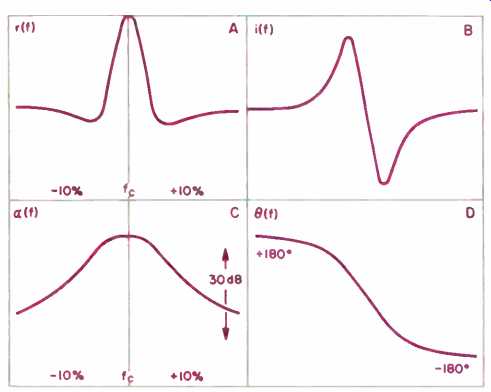
Fig. 3--Four different frequency responses of the same bandpass filter shown
in Fig. 2: Real part (A), imaginary part (B), magnitude (C), and phase (D).
Painless Phase, Minus Math
The acoustic phase measurement can be understood as an observer merely having a different viewing point relative to a given signal. Figure 1 shows the two viewpoints of the analytic signal, called the real and the imaginary parts. As time progresses, the signal goes through 360° over and over again. The number of times it revolves 360° in 1 second is called its frequency--its rate of change of phase. Note that when the amplitude of the real part is just crossing the reference line (which, in acoustics, is the ambient atmospheric pressure), the imaginary part is at a peak value, the particle velocity.
What we call the amplitude of the signal is the length of the arrow on the "end view of the analytic signal. The Greek letter Θ (Theta) indicates the phase angle, which is the fractional part of a complete rotation through which the arrow has rotated, multiplied by 360. If we were to use an oscilloscope, we would see the view labeled "oscilloscope"; if we were to install a Hilbert transformer, one that revolved the phase 90°, we would see the so-called imaginary display on our oscilloscope. If we squared the real part, then squared the imaginary part, summed them, found their square root, and finally took their logarithmic value and multiplied it by 20, we would end up with the magnitude in dB versus the frequency. This is commonly called the "frequency response" but actually is only part of it. If, on the other hand, we took the imaginary part, divided it by the real part, and then found the value whose tangent equaled this ratio, we would have the phase angle for that frequency. Figures 2 and 3 illustrate, for a band pass filter, what a frequency by--frequency plot of all the points of the real and imaginary frequencies would look like and then what the computed magnitude and phase would be. (All loudspeakers can be modeled as bandpass filters.)
Minimum Phase Response
Up to this point, we have illustrated the behavior of minimum phase response. By that, we mean that a Hilbert transform of the magnitude response yields the phase response, and vice versa. In fact, one of the quick tests for minimum phase response, without resorting to the more involved "S" plane approach, is to observe that a peak in the magnitude corresponds to the center of a slope in the phase. Further, a peak in the phase results in that frequency being in a center of a slope of the magnitude. (See Fig. 4.) Why do we care if the response is minimum phase? One excellent reason is that minimum phase filters have uniform phase response for uniform amplitude response. (See Figs. 5 and 6.) Almost everyone has read at some time or another the statement, "I do not use equalizers because they cause phase changes." Of course equalizers do--they would not work if they did not--but the phase change the equalizers cause is a beneficial countering of a detrimental phase change caused by an unwanted band pass effect in the system.
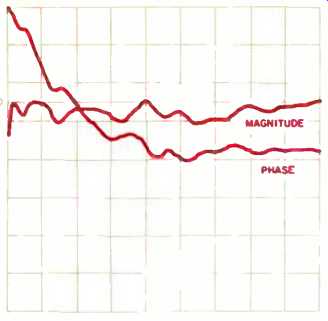 Fig. 4--Phase and magnitude plots vs. frequency. The vertical scales are
6 dB/div. for magnitude and 45°/div. for phase.
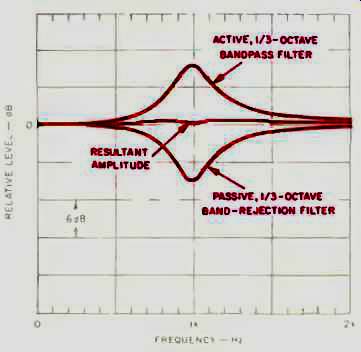
Fig. 5--Magnitude plots for a bandpass filter, a band-rejection filter,
and the resultant when both are in the circuit at the same time.
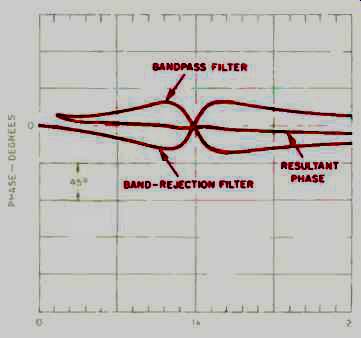
Fig. 6--Phase plots of a bandpass filter, a band-rejection filter, and the
resultant when both are in the circuit at the same time.
Signal Delay
Figures 7A and 7B show that the primary difference between an electrical and an acoustical phase measurement lies in the need to provide a signal delay in the measurement system.
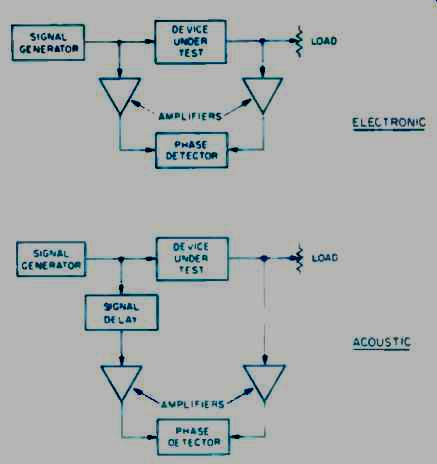
Fig. 7A--Test setups for measuring electronic and acoustic phase. Note that
acoustic phase measurements require adding a phase-calibrated delay device
to the circuit.
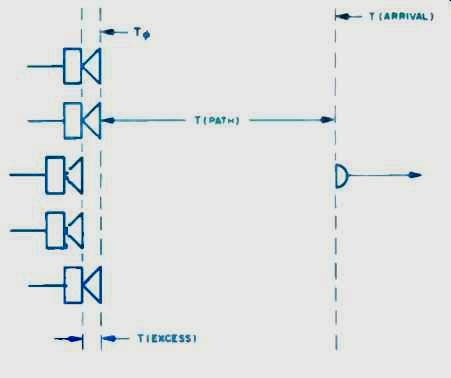
Fig. 7B--The delay circuit shown in Fig. 7A compensates for the delay, T(path),
shown here.
This delay is there mainly to compensate for the propagation path delay T (path) from the loudspeaker through the air to the microphone. A carefully calibrated signal delay allows for measurement of excess delay as well as for T (excess). Phase measurements use T (arrival) as their T(zero), and the phase measurement then becomes the difference between what the analyzer sent and what arrived at T(arrival). Perfection would be a flat response across the spectrum. In high-quality, real-life loudspeakers, we see the phase response first lead, then stay near zero, and finally lag, just as would be the case for a good-quality bandpass filter.
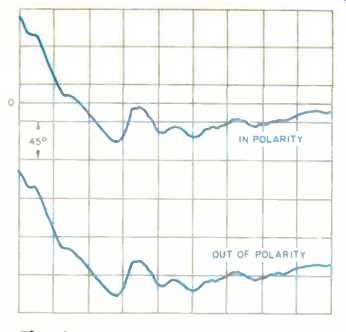
Fig. 8--The phase response of a quality loudspeaker, both in and out of polarity.
Note that polarity is not frequency dependent.
Let's have a look at this delay. Figure 8 shows the phase response of a small 4-inch loudspeaker in an infinite baffle (a totally enclosed box). The delay between the loudspeaker and microphone has been removed, so this is the true phase response. Figure 9 is exactly the same as Fig. 8, but the TEF analyzer's "quick difference" circuitry and software will show only the difference between what we had before and any changes we now introduce. If I move the loudspeaker back a quarter of an inch, Fig. 10 shows the delay as a straight line with a slope to the right.
The signal delay is equal to the phase, in radians, divided by the frequency. Because it is a straight line, it is a constant delay at all frequencies. The steeper the slope, the greater the delay. If this measurement were to slope upward, that would indicate that the loudspeaker was closer to the mike than its original position. As you can see in Fig. 11, signal delay is linear bit phase is not. Another important distinction of phase is that it is frequency dependent.
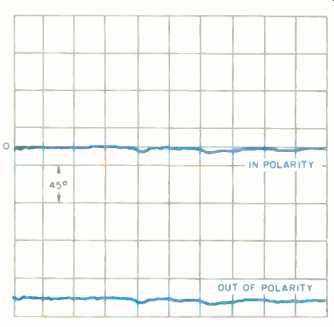
Fig. 9--Same as Fig. 8 but with response normalized by the TEF analyzer's "quick
difference" circuitry.
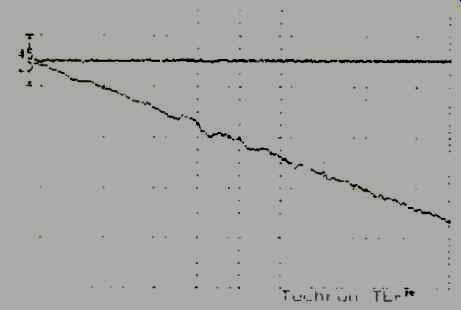
Fig. 10--A signal-delay signature, sometimes mistakenly called phase delay.
The slope's steepness shows the amount of delay; its flatness shows that
delay is constant at all frequencies.
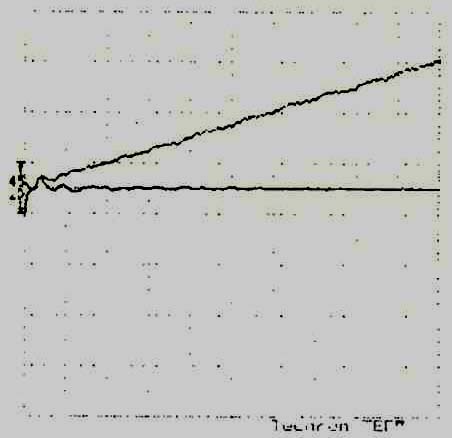
Fig. 11--A signal-advance signature.
Polarity
Often, we hear someone say, "I am going to phase my loudspeakers," when what he intends to do is make sure both diaphragms move in the same direction at the same time. The correct term for this is polarity. In my experience, Paul Klipsch was one of the very few who knew about this before phase measurements became common practice.
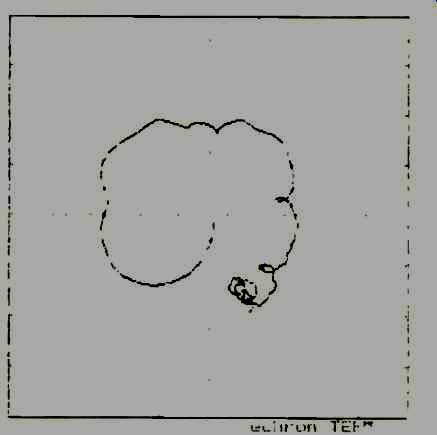
Fig. 12--Nyquist plot of an in-polarity loudspeaker.
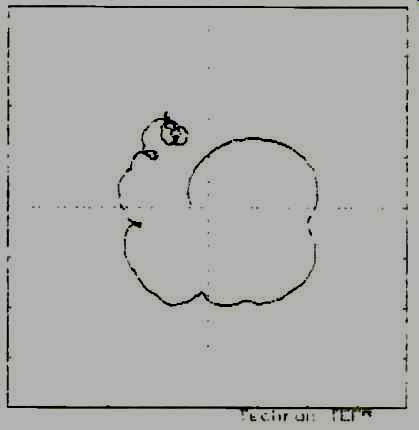
Fig. 13--Nyquist plot of the same speaker but with polarity reversed. Note
the plot rotation, or quadrant shift, and the offset of the origin relative
to Fig. 12.
Again, using the TEF's "differenced curve," let's reverse polarity (Figs. 8 and 9). Note that the phase response is the same curve but displaced 180°; it does not show up as delayed. Thus, a 180° displacement that is uniform indicates a polarity reversal. Looking at the Nyquist plot for both cases (Figs. 12 and 13) reveals quadrant shift. Note particularly the offset from the origin of the plot in Fig. 13. A distinguishing characteristic of polarity is that it is not frequency dependent-every frequency jumped 180°. Those who would like to listen to phase interference in order to know what it sounds like should try the following simple experiment. Take two small single-cone speakers and place one on top of the other. Have a friend talk over both speakers through a single amplifier with a microphone. Now move one loudspeaker back approximately one foot and listen again. Have your friend move the loudspeakers back into synchronization (sometimes called alignment, though I feel synchronization is more correct) while he is talking through them. What you will hear with devastating clarity is phase interference.
Conclusion
Phase measurements can be much more complex than the concepts presented here. They can be used to locate poles and zeros in the complex plane. It is the highest resolution way to find circuit Q and the natural frequency. Phase measurements of loudspeakers are important, and variations in phase and polarity are audible. It is hoped that this simple discussion of what phase is and is not will prove useful when you next look at a simple amplitude response plot and realize how much information is missing.
References
Preis, D., "Phase Distortion and Phase Equalization in Audio Signal Processing--A Tutorial Review," Journal of the Audio Engineering Society, Nov. 1982.
Preis, D., "Linear Distortion," JAES, June 1976. (This article is an absolute must for those who want to delve deeper into the subject.)
Luthropp, Dave, "Measure Phase Instead of Amplitude," Hewlett Packard.
(adapted from Audio magazine, Feb. 1989)
Also see: Dept. of Amplification--Measuring Acoustic Phase (Dec. 1989)
= = = =