by Don Davis
In illustrating my article, "Measuring Acoustic Phase" (February 1989), I made two grievous errors. I failed to credit where two of the original illustrations came from (Figs. 2 and 3) and, in the case of one of them, picked the wrong one for the point I wished to make. The illustration I used as Fig. 3 was the time-domain analytic signal for a low-pass filter, whereas I had meant to choose the same for a bandpass filter.
When Andrew Duncan of Cerwin-Vega, the creator of the software that generated Figs. 2 and 3 in my article, read the piece, he contacted me to point out the omission of the credit and the misinterpretation. Duncan was then kind enough to generate the correct illustrations for the point I was trying to make and chided me on my failure to clarify in the text what was the time domain and what was the frequency domain when I discussed the manipulation of the signals for other displays.
Because Duncan deserves credit for his work, and because I don't like erroneous material in print with my name attached, I offer, with his collaboration, the following clarification.
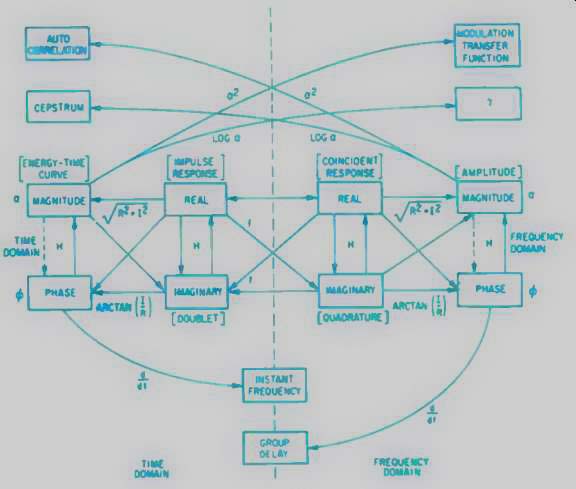
Figure 1 shows the relationships between measurements in the time domain (left side of chart) and the frequency domain (right side). To go from the left side to the right normally requires a Fourier transform, and to come back to the left side from the right normally requires an inverse Fourier transform.

Fig. 1--A basic "road map" of acoustic measurements, in both the
time and frequency domains. The box labeled "?" (upper right) is
the forward Fourier transform of the complex log of the energy-time function.
(After B & K.)

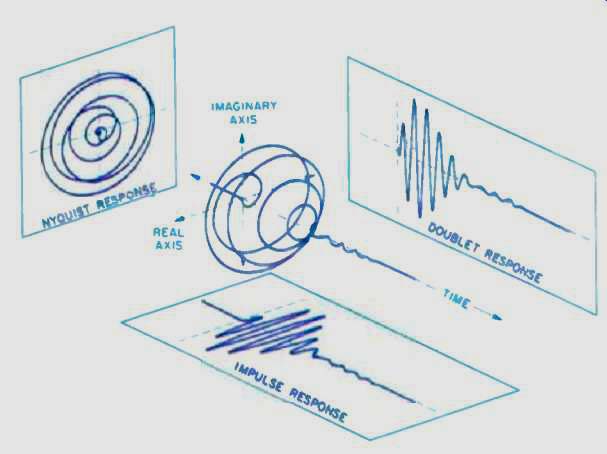
Fig. 2--A time-domain depiction of the analytic impulse response of a four-pole
Butterworth 1/3-octave bandpass filter. Note the impulse response (real)
and the doublet response (imaginary). All loudspeakers can be modeled as
bandpass filters. (This and the following figures from Andrew Duncan.)

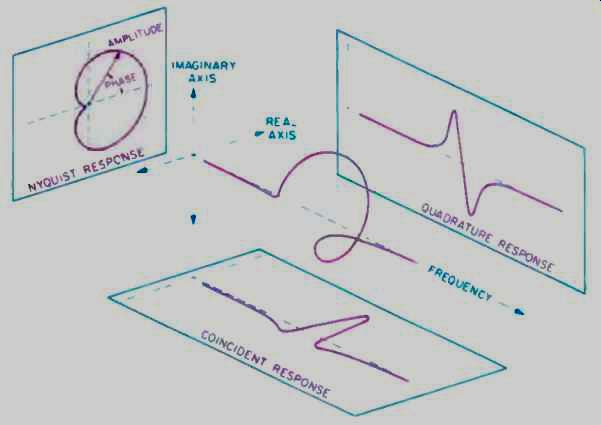
Fig. 3--A frequency-domain depiction of the filter in Fig. 2. Here, the
real part is called the coincident response, and the imaginary part is called
the quadrature response. The Fourier transform of the time domain analytic
signal uses this display.
To go from the real to the imaginary requires a Hilbert operator. The real part, in the time domain, has been given the name impulse response; the imaginary part is called the doublet response (Fig. 2). If the signal acquisition is done in the frequency domain, the real part is called the coincident response and the imaginary part is the quadrature response (Fig. 3). In my article, the illustrations of the frequency-domain real and imaginary parts and of the phase and magnitude responses are correct, but the wording in the text implies that taking the impulse response's real and imaginary parts allows these calculations without first taking their Fourier transform. That implication is, of course, incorrect.
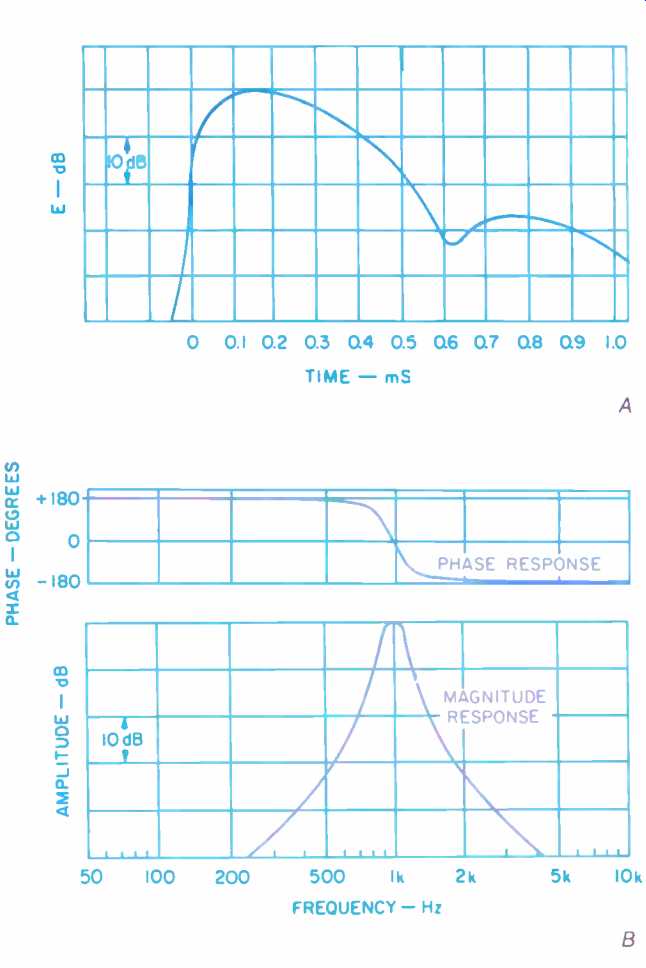
One can plot the envelope and the phase of the impulse response as well, in which case the envelope is called the energy-time curve (ETC) and the phase and magnitude curves are taken in the frequency domain (see Fig. 4). Duncan further pointed out that my choice of words regarding the signal delay display (Figs. 10 and 11) could and did cause confusion. The phase curve shown was linear, and the signal delay shown was constant.
There are few higher signs of respect than to have readers read with care and then share their thinking with you. My sincerest appreciation goes to Andrew Duncan for his constructive, helpful corrections and for the aid of his superb computer software in the depiction of these fundamental relationships.

Fig. 4--In this illustration, the time-domain view shows the energy-time
curve (ETC), which is the energy envelope over time (A). The frequency-domain
transfer function (B) consists of the phase and the magnitude response of
the signal.
References
Duncan, Andrew, "The Analytic Impulse," Journal of the Audio Engineering Society, May 1988 (Vol. 36, No. 5).
Schillinger, Joseph, The Mathematical Basis of the Arts (chapter on quadrant rotation, pg. 233), Philosophical Library, New York, N.Y., 1948.
(adapted from Audio magazine, Dec. 1989)
Also see: Measuring Acoustic Phase (Feb. 1989)
= = = =