ARTHUR C. DAVIS and DON DAVIS
Typical Equalizer and Filter
THE BASIC EQUALIZERS AND FILTERS, and the constant-k, unbalanced, bridged-T circuit for them, along with a sample response curve, are shown in Figs. 13 through 22.
A high-frequency rolloff is shown in Fig. 13, and a low-frequency roll off is shown in Fig: 14. These are the types of circuit that is used in program-equalizer attenuation settings.
Figures 15 and 16 illustrate the circuits used to produce special effects or to eliminate interference that has a definite spectral frequency. The broadness or sharpness of these curves can he varied by a change in the L-C ratios.
Figures 17 and 18 give the circuits that are used to restore deliberate insertion losses to "shelved" type accentuation.
Figures 19 and 20 show frequency selective attenuation and "boost" circuits. It is this type of circuit that is used in a typical high-frequency-boost or-cut portion of a program equalizer or graphic equalizer.
Figures 21 and 22 consist of an 18 dB-per-octave low-pass and high-pass filter. These are extremely useful circuits for limiting the passband of a wide-range system to those frequencies which the transducers involved are capable of handling cleanly, thereby avoiding overload from frequencies not containing useful energy. Variable equalizers and filters are merely series of these basic circuits sequentially selected by means of precision switches such as shown in Fig. 23.
Circuits
Equalizers and filters of this type require careful termination in their rated impedance. Figure 24 diagrams the test set-up used to record the frequency response curves that follow.
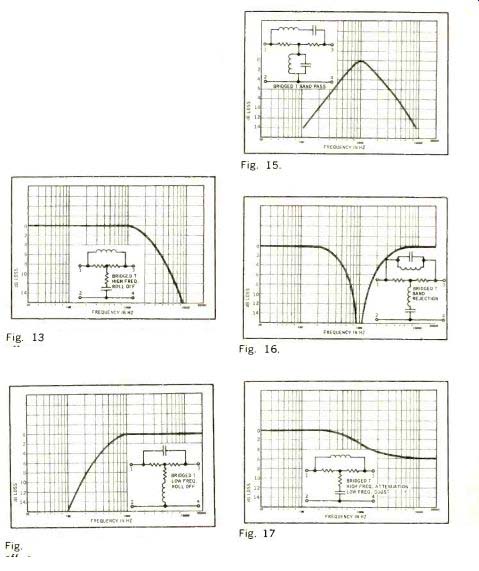
Fig. 13. Bridged-T high-frequency roll off equalizer and its response curve.
Fig. 14. Bridged-T low-frequency roll off equalizer and its response curve.
Fig. 15. Bridged-T band-pass equalizer and response curve.
Fig. 16. Bridged-T band-rejection filter and response curve.
Fig. 17. Bridged-T ''shelving" equalizer used to attenuate highs, boost lows, and the resulting response curve.
Design Laboratory Illustrated
The use of a servo-operated recorder-generator assembly allows automatic recording of the amplitude-frequency characteristics of equalizers and filters. Due to the reduced time such testing requires as compared to conventional hand plotting (and the reasonable cost of such test instruments today), high-quality professional equalizers and filters now come with such curves recorded for each individual unit. Figure 25 shows a laboratory where equalizers and filters are designed and measured. The output of the recorder-driven test oscillator shown at the lower right corner is flat within ±0.5 dB over its entire frequency range.
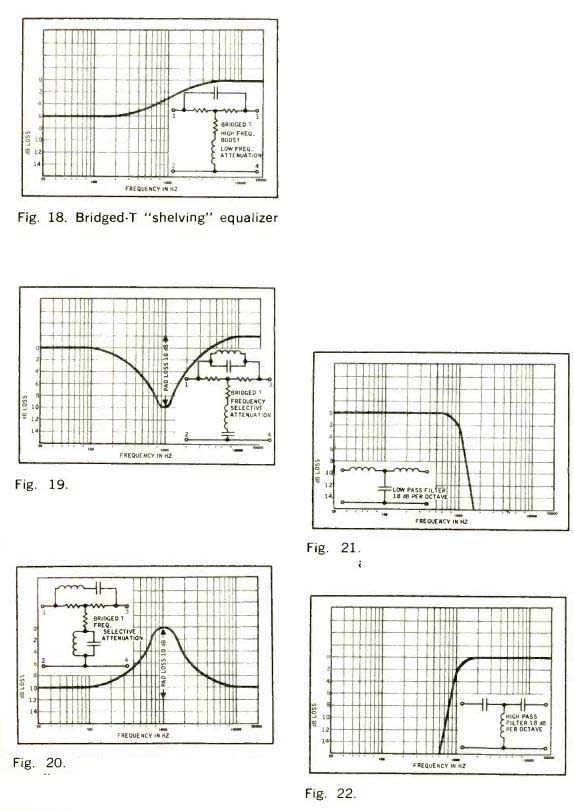
Fig. 18. Bridged-T "shelving" equalizer used to boost highs, attenuate lows, and its response curve.
Fig. 19. Bridged-T frequency-selective equalizer used to eliminate or reduce unwanted peaks in response or to produce a desired effect.
Fig. 20. equalizer Bridged-T frequency-selective used to increase output at a specific frequency.
Fig. 21. 18-dB/octave low-pass filter and its response curve.
Fig. 22. 18-db/octave high-pass filter.
Commercially Available Passive Controls
Commercially available versions of passive equalizers and filters are available from a number of manufacturers.
They take the form of microphone equalizers, program equalizers, graphic equalizers, filter sets, and fixed pre and post-equalizers.
Microphone or Dialogue Equalizer
A microphone equalizer and its plug-in mounting bracket are shown in Fig. 26. This is a series of passive LCR bridged-T, constant-k networks with input and output impedances of 600 ohms. The insertion loss at the "0" or flat setting of the controls is 14 dB. It provides low-frequency shelving at 100 Hz and high-frequency boost at 7 kHz. Maximum boost available at each of these frequencies is 12 dB. It also provides selective attenuation in 2-dB setups up to a maximum of 16 dB at 10 kHz and 16 dB at 100 Hz, as shown in the curve of Fig. 27.
This figure shows the frequency-response curve of it at its flat setting, and then one run at maximum bass boost/ maximum treble roll off, and another at maximum bass roll off/ maximum treble boost.
Program Equalizers
Figure 28 shows a more sophisticated version of the microphone equalizer which is known as a program equalizer. The internal construction showing the mechanical means of selecting the large number of network-circuit combinations represented illustrates why most of those in use are commercially manufactured units.
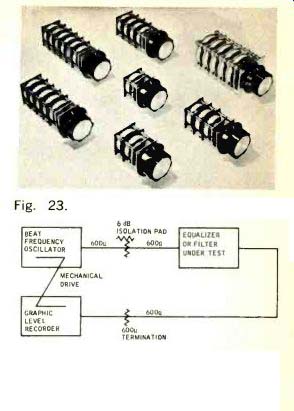
Fig. 23. Precision switches used for attenuators and equalizers in professional audio systems. BEAT FREQUENCY OSCILLATOR 6 dB ISOLATION PAD 6002 Z 6002 MECHANICAL DRIVE GRAPHIC LEVEL RECORDER BOON EQUALIZER OR FILTER UNDER TEST 6002 TERMINATION
Fig. 24. Block diagram of measurement method employed to record response curves automatically.
Equalizers like the microphone unit previously shown are used principally as dialogue equalizers or to correct room problems in a sound stage or studio. Program equalizers, on the other hand, are designed with the playback system in mind as well as the recording system. In addition to its attenuation and boost functions, in 2-dB increments, it allows a choice of two low-frequency shelves at 100 and 40 Hz at the calibrated points and four high-frequency-boost points -3, 5, 10, and 15 kHz. The functions desired are selected by the two knobs at the top of the panel.
On the low-frequency shelving switch are two "off" positions that bypass the entire equalizer and insert a 14-dB loss pad in its place. This allows instant aural comparison between equalized response and "flat" response at the turn of a switch.
Amplitude Response Curves
Figure 29 displays a composite frequency-response chart of the low-frequency shelving at 40 Hz and high frequency boost at 10 kHz for different amounts of attenuation at each of the steps available. Note that the shelving control affects only the boost portion of the equalizer's response.
Similar curves would result from the 100-Hz setting, but would simply be moved up the frequency scale about 1 1/2 octaves. The high-frequency boost selector was set at 10 kHz although 3-, 5-, and 15 kHz positions are also available. Note here also that the high-frequency boost selector affects only the boost functions of the equalizer. These units are usable in any 600-ohm circuit by simply inserting them in the transmission line at the proper level. A wide variety of response curves can be obtained with this type of equalizer.
Graphic Equalizers
A graphic equalizer is shown in Fig. 30. This equalizer allows exceptional control of a signal from 50 to 12,500 Hz. The unit shown consists of 7 boost and 7 attenuate equalizers covering a range from +8 and -8 dB. The total unit has an insertion loss of 16 dB with all controls set at "0" or "flat" position. Each control operates in 1-dB increments. Again, the circuits employed are bridged-T. constant-k, passive networks, designed for use in 600-ohm lines. The special effects possible with this unit range from an "other worldly" voice of the ghost in Hamlet to increased "presence" on a distant microphone pick-up.
The operator's imagination is about the only limitation the instrument imposes. The curves of Fig. 31 were recorded by measuring each boost setting and each attenuate setting individually at its top and bottom position. This enables one to see the individual filter shapes associated with each control. Where the filter "skirts" cross, interaction occurs if two adjacent controls are used simultaneously.
This allows smooth continuous curves to be formed.
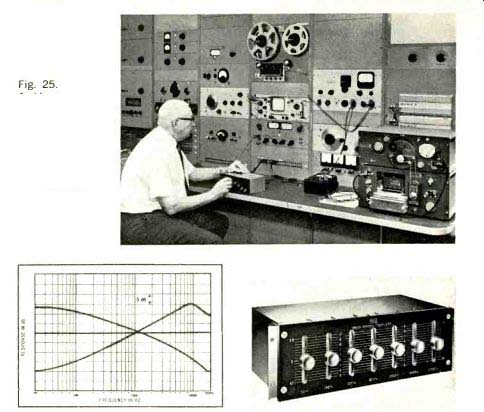
Fig. 25. Co-author Arthur Davis measures response of a graphic equalizer. Note automatic curve tracing equipment at lower right corner.
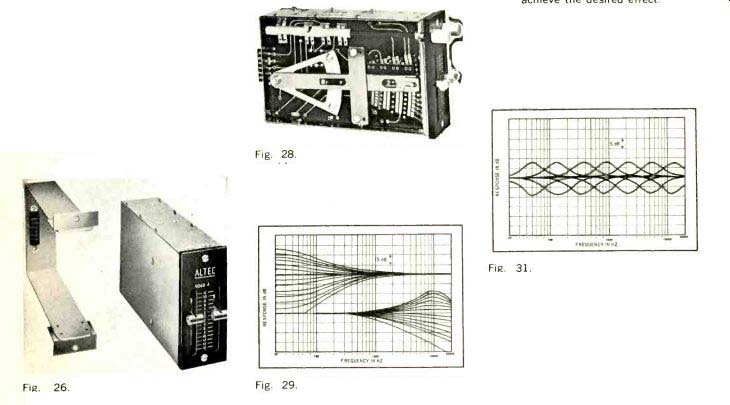
Fig. 26. Altec 9060-A microphone equalizer and its mounting fixture.
Fig. 27. Limits of curves obtainable with the microphone equalizer of Fig. 26.
Fig. 28. Program equalizer which will provide the wide variety of curves shown in Fig. 29. Any combination of these curves may be obtained.
Fig. 29. Composite of curves obtainable with equalizer of Fig. 28.
Fig. 30. Graphic Equalizer which will permit boost or cut of 8 dB at any of seven frequencies approximately 1 1/2 octaves apart. One, two, three, or all of the controls may be varied to achieve the desired effect.
Fig. 31. Composite of 14 individual curves, each of which was run with a single control at its extremes. Superimposed, they appear as shown. If all controls were put at +8, for example, the resultant curve would be practically flat at the +8 level, and similarly would be practically flat at the -8 level if all controls were placed at -8.
(Concluded next month)
+++++++++++++
Also see: