Manufacturer's Specifications:
System Type: Two way, full range.
Woofer: 8 inch.
Tweeter: 1-inch dome.
Frequency Range: 45 Hz to 18 kHz, ±3 dB.
Sensitivity: 86 dB for one watt input at one meter.
Crossover Frequency: 2.5 kHz.
Nominal Impedance: 8 ohms.
Recommended Minimum Amplifier Power: 35 watts.
Size: 11 1/2 in. (29.2 cm) W x 9 1/2 in. (24.1 cm) D x 19 3/4 in. (50.2 cm) H.
Weight: 23 lb. (10.35 kg).
Finish: Walnut vinyl.
Price: $150.00 each.
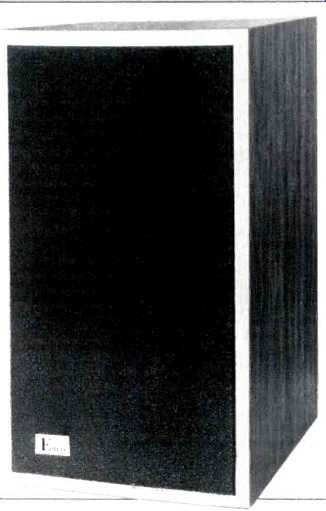
The Model Q is one of Fried Products' "Signature Series" loudspeakers. This is a full-range system housed in a diminutive enclosure measuring only 502 mm X 292 mm X 241 mm (19 3/4 in. x 11 1/2 in. x 9 1/2 in.) and weighs less than 10 1/2 kilograms (23 lb.). A 203-mm woofer is used in conjunction with a 25-mm dome tweeter to cover the frequency range from 45 Hz to 18 kHz. Damped transmission line loading of the rear wave from the woofer is used to provide a smooth low-frequency response. The enclosure is finished in walnut vinyl, with a removable black foam grille providing visual accent.
Connection to the system is made to well-marked binding posts in a recessed cavity on the rear of the enclosure, allowing the Model Q to be placed flat against a wall, should that be desired. This cavity also contains a three-step equalizer control for adjusting the balance of the midrange in 2-dB steps, and a replaceable 2-amp fuse for protection against overdrive.
Although the cabinet and subsequent technical investigation showed that Fried Products Company provides a quality item, I was frankly surprised by what seemed to me to be a relatively small amount of instructional material in the printed brochure supplied with the system. While the brochure mentions the three-step control and that it is marked Plus, Normal, and Minus, the samples supplied Audio had no such markings. The brochure fairly and clearly warns about the terrible results of accidental or deliberate overdrive, but I would like to have seen somewhat more detail concerning the correct installation and anticipated performance of this unique loudspeaker system.
The small size of the Model Q lends itself to bookshelf mounting, and, as with all overhead installations, care should be taken to avoid any circumstance where the unit could fall or be pulled down on children or pets.
Measurements
Impedance, measured at the terminals of the Fried loudspeaker, versus frequency for each of the three equalizer positions is shown in Fig. 1. The designations L, M, and H in Fig. 1 refer to the relative drive level to the tweeter, with the H position corresponding to a fully clockwise rotation of the control. After a small bass resonance rise a: 60 Hz, the impedance drops to its lowest value of around 5.5 ohms at 150 Hz. A secondary impedance peak occurs in the 1.5to 2-kHz range.
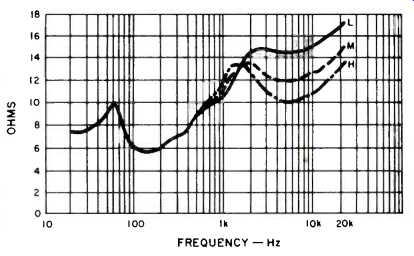
Fig. 1--Magnitude of terminal impedance for three equalizer settings.
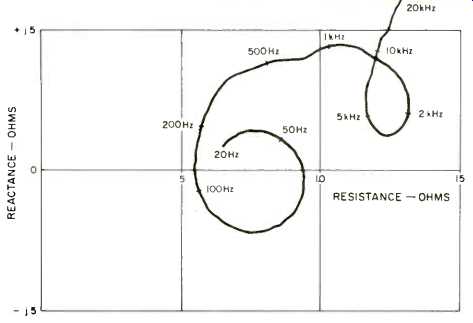
Fig. 2--Complex terminal impedance for center equalizer setting.
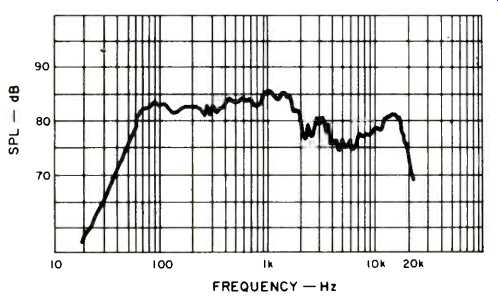
Fig. 3--Anechoic one-meter on-axis frequency response for constant voltage
drive level corresponding to one average watt into 8 ohms.
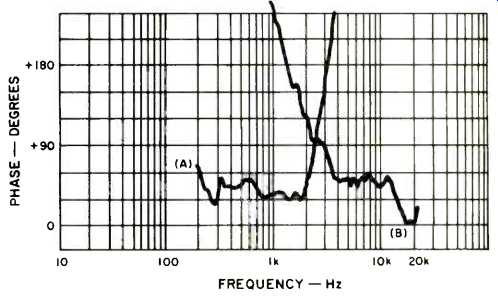
Fig. 4 Anechoic one-meter on-axis phase response corrected for (A) acoustic time delay of woofer, 3.467 mS, and (B) acoustic time delay of tweeter, 2.968 mS.
This system should be considered a low-impedance load to the power amplifier, and there is no hidden problem with reactance variation for the Model Q. This is verified by the polar impedance plot of Fig. 2, measured for the M tweeter equalizer position. The load is without substantial reactive current demands so that any good power amplifier should be able, without difficulty, to drive the Model Q to the full capability of that amplifier.
The anechoic frequency response, measured at one meter on axis, is shown in Figs. 3 and 4 for the M tweeter-equalizer position. Figure 3 is the amplitude response for a constant voltage drive corresponding to one-average-watt into an equivalent 8-ohm resistance. Figure 4 is the phase response corrected for the woofer and tweeter arrival times at the microphone location. Comparison of these measurements shows that the actual acoustic crossover frequency is around 2.5 kHz and that the axial energy from the tweeter is around 5 dB lower than that of the woofer, except for a mild resonance rise at 15 kHz. This implies that program material rich in upper register energy may be somewhat dulled. The nature of the measurement suggests that a parametric or bandpass type of equalizer control may well be the best way, given this tweeter control setting, to balance the high- and low-frequency portions of the response, since the usual type of tone control provides an emphasis which increases with increasing frequency above the turnover point. Such a combination would probably prove too bright in the highest registers.
The apparent acoustic center of the woofer is such that most frequencies below about 2 kHz arrive at the listening location with an average delay of 0.560 mS relative to the air path time delay from the physical front of the enclosure. The tweeter location has an equivalent delay of 0.061 mS. This places the arrival time difference between tweeter and woofer at approximately 0.499 mS, which amounts to one wavelength at 2 kHz. At this microphone location, which is one meter directly on the geometric axis of this system, the response should be characterized as being a non-minimum phase type. The jury is still out on the full aural significance of non-minimum phaseness, but waveform fidelity is sacrificed by such a characteristic.
The low-frequency response, just starting to roll off at 60 Hz, is quite good for such a small physical system. And the top end, above 2 kHz up to nearly 20 kHz, is also quite good.
However, we don't listen in anechoic chambers, we listen in rooms, and Fig. 5 shows the results of our three-meter room test on the Fried Model Q. The loudspeaker was placed 70 cm off the floor and flat against a hard wall. This was the position found in the earlier listening test which gave the most consistent stereo imaging with the least amount of mid bass emphasis. The microphone was placed three meters from the front of the enclosure and one meter above a carpeted floor, which is a reasonable listening position for this speaker system. The frequency response of the first 13 mS of direct sound from the Model Q is shown in this measurement. Two microphone positions are shown, one directly on axis and the other 30 degrees off axis in a setup corresponding to this speaker used as a left channel for stereo reproduction. The curves are displaced 10 dB for clarity of presentation.
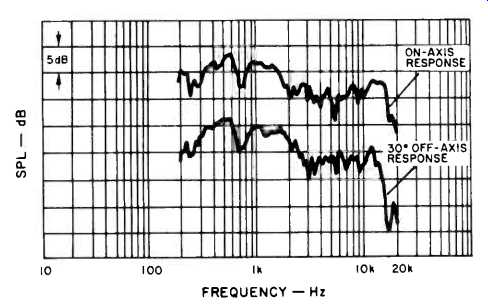
Fig. 5--Three-meter room test.
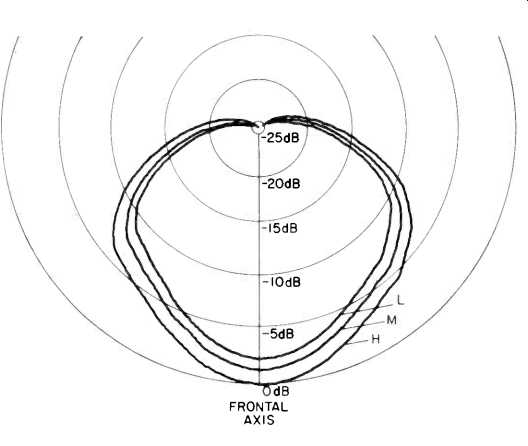
Fig. 6--Horizontal polar energy response for each equalizer setting.
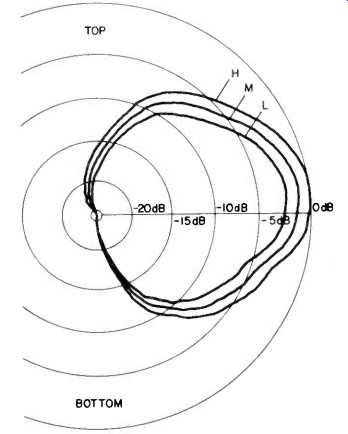
Fig. 7--Vertical polar energy response for each equalizer setting.
The three-meter room test shows an amplitude response quite similar to the one-meter on-axis anechoic response. There is, however, some small influence of floor and ceiling reflection in the 200-Hz to 1-kHz range. The angular dispersion of the system is quite uniform within 45 degrees of its axial direction. This accounts for the essentially similar axial and off-axis responses shown in Fig. 5. Lateral dispersion leads to rather good stereo lateral imaging and freedom from a "best seat" listening location, but the Model Q has just a bit too much vertical spread which causes some interference between the direct sound wave and that wave which reflects off the ceiling of the listening room. The phase response of the three-meter room test (not shown) reveals some interference in the 2.5to 8-kHz range. All in all, however, this is quite respectably good response for room listening.
The measured horizontal and vertical dispersion patterns are shown in Figs. 6 and 7 for each of the three equalizer positions. These are polar energy patterns showing the net energy from all frequency contributions in the 20-Hz to 20-kHz range. No substantial beaming exists for the Fried Model Q. The measurement shows that the response is rather uniform, on the average, within 30 degrees of the frontal axis of the loudspeaker. The action of the equalizer controls is mild, resulting in average spectral changes of slightly greater than one decibel per step with no effective change in dispersion.
The wide angular response of this system, particularly in the vertical plane, indicates that the speaker should not be placed next to substantial objects which might reflect sound back toward the listening area. This system should be placed off the floor (as experimentally determined in the earlier listening test) and not put under overhanging shelves.
Harmonic distortion measurements for pure tones of 41.2 Hz (E1), 110 Hz (A2), and 440 Hz (A4) are shown in Fig. 8.
Distortion on the low bass E is moderately high at all power levels, consisting of about equal portions of second- and third-harmonic content. Since this tone lies below the natural low-frequency cut-off of this system, no acoustic problems should arise unless the system is overdriven by program material which has been heavily boosted in the bass. The tones of A2 and A4 lie within this system's passband and are handled at moderately low distortion levels up to average powers of 30 watts. One possible source of sonic distortion for those who are sensitive to such things is the second harmonic distortion levels which rise uniformly with signal level.
The IM test, Fig. 9, measures the extent to which a higher musical tone, A4, is modulated by the presence of the lower musical tone, E,. Both tones are mixed at equal level, and the root mean square of the acoustic cross-modulation sidebands on A4 is shown as a percentage of the acoustic level that A4 would have if the lower tone were not present. The data are plotted as a function of average power in watts referred to 8 ohms. Below two watts, the IM is principally due to phase modulation of the higher tone by the lower tone. An amplitude modulation component enters above that power level.
The modulation gradually increases with power level such that,_ at 60 watts, there is a 10-degree peak-to-peak phase modulation of A4 and a corresponding 10-percent amplitude modulation. There is also, at 60 watts, a shift in the apparent acoustic center of A4 toward the listening location accompanied by an average amplitude reduction of about 0.1 dB. This effect is undoubtedly due to the large excursion caused by the lower frequency which lies below the acoustic cut-off of this system. These measurements indicate that musical passages containing high levels of low-frequency material may cause time base shimmer and acoustic migration of middle range voices, even though the speaker is not driven to levels of obvious distress.
Acoustic transfer uniformity is another measure of a loudspeaker's ability to handle program dynamics. The ratio of sound pressure to driving voltage should remain constant for any tone at any power level within the system's normal range of reproduction. If this ratio changes with drive level, then we can expect both musical timbre and image localization to alter with sound intensity. Three tones, A2 (110 Hz), middle C (262 Hz), and A4 (440 Hz) were used to check the Model Q. (Spot checks were also made at several other pitch values.) These are tone-burst tests in which a tone is applied for a short duration simulating a staccato passage. A2 was handled with less than 0.1-dB deviation from perfection up to 50 average watts. Middle C remained essentially perfect up to 1 watt, dropped 0.3 dB at 10 watts, and fell to 1 dB at 30 watts. A4 dropped 0.2 dB at 1 watt, 0.6 dB at 10 watts, and 1 dB at 30 watts. The small reduction in sound pressure for higher tones relative to lower tones indicates a slight tendency for softening of timbre with increased program level for sets of tones comprising chords.
The measurements also suggest a slight lateral migration of extreme stage-left and stage-right stereo imaging with increased intensity of sound. All loudspeaker systems show problems in this test, and the Model Q comes out slightly below the average for the speakers we have tested for this subjective effect.
Another form of distortion of program dynamics is checked by what we call the crescendo test. A low-level tone is measured for sound level change when broad-band incoherent noise is superimposed at an average level 20 dB above that of the tone. The intent of this test is to determine the extent to which an orchestral inner musical voice is modified by a sudden swelling of sound from nearby instruments.
The Model Q fares better in this test. A tone of A4 at a level of 100 milliwatts (0.9 volts rms) is reduced approximately 0.6 dB when 10 average watts of 20-kHz band-limited white noise (50 volts p-p) are superimposed. The tone of A2 remains within 0.1 dB at the same drive level. The net effect of both these measurements is that stereo localization and preservation of timbre should be better under conditions of high-level orchestral dynamics than for solo instrument passages.
The energy-time curve is a measure of impulse response; the measured curve for the Model Q is shown in Fig. 10. The microphone is placed one meter from the front surface of the loudspeaker and along the geometric axis. The first sound from the tweeter arrives at 3.00 mS, followed by two low-level delayed tweeter reflections at around 3.1 and 3.2 mS. The highest frequency contribution from the woofer begins to arrive at around 3.2 mS, and since the tweeter has not finished its die-down, a small amount of mutual interference is evident in the 3.25to 3.5-mS range. After that, the woofer arrivals dominate and provide a smooth decrease in energy from that time onward. Only a few enclosure edge reflections can be seen at levels some 30 dB below the peak energy of first arrival. The 3.25to 3.5-mS interaction of arrivals from tweeter and woofer is the cause of the small response irregularities in the 2-kHz to 5-kF+z range which is evident in Fig. 3.
However, with the exception of the small differential delay between the two drivers, the impulse response of the Fried Model Q is quite good.
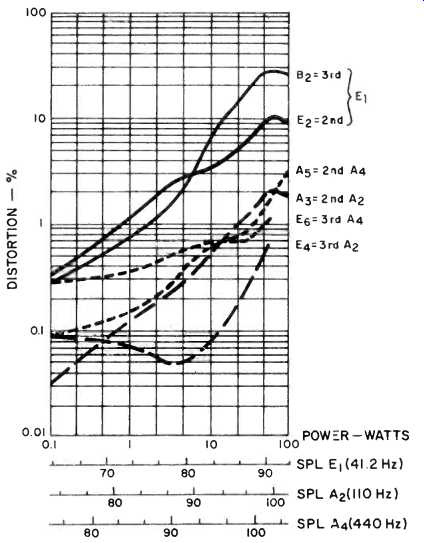
Fig. 8--Harmonic distortion for the tones of E, or 41.2 Hz, A2 or 110 Hz,
and A, or 440 Hz.
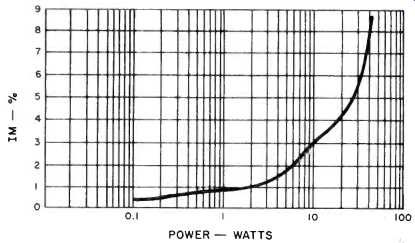
Fig. 9--IM distortion on A4 (440 Hz) when mixed in one-to-one ratio. by E1
(41.2 Hz)
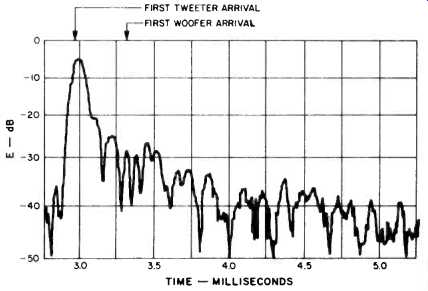
Fig. 10 Energy-time curve.
Listening Test
Instructions supplied with the Model Q indicate that exact positioning is not critical to listening quality, except that the speakers should not be placed in a corner or flush with the floor. After some experimentation to find the best setup and then extended listening, I felt that I got the most accurate sound from the Model Q when it was placed against a draped wall and on a firm pedestal which lifted the speaker 70 cm off the carpeted floor. The draped wall provided the least amount of reflected energy for a stereo spacing which subtended an angle of about 60 degrees at the listening location, and the pedestal lifted the center line of the speaker to about normal seated ear level.
My first impression was that the Model Q does not have extreme low bass, although it does a good job of handling music down to about an octave and a half below middle C. A thunderer it is not, so that if one is an addict of organ pedal notes or open-string bass sound, the addition of a subwoofer might be considered. However, no bass EQ is needed since the mid and lower registers are well balanced.
The upper midrange has a characteristic which handles some types of vocals well, but there is a timbre softening with percussive instruments. The treble range seemed, to my ears, to have a peakiness or strident quality in the reproduction of piano, which is one of the very most difficult of instruments to reproduce accurately. This seemed to relate to a general reduction of extreme top end relative to the upper midrange, which condition was verified later in the measurements. Attempts to restore sonic balance with the rear mounted tweeter controls did not help, in my opinion. I finally settled on the "normal" switch position and added a small amount of treble boost at the preamp, about 2 dB at 9 kHz relative to a reference at 1 kHz.
Stereo lateralization is quite good with the Model Q, though to my ears the sense of image depth was not as effective as the good sense of lateral placement. Experiments with reversing signal polarity did not modify this impression, as can sometimes be the case, and the only improvement I could make here came when I pointed the Model Qs slightly outward and away from the listening position.
Both vertical and horizontal dispersion of sound is excellent in the Model Q, and the subjective stereo localization does not significantly migrate as one moves around the listening area. Such a characteristic relates to the smoothness of the polar plots, which were performed later, and is valuable in that it helps present a good stereo image in a variety of listening positions.
Although the extreme low bass is reduced in this system, the woofer can handle quite significant amounts of bass drive without audible distress. The now-famous bass drum on the Fennel/Holst Suites 1 & 2 (Telarc 5038) was handled with no breakup even at a quite robust level of playback. The sonic effect was not visceral, but the system doesn't go "crunch" either, which many other systems will do at a comparable drive level.
On balance, this speaker can provide excellent service for limited to moderate budget circumstances, particularly where a loudspeaker of small physical size is advantageous.
While this is not a "money no object" system, the Model Q does offer good overall performance at a modest price.
-Richard C. Heyser
(Audio magazine, Jun. 1980)
Also see:
Frankmann Integrated Stereo Speaker System (Jul. 1974)
Fairfax FX-300 Speaker System (Nov. 1972)
Fisher ST-425 Speaker System (Equip. Profile, Jan. 1975)
= = = =