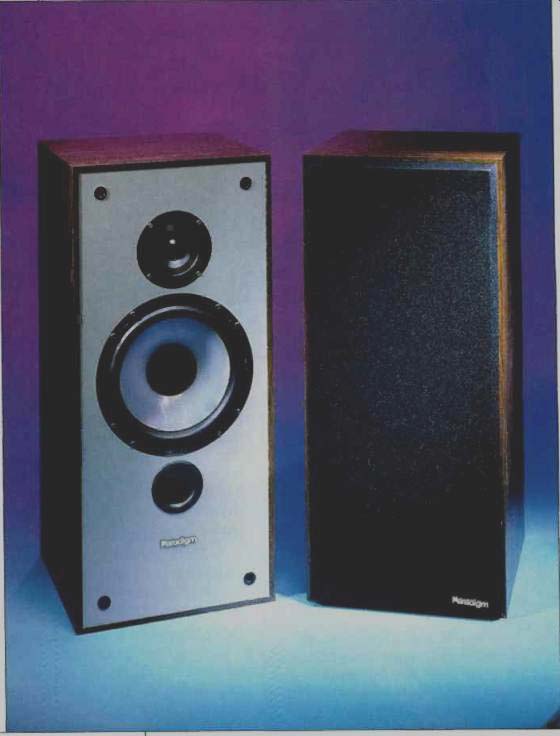
Manufacturer's Specifications
System Type: Bookshelf-size, two way, vented box with critically tuned resistive port.
Drivers: 8-inch (200-mm) woofer, 1-inch (25-mm) dome tweeter.
Frequency Range: On axis, 60 Hz to 20 kHz, ±2 dB: 30° off horizontal axis, 60 Hz to 15 kHz, ±2 dB.
Sensitivity: 88 dB SPL at 1 meter for 2 83 V rms input.
Crossover Frequency: 2.3 kHz.
Impedance: 8 ohms nominal.
Recommended Amplifier Power:
15 to 100 watts at 10% clipping.
Dimensions: 24 in. H x 10 1/2 in. W x 11 3/4 in. D (61 cm x 26.7 cm x 29.9 cm).
Weight: 55 lbs. (25 kg) per pair.
Price: $469 per pair.
Company Address: c/o AudioStream, P.O. Box 2410, Niagara Falls, N.Y. 14302.
"Paradigm (par' a dim), noun: Serving as an example or model of how something should be done." Thus start a number of ads for AudioStream, the American distributor of the Canadian "Paradigm" line of loudspeakers. This definition is a lofty goal indeed for a company to strive for in any product they make. This review describes the Paradigm Model 7se, a moderate-size, relatively low-cost, two-way vented system with an 8-inch woofer and 1-inch dome tweeter. Read on to find out how well the 7se matched the goal stated in the definition.
The 7se is the middle member of a line of 10 moderately priced two- and three-way systems from Paradigm Electronics. Paradigm, formed in 1982, is one of a number of Canadian manufacturers that have taken advantage of re search and test facilities made available by the Canadian government through its National Research Council (NRC).
The NRC is the Canadian equivalent of our National Bureau of Standards but with the added mandate of performing research that helps Canada be competitive in world markets. The research results are made freely available to anyone through a national information network, technical journal articles, and NRC research publications.
The NRC also provides facilities for hire that any company in the audio industry would be proud to call their own. These facilities include anechoic and reverberation chambers with sophisticated computer-controlled measurement equipment and an IEC (International Electrotechnical Commission) Standard listening room for conducting listening tests.
The NRC Acoustics Department is headed by Dr. Floyd Toole, who is well known in the U.S. audio community because of his involvement in the Audio Engineering Society and the Acoustical Society of America. Dr. Toole has written a number of AES papers describing the results of his research in the area of subjective loudspeaker testing and the correlation of a speaker's measured performance with listener preferences. (See "Testing at Canada's NRC" for more detailed information on the NRC and Dr. Toole's research.) Paradigm has drawn heavily on the work of Dr. Toole and the facilities of the NRC to optimize the 7se. The design objective was to come up with a moderately priced system that emphasized those loudspeaker design features which directly improve its subjective sound as verified by extensive double-blind listening tests.
==========
TESTING AT CANADA'S NRC
The National Research Council was established by the Canadian government in 1916 to promote scientific and industrial research that would help Canadian firms be competitive in Canadian and world markets. It now em ploys over 3,000 people at 11 locations and operates with a budget of over half a billion dollars.
The NRC maintains several world-class laboratories dedicated to pure and applied research in many diverse disciplines, including biotechnology, robotics, space sciences, advanced manufacturing, physics, and chemistry, among others. The NRC also develops and provides standards as an active part of national and international standards organizations and systems.
The NRC's heavy research emphasis and its mandate to provide technology and research information to private industry is paralleled by organizations in many other countries, including France, Great Britain, Germany, Japan, and Australia. The U.S., however, has no equivalent to the NRC's research-promoting activities.
Dr. Floyd Toole is a Senior Research Officer in the Acoustics and Mechanical Standards department in the NRC's Division of Physics. He heads the Sound Reproduction and Psychoacoustics project in the Acoustics section, where acoustic and subjective research has led to well-defined technical design requirements for loud speakers. Several Canadian loudspeaker manufacturers have taken advantage of the Division's know-how and facilities to design loudspeakers for both the consumer and professional audio markets.
Under Dr. Toole's direction, research was undertaken to determine the relationships between loudspeaker measurements and listener perceptions. The method used was that of identifying the perceived dimensions of sound and relating them to the corresponding technical attributes of the loudspeakers. In addition, extensive re search was done on the measurement and perception of resonances.
In the study, several different types of measurements were made on a relatively large number of domestic-style loudspeaker systems with forward-facing radiators.
These speakers were then auditioned by many listeners with normal hearing, and the resultant data was statistically analyzed to yield a perceived fidelity rating.
It was found that, among other measurable attributes, listeners "like the sound of loudspeakers with a flat, smooth wideband on-axis amplitude response that is maintained at substantial angles off axis" and loud speakers which "had phase responses that were smooth and only gently undulating in contour" (F. E. Toole, "Loudspeaker Measurements and Their Relationship to Listener Preferences: Parts 1 and 2," Journal of the Audio Engineering Society, April and May 1986).
High ratings were given to those systems that, in particular, had smooth midrange responses with no sharp peaks or dips. These local aberrations are indicators of both the presence and severity of resonances which may cause audible colorations. Dr. Toole goes on to point out the importance o' high-resolution free-field measurements with sufficient spatial averaging (not frequency averaging) to remove the visual clutter of acoustical interference effects on the measurements. Interested readers may order a collection of Dr. Toole's papers, entitled "Subjective and Objective Measurements of Loudspeaker Performance," for U.S. $3.75 (including postage) from the National Research Council, Div. of Physics, Ottawa, Ontario, Canada K1A OR6.
-D.B.K.
==========
Dr. Toole's research has found that experienced listeners prefer a loudspeaker that has wide bandwidth, flat and smooth amplitude response, and uniformly wide dispersion (again, see the sidebar for more details). These were just the areas concentrated on in designing the 7se.
The 7se is a rather conventional-looking, two-way vented system of modest appearance. The one striking feature is made evident when the grille is removed: The front panel is light gray and looks somewhat metallic in nature. The out side of the box is walnut vinyl covered with the 3/4-inch (19-mm) particle board used in all of this box's construction. An internal brace connects the front and rear of the box to minimize front and rear panel vibration. Good workmanship was evident throughout.
The rear is painted flat black and contains recessed, double-banana, five-way binding-post connectors. No tweeter level control is provided. (I personally don't like driver level controls because they change the system's frequency/time-directional characteristics in a nonlinear manner. It's best to change the tonal balance with a good line-level minimum-phase equalizer in the feed to the power amplifier.) The flush-mounted tweeter, woofer, and port are centered horizontally in the cabinet, with the tweeter over the woofer and the port below. The port is roughly 1.8 inches (48-mm) in diameter by 3 inches (76-mm) long and tunes the 1.2 cubic-foot (34-liter) box to approximately 35 Hz (see the "Measurements" section of this review).
Paradigm completely designs and manufactures their own woofer and midrange drivers, including all crossover networks. The tweeter is custom-manufactured for Paradigm by an unnamed European maker. The woofer has a die-cast aluminum frame with a forged, single-unit, back plate/pole-piece assembly. The cone is clear polypropylene with a butyl surround. A Kapton voice-coil former is used in the 1-inch (25.4-mm) diameter, long-excursion voice-coil.
The tweeter uses a 1-inch polyamide soft dome with ferro fluid cooling and damping. Both drivers have sizable ferrite magnet assemblies.
The internal passive crossover is of quasi-Butterworth design (in the manufacturer's words) with a second-order high-pass filter (shunt inductor and series capacitor) feeding the tweeter and a first-order filter (single inductor) feeding the woofer.
Measurements
Most of the measurements were made using the Techron TEF System 12 Plus analyzer, which uses the Time Delay Spectrometry (TDS) technique. The measurements were mostly done inside my employer's (Crown International) large microphone-production test facility, using elevated free-field measurements and near-field measurements.
Some of the tests were done outdoors, using ground-plane measurements.
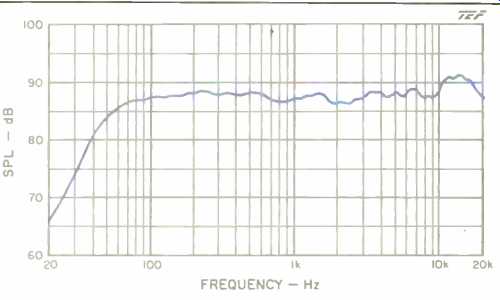
Fig. 1--One-meter on-axis frequency response, with an input of 2.83 V rms
(equivalent to 1 watt into the rated 8-ohm impedance).
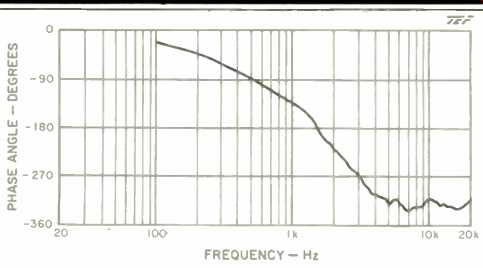
Fig.
2--One-meter on-axis phase response, with delay adjusted for the tweeter. An
additional 0.17 mS was required to achieve a flat phase curve in the woofer's
upper range.
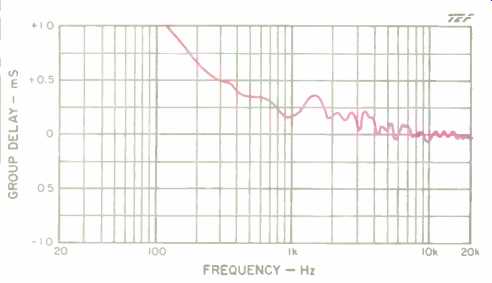
Fig. 3-Group delay corresponding to phase response of Fig. 2. The woofer lags
the tweeter by about 0.17 mS, an equivalent distance of 2.3 inches.
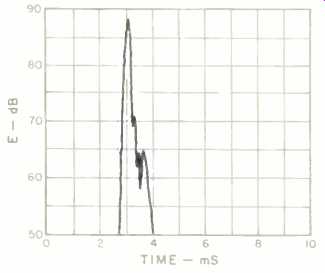
Fig. 4-One-meter on-axis ETC for test signal swept from 200 Hz to 10 kHz.
In this range, most of the response shown is from the tweeter.
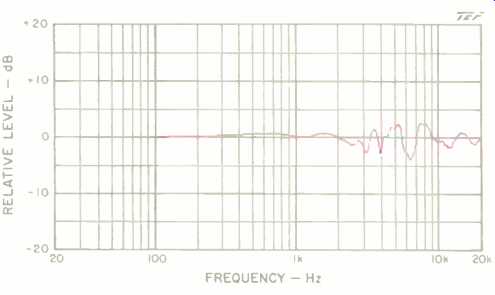
Fig. 5--Effect of grille on axial 1-meter frequency response. (The graph is
normalized to show only differences from grille-off response of Fig. 1.) The
grille adds fairly severe response aberrations in the range from 3 to 10 kHz.

Fig. 6--Horizontal off-axis response plots taken from the left side, around
the front, to the right side of the system. Note that frequencies are shown
on a log scale and that all curves are normalized to show differences from
the on-axis response.
Fig. 7--Vertical off-axis plots taken from above to below the system. Note log frequency scale and normalization of all curves to the on-axis response. Also note crossover response irregularities between 1.5 and 3 kHz, at roughly 20° to 40° off axis up and down.
The system's on-axis frequency response was measured at a distance of two meters, directly on axis of the tweeter.
The input level was 2.83 V rms, which corresponds to a level of 1 watt into 8 ohms. The on-axis response was corrected to the standard distance of 1 meter for display of the data.
The parameters of the measurement were set so that the data was essentially smoothed with a tenth-octave filter.
Figure 1 shows the on-axis 1-watt, 1-meter frequency response of the 7se with the grille off. The speaker exhibits a commendably flat response ( ± 2 dB) from roughly 60 Hz to 10 kHz, with a moderate rise of about 4 dB covering roughly two-thirds of an octave between 10 and 16 kHz. In the important bass-midrange region between 100 Hz and 1 kHz, the system is even flatter, staying within about ± 1 dB.
This measurement reveals a sensitivity of approximately 87.5 dB SPL over the range from 100 Hz to 10 kHz, which essentially confirms the manufacturer's rating. A separate test, comparing the axial response of both the right and left speakers, yielded a commendable match of ±0.5 dB over the frequency range from 50 Hz to 15 kHz.
Note that this on-axis frequency response represents a free-space measurement taken without the effects of any reflective boundaries. It represents essentially the frequency spectrum of the first arrivals you hear when listening to the system in its normal listening environment. The balance between low and high frequencies will change when the system is placed near reflective boundaries in an actual listening situation.
Figure 2 shows the on-axis phase response of the system, corrected for the time arrival of the tweeter. Figure 3 shows k the related group delay versus frequency for the phase curve of Fig. 2. This group delay indicates that the woofer follows the tweeter by about 0.17 mS (170 µ.S), which corresponds to a relatively low offset distance of 2.3 inches (58 mm). At the crossover (2.3 kHz), this offset represents approximately 0.4 wavelengths, or 140° of phase. Although this is not a linear-phase system, most available research indicates that this amount of mid-high frequency all-pass (flat frequency response) delay is not readily audible. The increase in delay below 500 Hz is due to the normal mini mum-phase delay caused by the high-pass characteristic of the speaker's low-frequency response.
The 1-meter on-axis energy/time response (ETC) is shown in Fig. 4 for a test signal swept over the range of 200 Hz to 10 kHz. In general, the ETC looks good, except for a broadening of the response at levels greater than 20 dB below the first arrival peak. Be aware that this ETC represents essentially the tweeter's response only, due to the specific frequency range swept.
Figure 5 reveals the grille's effect on the on-axis frequency response. The grille produces moderate frequency response anomalies of about ± 3 dB in the range above 2 kHz. I suggest removing the grille for serious listening; most of my own listening was done with the grille off.
The system's off-axis frequency response was measured in two different ways. The first method displays the data in a three-dimensional format similar to the one seen in Audio equipment reviews for the last few years. The second method essentially follows the way the on- and off-axis response curves were measured and derived at the Canadian NRC's test facilities, which were used extensively in the design and development of the 7se.
Figures 6 and 7, respectively, show the 3-0 horizontal and vertical off-axis frequency response curves of the 7se in the frontal hemisphere. These curves were derived from frequency-response measurements made at 5° increments along the major horizontal and vertical planes in the front of the system. No additional smoothing was done on these curves except for the fairly high resolution, 200-Hz, constant-bandwidth smoothing that results from the TDS data-gathering process.
Note that these plots differ from the usual Audio format, in that the frequency scale is logarithmic rather than linear and that all curves have been referenced (normalized) to the on-axis frequency response. The on-axis response curve in each of the displays is easy to find because it is a straight line. The normalized format is beneficial in that it clearly depicts the differences between the on- and off-axis curves.
The same display would result if the system's on-axis frequency response were carefully equalized flat over the range from 200 Hz to 20 kHz.
The 3-D horizontal off-axis curves in Fig. 6 indicate a fairly well behaved off-axis response, with extension up to 10 kHz out to about 30° off axis. Beyond 10 kHz, the response rolls off quite rapidly with increasing off-axis angle. The response ripple which appears in many of the off-axis curves above 4 kHz is actually a localized aberration of the near on-axis response. The normalization of the response curves displaces this ripple to the off-axis curves, making it more noticeable than if normalization were not used.
The vertical off-axis curves in Fig. 7 denote clearly the effects of the crossover in the domain from 1.5 to 3.5 kHz. Off-axis null regions exist at angles about 30° up and down.
The 6.5-inch (165-mm) center-to-center separation of the tweeter and woofer corresponds to about 1.1 wavelengths at the 2.3-kHz crossover frequency. The symmetrical up and down positions of the vertical off-axis nulls indicate that the woofer and tweeter are approximately acoustically in phase throughout the important crossover frequency area.
This very desirable behavior minimizes the "lobing error" of the system. An independent confirmation of the driver acoustic phasing was done by running a response curve on the system with the connections of the tweeter reversed.
This resulted in a sharp 15-dB dip in the frequency response at the 2.3-kHz crossover frequency.
The curves also show that the response is significantly rougher off axis vertically than horizontally. I suggest listening to the system no farther than about 10° vertically off axis, for best results.
Figures 8 and 9, respectively, show the mean horizontal and vertical on- and off-axis response curves of the system, measured and derived in the manner of the NRC tests.
These response curves were derived from the previous 3-D data by calculating response averages of several adjacent curves in specific on- and off-axis angular regions. This spatial averaging, rather than frequency averaging or smoothing, tends to suppress the effects of localized response aberrations due to diffractive effects, without minimizing overall frequency response problems exhibited over broad angles. The mean axial response was calculated by averaging all the individual responses in a ± 15° window, both horizontally and vertically. The mean off-axis responses were computed separately, in both the horizontal and vertical directions, from the ±30° to ±45° and the ±60° to ± 75° off-axis curves.
The mean horizontal response curves are shown in Fig. 8. The mean axial response curve is quite flat and extended, within a ±2 dB envelope out to 19 kHz. Surprisingly, except for a roll-off above 10 kHz, the off-axis curves over the range from 800 Hz to about 11 kHz are actually flatter than the on-axis curve. This smooth, wide-angle response trait implies that the 7se speakers should image quite well over a broad horizontal listening area.
The mean vertical responses are shown in Fig. 9. These curves are somewhat similar to the horizontal curves, except for a 2-kHz, octave-wide hole in the response at the crossover frequency in the 30° to 45° angle range.
Figure 10 shows the input impedance of the 7se, plotted over the range from 20 Hz to 20 kHz, with a logarithmic vertical scale covering 1 to 100 ohms. A minimum impedance of 5 ohms at 150 Hz and a maximum of 28 ohms at 1.5 kHz were measured in the operating range of the speakers.
Though this system is rated at 8 ohms, the 5-ohm minimum reached in the upper bass range makes paralleling two sets of these speakers a possible hazard for some amplifiers especially at high levels.

Fig. 8--Mean horizontal on- and off-axis frequency response curves above 200
Hz; see text. Top curve is mean on-axis curve, an average of response measurements
made within ± 15° of vertical and horizontal axes. Middle curve is average
of measurements between 30' and 45° either side of axis; bottom curve is average
of measurements 60° to 75° either side of axis. Note the very smooth off-axis
response, even at angles out to ± 75°.
Fig. 9--Mean vertical on-and off-axis frequency response curves. Top curve is mean on-axis curve, an average of response measurements made within ± 15' of vertical and horizontal axes. Middle curve is average of measurements between 30° and 45° above and below axis; bottom curve is average of measurements 60° to 75° above and below axis. Note the off-axis response dips in the crossover region (1.5 to 2.5 kHz); see text.
The double-humped impedance characteristic of the vented-box (bass-reflex) cabinet was apparent at low frequencies. The Helmholtz-resonance tuning frequency of the box occurs at the impedance dip--about 32 Hz. At this frequency, most of the acoustic energy is radiated by the port, with the displacement of the woofer cone minimized.
The complex magnitude-phase (Nyquist) polar plot of the impedance is shown in Fig. 11. The curve nicely rotates clockwise with increasing frequency, which it ought to, as pointed out by the late Richard Heyser, Audio's former senior loudspeaker reviewer. The polar curve is quite well behaved, with no minor loops exhibited; this indicates that there are no spurious higher order resonances in the cabinet or woofer moving system. When looking at polar impedance plots, remember that simple second-order resonant humps show up as circles on the display. The circular, looping nature of the three impedance humps is clearly shown in the plot.
The distortion characteristics of the 7se were measured in several different ways. These included three single-frequency distortion spectra versus power level, IM distortion versus power level, and swept second- and third-harmonic distortion measurements versus frequency.
Figures 12, 13, and 14, respectively, show the single-frequency harmonic-distortion spectra versus power level at the musical notes E1 (41.2 Hz), A2 (110 Hz), and A4 (440 Hz). These curves indicate how much harmonic distortion is generated by the system with the application of a single-frequency sine wave at power levels covering the range of 0.1 to 50 watts (- 10 to + 17 dBw, a 27-dB dynamic range).
The power levels were computed assuming the rated impedance of 8 ohms. The curves show the second to fifth harmonics of the input sine wave-except at E1 (41.2 Hz), where the sixth harmonic is also shown.
The curves were run by successively increasing the sinewave input level in 1-dB increments (each step about 26% higher in power than the previous level). At each power level, a swept spectrum analysis was done over a frequency range covering the desired harmonics. Two precision, 1-dB-per-step attenuators were used in the setup-one in the send path and one in the receive path-to ensure that the power level steps were accurate. The receive attenuator provides a constant fundamental level to the spectrum analyzer so that distortion percentages can be read directly from the plotted data scales.
Figure 12 shows the E1 (41.2-Hz) harmonic data. Data collection was stopped at a power level of 50 watts (20 V rms into the rated 8-ohm impedance) because the distortion levels were getting excessive (35% third harmonic at 50 watts). The actual power accepted at this voltage and power level was about 70 watts, due to the measured 6-ohm impedance. At most power levels, the third harmonic was found to predominate. At this frequency, most of the distortion was generated by the high excursion of the system's woofer. Third-harmonic distortion is generated from a sym metrical nonlinearity, which, in this situation, corresponds to the woofer's running out of excursion capability in both directions equally. The distortion levels reached in this El test, although quite high, are not unreasonable for an 8-inch (200-mm) woofer when it is operated at these fairly high acoustic levels.
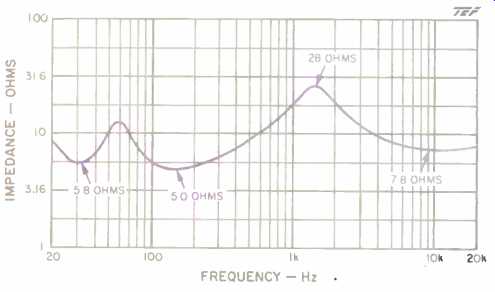
Fig. 10--Magnitude of impedance. Note the logarithmic impedance scale.
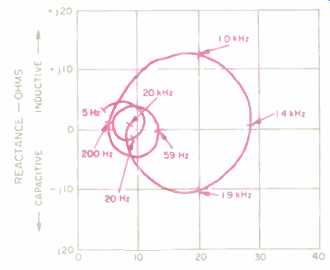
Fig. 11--Complex impedance.
The system is quite well behaved; see text.
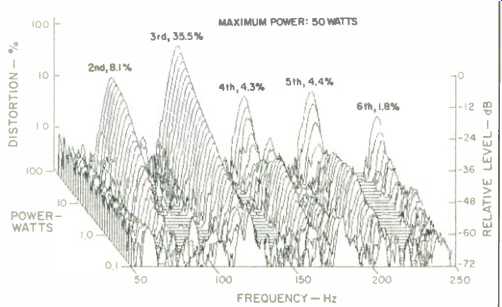
Fig. 12--Harmonic distortion for the musical tone E1 (41.2 Hz). Note relatively
high third-harmonic level at high powers; see text.
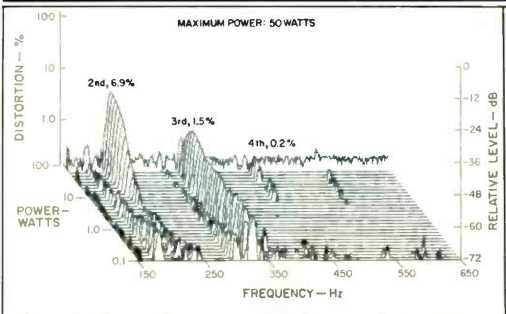
Fig. 13--Harmonic distortion for the musical tone A2 (110 Hz). The second
and third harmonics were the only significant ones in this power range. Note
the rapid increase in second harmonic at power levels above 10 watts; see text.
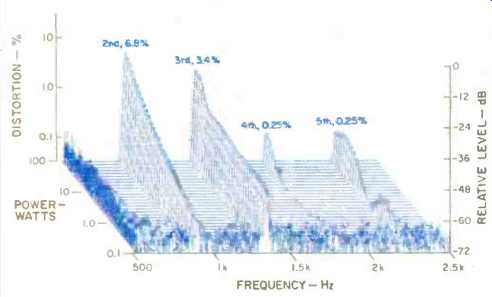
Fig. 14--Harmonic distortion for the musical tone A4 (440 Hz). Only moderate
amounts of second and third harmonics are evident.
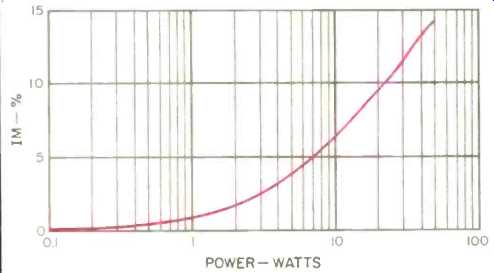
Fig. 15--IM produced by mixing A4 and E1 in equal proportion.
The 7se speaker's vented-box tuning provided only a moderate amount of cone-excursion reduction at 41.2 Hz.
This was due primarily to two factors. First, the test frequency did not coincide with the box resonance frequency of the vented enclosure; at the box resonance frequency, the loading of the tuned box provides the maximum cone-motion reduction. Second, the 0 factor of the vented box was not very high, which limited the amount of reduction available.
As stated previously, the manufacturer describes the 7se loudspeaker's vented-box enclosure as having a "critically tuned resistive port." In the context of the 7se, this means that a relatively large amount of damping material was used inside the box (none was found in the port). This increases the internal box losses and, hence, decreases the box Q.
Considering only low-frequency behavior, the vented-box enclosure works best with a minimal amount of internal damping material. However, in the case of the 7se, a two way design, the low-frequency loudspeaker is used all the way up into the midrange. In this range, standing waves and reflections inside the box can potentially color the midrange reproduction through radiation or re-radiation via the port and cone. Using a relatively large amount of damping material inside the enclosure will decrease the effect of these internal waves and. hence, their effect on the midrange response. In most vented-box enclosure designs, deciding how much damping material to add to the inside of the box involves a real engineering trade-off. It is quite clear that the designers of the 7se put more weight on smooth midrange response than on attempting to achieve the absolute lowest low-frequency distortion.
Even though this system's enclosure Q was somewhat lower than it could have been, separate tests revealed that this vented-box enclosure provided a very usable reduction of cone motion in the frequency range from 23 to 58 Hz. In the range from 30 to 40 Hz, the reduction was approximately 50%. This test was accomplished by alternately covering and uncovering the port while driving the system with a 10-to 20-V rms sine-wave signal. Above 10 V rms (12 watts), in the range from 30 to 40 Hz, windage (air movement) noises were quite noticeable from the port. This type of noise is usually not very audible with normal wide-range program material.
The A2 (110-Hz) harmonic data is given in Fig. 13. The data essentially shows that only the second and third harmonics were significant. The non-harmonically related spikes in the graph are byproducts of the measurement setup environment and are not generated by the loudspeaker. The third harmonic was found to increase gradually with power level, reaching only 1.5% at 50 watts. The second harmonic was very low, up to a power level of about 10 watts where it quickly increased to 7% at 50 watts. The significance of this sharp increase in second-harmonic distortion just about slipped by me until I removed the system's woofer and ran an excursion test or it.
Second-harmonic distortion is caused by a one-sided, asymmetrical nonlinearity. The specific cause of this nonlinearity in the 7se speaker's woofer was found to be an effect that occurs quite commonly in long-excursion, overhung-motor (voice-coil longer than top-plate thickness) woofers.
The effect is called "dynamic offset," "oil canning," or some times "self-rectification" (see "The Oil-Can Effect"). It occurs only in specific low-frequency ranges where the motional impedance (back EMF due to the movement of the voice-coil/cone assembly) is a significant part of the total impedance and only where the impedance is falling rapidly with increasing frequency.
The effect causes the cone to actually displace outward or inward at high drive levels. In the case of the 7se woofer, the cone always moved out of the motor assembly in the range from 50 to 115 Hz, at drive levels above approximately 12 V rms (10 watts). At 20 V rms (50 watts) at 100 Hz, the net outward displacement actually exceeded the peak-to-peak alternating displacement. This sudden outward shift in cone displacement caused the sudden increase in second- harmonic distortion exhibited in Fig. 13. Research has shown that dynamic offset also increases transient distortion and hangover for short-term, low-frequency signals. Re search also indicates that vented-box (bass-reflex) systems are more susceptible to transient distortion from dynamic-offset effects than are closed-box (acoustic-suspension) systems.
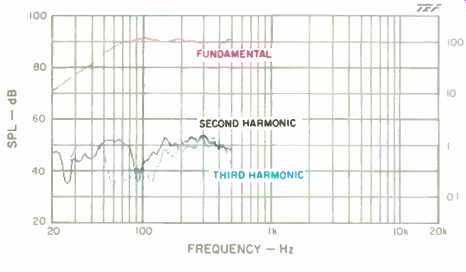
Fig. 16-Second- and third-harmonic distortion levels vs. frequency for 90
dB SPL mid-band output at 1 meter on axis; input signal is 3.6 V rms (1.6 watts
into 8 ohms).
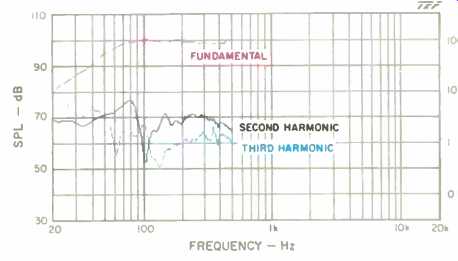
Fig. 17--Same as Fig. 16 but for 100 dB SPL mid-band output, using input signal
of 11.3 V rms (16 watts into 8 ohms).
Figure 14 shows the A4 (440-Hz) harmonic measurements. Again, the predominant distortion is a moderate amount of second- and third- with only small amounts of fourth- and fifth-harmonic distortion. The third-harmonic distortion is seen to stay at roughly the same distortion percent age, a low 1%, over a fairly broad range of input powers.
Figure 15 shows the IM distortion on a 440-Hz (A4) tone created by an equal-level (input power, not output acoustic level) 41.2-Hz (E1) tone. Again, power levels in the range from 0.1 to 50 watts were measured. The IM distortion gradually rises with power, reaching a level of about 10% at 20 watts and 14% at 50 watts. Only intermodulation products out to the third order (f2 ± 3f1) were significant in these measurements. These IM levels are fairly low for a woofer of this size at these power levels. At 440 Hz, 50 watts generates a respectable 105 dB SPL at 1 meter, measured on the system's axis.
Swept sine-wave second- and third-harmonic distortion tests were also made on the system at axial 1-meter levels of 90 and 100 dB SPL (Figs. 16 and 17). The purpose of running these curves, in addition to the previous measurements, was to show the harmonic content at a fixed-output mid-band sound pressure level and to display the second- and third-harmonic levels over a continuous interval in the low-frequency range. Using fixed sound levels of 90 and 100 dB SPL facilitates comparison with measurements made on previous systems. Note that in the low-frequency range below 60 Hz, where the system starts to roll off, the actual distortion percentage is higher than shown on the scale fo me right of the graph because the fundamental is lower in level.
The swept harmonic tests at a level of 90 dB SPL are shown in Fig. 16. The distortion stayed below 2% at frequencies above 60 Hz and rose to about 5% at 35 Hz (mostly third harmonic). The corresponding measurements at 100 dB SPL are plotted in Fig. 17. The distortion above 60 Hz stays below 3% except for a second-harmonic peak of 8% at 85 Hz. The input level of 16 watts (11.3 V rms), required for the 100-dB midband level, is just below the point where the cone starts to move out due to the dynamic-offset effects noted earlier. The second harmonic is seen to pre dominate between 50 and 90 Hz. At 20 Hz, third-harmonic distortion actually rises to 100%, primarily due to the suspension's running out of excursion capability to the same degree in both directions.
Overall, the distortion measurements on the 7se are quite low for a system of this size. The windage noises in the vent at high power levels in the low-frequency range will fortunately be masked by most program material. The dynamic-offset problems observed could potentially be a problem with program material such as loud rock music, which contains high-power narrow-band material in the region of 50 to 100 Hz. However, the added second-harmonic levels may make some types of program material sound better rather than worse. (It ain't high fidelity though!) Figures 18 and 19 show the short-term peak-power input and output capabilities of the system, plotted as a function of frequency. The tests were run by applying a shaped tone-burst test signal consisting of 6 1/2 cycles of a sine wave shaped using a Hamming raised-cosine envelope. The resultant test signal covers a one-third-octave bandwidth with a time duration that increases as the frequency goes down.
The burst is presented at such a low duty cycle that the long-term thermal characteristics of the speaker under test are not exercised. The test consisted of evaluating the maximum peak-input power-handling capacity and maxi mum peak-output sound pressure levels, at all the one-third-octave center frequencies, in the range from 20 Hz to 20 kHz. A very powerful amplifier that can generate 5,500 peak watts ( + 37 dBW, or ±210 V into an 8-ohm load!) was used to drive the system.
The test sequence began with determining how much of the special test signal could be handled by the speaker, at each frequency, before either the output sounded audibly distorted or the acoustic output waveform appeared distorted, whichever occurred first. At each frequency, the maxi mum peak-input voltage and the corresponding generated peak-output sound pressure level at 1 meter were recorded.
Figure 18 shows the maximum peak-input electrical power-handling capacity of the 7se. The peak-input power-handling capacity is seen to rise with frequency until 6.3 kHz, where the amplifier's power capacity of 5.5 kilowatts was reached! Above 125 Hz, the system can handle more than 600 peak watts. From 40 to 100 Hz, the peak power handling is limited to the range of 50 to 100 watts. Below 25 Hz, the power should be limited to 10 watts or less, so as not to cause any intermodulation of the higher frequencies. The 7se can actually handle more power than the curves show but at the expense of much greater distortion.
Figure 19 illustrates the maximum peak sound pressure levels generated at a distance of 1 meter on axis for the levels shown in Fig. 18. The graph shows that the 7se can generate very respectable levels in excess of 110 dB SPL at frequencies above 100 Hz. Between 20 and 100 Hz, the maximum output rises at about 15 dB per octave. Of course, two of these systems operating in a typical listening room will be able to generate much higher levels in this critical low-frequency range, due to mutual coupling and boundary effects. The room will provide some 5 to 10 dB of low-frequency gain, while a pair of speakers increases the level some 3 to 6 dB.
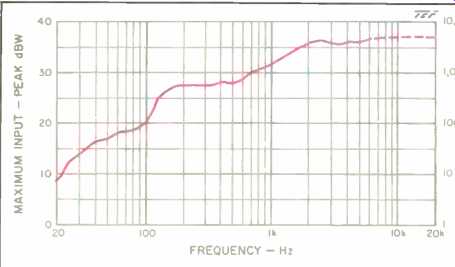
Fig. 18--Maximum peak-input power for moderately clean output.
Above about 6 kHz (dashed portion of curve), limitations are imposed by clipping of 5.5-kilowatt amplifier, not by the speaker. Input signal was a shaped tone burst; see text.
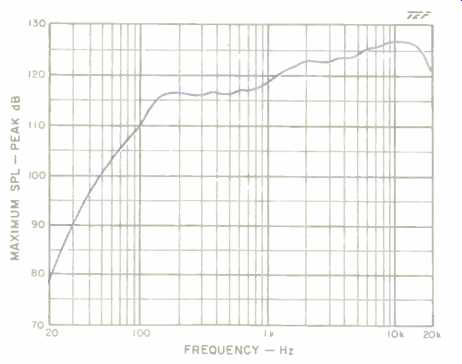
Fig. 19--Maximum peak SPL output at 1 meter, on axis, for input levels shown
in Fig. 18. The system can generate peak levels in excess of 115 dB SPL above
150 Hz.
===================
THE OIL-CAN EFFECT
Dynamic offset is a nonlinear effect exhibited by drivers having a long-throw voice-coil moving assembly coupled with a very linear suspension system. The effect comes about because the magnetic field decreases as the voice-coil moves out of the magnetic gap. At points where the motional impedance is falling with increasing frequency (the upper slope of impedance peaks), the phase relationships are such that the cone tends to speed up as it leaves the gap. This is because the magnetic field weakens as the cone moves out of the gap, which reduces the back EMF generated by the voice-coil's motion; on this slope of the impedance peak, the reduced motional impedance causes the speaker to draw more current, raising its speed.
For those who may have taken a class on d.c. electric motors, the effect is very similar to the speed of a d.c. motor increasing (not decreasing, as you might predict!) when the current through the field winding is decreased.
For constant-voltage drive, the motor has to increase its speed of rotation so that the back EMF again roughly equals the voltage applied to the rotor. The back EMF generated by the rotor is directly proportional to the product of the speed of rotation and the strength of the magnetic field generated by the field coil. As the field current decreases, thus decreasing the magnetic field strength, the motor has to go faster in order to maintain its equilibrium.
The dynamic-offset problem in woofers can be minimized by designing the suspension system to actually push back more with increasing displacement than a perfectly linear suspension would. This added suspension nonlinearity compensates for the nonlinearity of the magnetic field. DBK.
============
Use and Listening Tests
The listening tests were conducted in my basement listening room, which is somewhat small with a volume of about 1,500 cubic feet (43 cubic meters). The systems were located 20 inches (0.5 m) away from the rear wall and separated by about 8 feet (2.5 m), with most near reflective objects removed. The 7se speakers were placed on the supplied stands, which elevated them about 13 inches (0.33 m) off the floor, placing the tweeter 33 inches (0.84 m) high. At my seated listening position, my ears were within 2° of the tweeter axis. Most of my listening evaluation was done before the measurements were made.
My first listening impressions of the 7se were quite positive. I was impressed with how well the system did overall, in comparison to my reference. Later, more serious, evaluations did not change this impression. My listening tests conducted after the measurements revealed no perceptible changes in the sound, even though by then the system had been subjected to some rather abusive power testing! The supplied speaker stands were made of 1/8-inch (3-mm) thick metal sheet stock, with 1-inch (25-mm) long spikes on the bottom of a 13 1/2-inch (340-mm) square base.
The 10-inch (250-mm) square speaker mounting surface was separated from the base by four 1-inch (25-mm) square by 12-inch (305-mm) long metal tubes. My initial impression of the stands was somewhat negative, due to some high-Q resonances in the metal structure. After the speakers were set up in the normal configuration, with the systems in place and the base (with spikes) on the carpet, the resonances were much diminished and did not cause any discernible effects during the listening tests.
Input connection was made at the rear of the system, through double-banana red/black, five-way binding posts separated by the standard 3/4-inch (19-mm) distance.
However, the wire insertion hole in the post was not large enough to handle any reasonable-sized stranded speaker cable. I suggest that you use spade lugs or solid wire extensions (that will fit the hole) and solder these to your cables.
Listening to some pop/rock material (The Nightfly, Donald Fagen, Warner Bros. 23696-2) revealed a somewhat bright high end that emphasized instruments such as top-hat cymbal and tambourine. The emphasis was not at all objection able, however.
Reproduction of female vocalists was quite realistic, with no sign of harshness on vocal peaks (Love Songs, soprano Arleen Auger and pianist Dalton Baldwin, Delos DCD-3029). The reproduction of male vocalists with acoustic guitar was also quite good, with no upper-bass or lower-midrange tubbiness (Folk Era's Live Sampler, Folk Era FE2066CD and Depth of Image, Opus 3 Test Record 1, Track 7).
A capella choral music was also reproduced well, with good clarity and vocal separation (Depth of Image, Track 10). Smooth response through the upper-bass and mid range response regions is required for good results on choral music. Mozart's Piano Concerto No. 13 (Midsummer Mozart Festival, Bainbridge BCD-6273) was reproduced with a good sense of space and realism.
Off-axis vertical and horizontal high-frequency coverage was subjectively quite adequate, with good response out to about ± 40°. The system's delivery of high-level mid-high frequency transients, such as explosive sound effects, was very effective. (You can clean your ears out on Track 4 of Ein Straussfest, Telarc CD-80098!) Program material containing high-level bass transients played at high levels, such as rock kick drum, was reproduced with a moderate amount of muddiness when compared to my reference system (Sheffield Drum and Track Record, Sheffield Labs). After making the measurements, I attributed this muddiness to the dynamic-offset problems exhibited by the woofer in the 7se. To check this out, I searched for program material containing low-frequency information that would cause the cone assembly to travel appreciably out of the gap, in one direction, on loud pas sages. (This movement was determined by viewing the cone at close range while playing the material.) One disc that did this consistently contained the cannons on Beethoven's " Wellington's Victory" (Telarc CD-80079). An outward deflection of the cone resulted even when the speaker leads were reversed, because dynamic-offset problems relate only to the amplitude, not the polarity, of the low-frequency signal. Even with appreciable offset, the cannon reproduction was still quite impressive. (I made sure my wife was out of the house when I listened at the levels required to generate the offset effects!) Reproduction of other types of low-end material, such as pipe organ pedal tones and concert bass drum, was quite adequate and was consistent with the system's size.
To sum up, I am quite pleased with the overall performance attained by these speakers, considering their relatively low price and moderate size. The smooth bass-midrange response contributed to a very accurate and revealing system that was a pleasure to listen to. Except for some low-end muddiness exhibited infrequently on very high level bass passages, the system did a very good job. I would recommend the 7se loudspeakers for anyone who wants a very cost-effective speaker for use as a main system or for use in a secondary situation. At their price, in fact, I might even consider buying a pair for myself.
-D. B. Keele, Jr.
(Audio magazine, Sept. 1989)
Also see:
All About Paradigm Loudspeakers (April 1999)