BY RUSH W. HOOD
Find out how well your weatherproofing and insulation work Large amounts of money are being spent by homeowners today on insulation, storm windows and other means of reducing energy use and cost for heating homes. Gauging the effectiveness of these improvements, however, often re quires months or even years of tabulations. Data garnered from supplier bills are often misleading owing to changing weather conditions that directly affect the amount of energy needed to maintain a desired temperature. The degree day meter described here will allow you to compensate for changing weather and assess the true efficiency of your home's added weatherproofing. Moreover, using this device, only a day or two of observation will be needed to determine the effect of any improvement in insulation you have made.
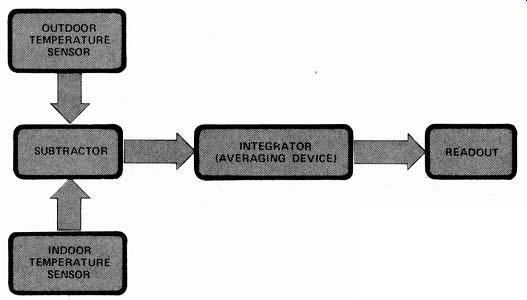
Fig. 1. To determine degree-days, the indoor and outdoor sensors measure
temperatures and convert them to voltages, which are subtracted, integrated
(averaged) and applied to readout.
Theory of Heat Flow. Were your home perfectly insulated, it would maintain a constant temperature without drawing on a source of additional energy. The temperature of an object is a function of the heat energy it contains, and cannot change without an inward or outward flow of energy. Unless artificial means (e.g. refrigeration) are used, heat always flows from a warmer reservoir to a cooler one, and at a rate proportional to the difference in temperature.
Insulation impedes the flow of heat between the two reservoirs. The situation is analogous to the flow of current in an electric circuit. The temperature difference, T_high- T10, is equivalent to voltage; heat flow, Q, to current; and insulation value, R, to resistance. Thus, s the equation Q = (T_high –T_low) /R resembles Ohm's law.
If the temperatures inside and outside your home were constant for a long period of time, you could simply measure the temperature difference and the rate of energy use by reading the gas or electric meter and calculate the average insulation value of your building. Because the temperature of the outside air changes too rapidly to allow such procedure, the degree-day was devised.
A degree-day is computed from temperature readings taken at frequent, regular intervals throughout the day.
These readings are subtracted from a reference temperature, usually 68° F, and the differences are averaged over one day. If a day is reported to have had 15 degree-days, for example, the energy needed to heat your home would have been the same as if outside had been 15 degrees cooler than inside all day.
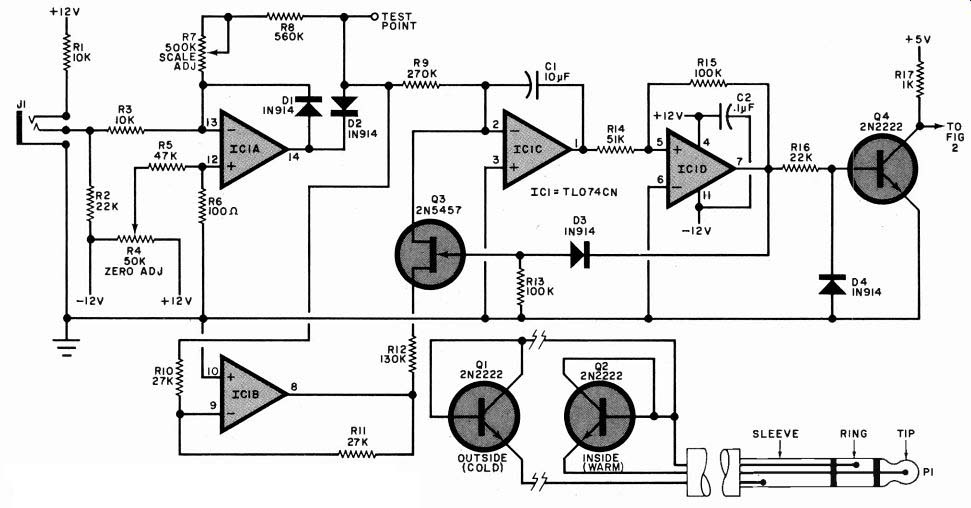
Fig.2. Circuit composed of IC1 and Q3 is a vco whose frequency varies
with temperature.
PARTS LIST
C1-10-µF,25-V Mylar or polyester capacitor C2-0.1-µF ceramic capacitor C3-1000-µF, 25-V electrolytic C4- 100-µF, 25-V electrolytic C5,C6-0.33-µF, 25-V tantalum capacitor D1 through D4- 1N914 D5,D6-1N4001 1-A, 50-V rectifier DISP1, DISP2, DISP3-Common-anode display (MAN4610 or similar) F1- 1-A, fast-blow fuse IC1-TL074CN quad BIFET op amp 1C2-74LS93 binary counter IC3, IC4,IC5-74LS90 BCD counter IC6, IC7,1C8-74LS47 BCD-to-seven segment decoder IC9-7812 + 12-V regulator IC10-7805 +5-V regulator IC11-7912-12-V regulator 41-Open-circuit stereo phone jack P1-Stereo phone plug Q1,Q2,Q4,Q5-2N2222 transistor Q3-2N5457 FET transistor (Radio Shack 276-2028)
The following are 1/4-W, 5 % carbon resistors unless otherwise noted:
R1,R3 10 k-O
R2,R16-22 k-O
R4-50 k-O trimmer potentiometer
R5-47 k-O
R6-100 Ohm
R7-500 k-O trimmer potentiometer
R8-560 k-O
R9-270 k-O
R10, R11-27 k-O
R12-130 k-O
R13, R15-100 k-O
R14--51 k-O
R17,R18--1 k-O
R 19--4.7 k-O
R20 through R41-1.2 k-O
S1-Spst normally open pushbutton switch
T1- 12.6-V, 1-A transformer
Misc.-Aluminum enclosure, printed circuit or perforated board, IC sockets, red plastic for display window, line cord and plug, strain relief, etc.
Note: The following is available from HLW, P.O. Box 1026, Beaverton, OR 97075: complete kit of parts for $97.50, plus $3.50, postage and handling. Also available from the same source is an etched and drilled printed circuit board for $9.00.
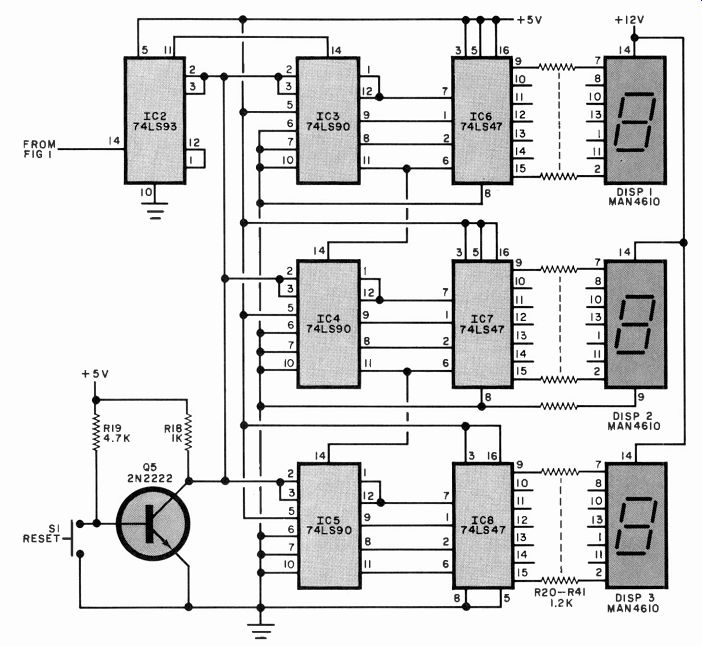
Fig. 3. Other than the divide-by-16 counter (IC2), digital circuit is
conventional 3-digit counter, decoder and display.
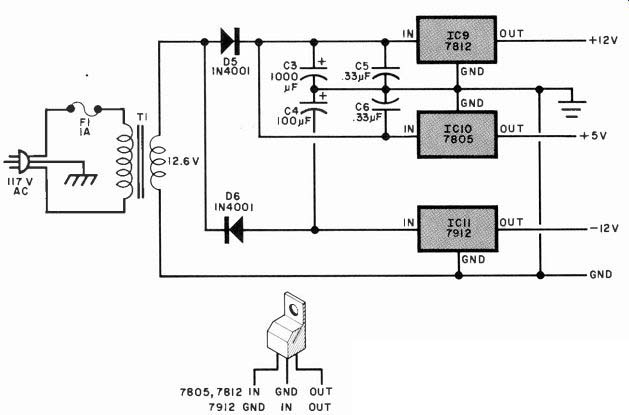
Fig. 4. The three voltage sources are derived from regulators. Note
the pin-out differences between the ICs.
Degree-days reported by your local weather service can be useful, but they may not be sufficiently accurate for critical measurements. Your inside temperature may not be the standard 68 degrees, and may vary through a 24-hour period. This degree-day meter project calculates the degree-days from the temperatures inside and outside your particular home.
How it Works. The meter continuously senses the indoor and outdoor temperatures, subtracts them and integrates the difference. Analog and digital circuit techniques are used to maintain the integration accuracy over long periods of time and to provide a numerical read out. The block diagram in Fig. 1 summarizes, in an easy-to-follow method, the device's operation.
Circuit Design. The subtracting and integrating circuits are shown in Fig. 2. Indoor and outdoor temperatures are sensed by silicon transistors Q1 and Q2, which are connected as diodes. A constant current passing through a silicon diode junction develops a voltage drop that varies approximately linearly with temperature at a rate of 1.2 mV/ *F.
The two sensors are connected in series opposition, so that the voltages across them are subtracted. The difference voltage taken from the junction of the two transistors is proportional to the difference between the two temperatures.
Integrated circuit IC1A supplies enough gain to boost the difference signal so that it varies at a rate of 100 mV/° F. It also acts as a half-wave rectifier, making the meter insensitive to situations in which the outside temperature exceeds the inside temperature, which could happen on sunny days. Sections, B, C, and D of IC1 and FET Q3 with its associated components form a voltage-controlled oscillator (VCO) whose aver age output frequency is 160 cycles per degree-day. The output of IC1 A is coupled to the inverting (-) input of integrator IC1C (which averages the signal) via R9 and to inverter IC1B through R10. The output of IC1B is coupled through R12 and FET switch Q3 directly to the inverting input of IC1C. When Q3 is turned on, its drain-to-source channel resistance, coupled with R12, is one-half the value of R9 and the IC1B signal to IC1C is twice that from R9 and is of the opposite polarity. Thus, the integrator is fed with either a plus or minus 100-mV/°F signal depending on the state of switch Q3. A negative volt age applied to the gate of Q3 turns the transistor off.
The integrator output is coupled to comparator IC1D, which has a hysteresis of 10 volts. The output of IC1D at pin 7 is either +10 V or -10 V depending on the polarity of the input signal with respect to ground. This output is coupled to the gate of Q3 through diode D3.
Assume that the integrator is developing a positive-going ramp at its output.
When this reaches the trigger voltage of the comparator, the latter rapidly switches to its maximum positive out put, which reverse biases D3. This turns Q3 on and routes the inverted signal to the integrator, which now develops a negative-going ramp until the comparator switches to its maximum negative output. This turns off Q3, and the cycle is repeated.
The output of comparator ICID is converted into a TTL-level signal by Q4.
Diode D4 is used to limit the negative-going signal to the base of Q4, while R16 is the base-current limiting resistor.
The TTL signal is used to drive the conventional 3-digit counter, decoder and display shown in Fig. 3.
The 160 cycles per degree day output from Q4 is divided by 16 in IC2 to pro vide a square wave having one cycle per tenth of a degree day. This signal is coupled to pin 14 of LSB counter IC3. Zero set is provided by depressing RESET pushbutton S1 which places a ground on pins 2 and 3 (reset to zero) of the four counting ICs. Note that DISP2 has its decimal point (pin 9) permanently activated by a resistor to ground.
The power supply, shown in Fig. 4, provides +5 volts for the TTL logic, ± 12 volts for the analog circuit, and +12 volts for the seven-segment common-anode readouts. Be sure to observe the pin-out difference between the regulator ICs.
Construction. The meter can be constructed using the foil pattern shown in Fig. 5, or perforated board and Wire-Wrap techniques. If you design your own layout, arrange it so that the digital portion-especially IC6, IC7 and IC8 are along one long edge. In this way, the three-digit display can be mounted on a separate small board that uses the display current-limiting resistors for electrical and mechanical interconnection.
Select an enclosure large enough to accommodate the circuit board and T1. A rectangular front-panel cutout (covered by a red filter) should be made for the three-digit display. RESET switch S1 is also mounted on the front panel. Jack J1, the fuseholder and an insulating grommet for the line cord can be mounted on the rear apron. The 5-volt regulator 1C10 and + 12-volt regulator IC9, which handle appreciable power, should be mounted to the rear apron to allow this wall to act as a heat sink.
Capacitors C5 and C6 can be soldered directly to the respective pins on their regulators.
The sensor circuit (Fig. 2) is made by soldering the base and collector of each transistor together to form one lead. Select a length of slender two-conductor zip-cord having sufficient length to reach the meter from each selected location.
At one end, separate the leads for an inch or so. Remove about 1/4-inch of insulation and slip a short length of narrow heat-shrinkable tubing on each lead, solder one to the base-collector lead and the other to the emitter lead.
Slide the heat-shrinkable tubing down over the soldered connection and shrink it. The outdoor sensor (Q1) can be en capsulated in epoxy if it is not mounted in a weatherproof location. After both sensors are fabricated, connect the far ends of both pairs to the stereo-type phone plug.
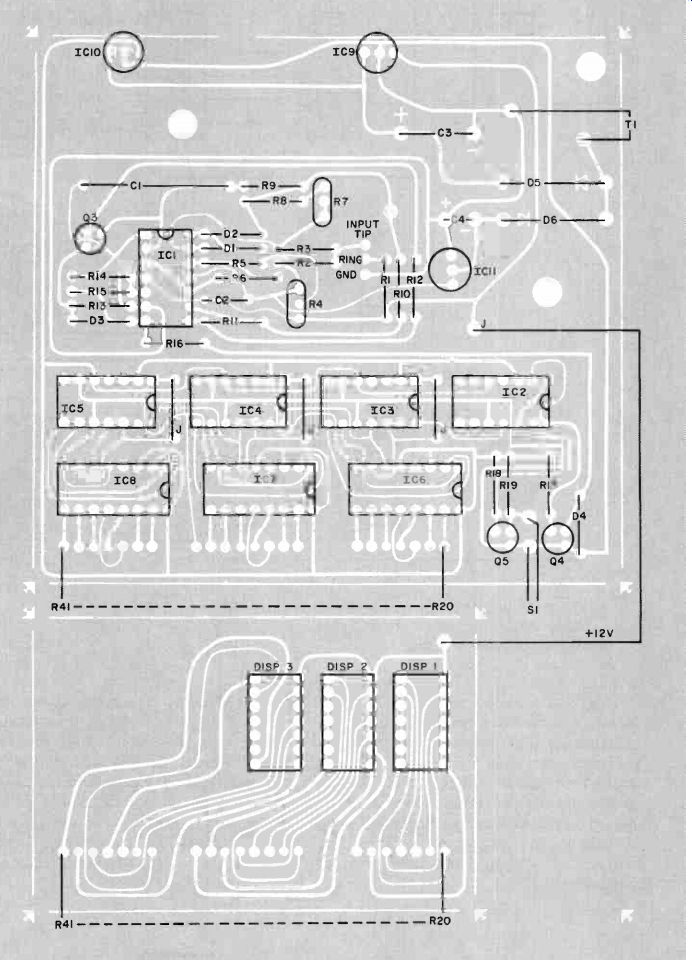
Fig. 5. The large foil pattern (opposite) is for the electronic circuit,
while the smaller board below it is for the display.
The two boards are interconnected by the current limiting resistors. Installation of these and other components is shown above.
Operation. To calibrate the degree day meter, all you will need is a dc volt meter and an ordinary thermometer. Then proceed as follows: Connect the voltmeter between the test point shown in Fig. 2 and ground. Set the voltmeter for its most sensitive dc voltage range, and place the sensors close to each other. Turn on the degree-day meter, allow it to stabilize for 10 to 15 minutes, and then adjust R4 for exactly zero volts on the dc voltmeter. Then place the outdoor sensor in a cool place (outdoors or in the refrigerator), and adjust R7 until the voltmeter indicates-0.1 volt for every degree of difference in the temperatures between the sensors. For example, if the inside temperature is 70° F and the out side sensor is at 40°F, adjust R7 for (70-40) X-0.1 or-3.0 volts at the test point. Install the sensors where de sired and you're ready to measure degree-days. The outside sensor should be mounted in a shaded location away from the house and protected from the weather. The inside sensor should be mounted in a central location away from heat sources.
To start a measurement, depress RE SET push button S I . The display should be "00.0" and should be observed to increment through the day if the outside sensor is cooler than the inside sensor.
The greater the temperature difference between outside and inside, the faster the display will increment.
To measure actual energy efficiency of your home, you must measure the energy used over the same time interval that you measure degree-days. Your utility company can tell you how to read your gas or electric meter, or an elapsed-time meter may be connected to measure the total length of time the furnace is heating. Simply divide the energy (therms, BTUs, or kilowatt hours) by the degree-days to obtain a figure in energy per degree-day. This number should be nearly constant from day to day, and any improvement you make in your building's heat retention will lower this factor.
The degree-day meter can also be used to check your home's heat gain while air-conditioning is in use. Simply reverse locations of the inside and out side sensors. It is suggested that regular records be kept throughout the season to encourage conservation. It will be obvious from the efficiency determinations when real improvements are made in the weatherization of your home. (Note that frequent opening and closing of doors is tantamount to a reduction in insulation efficiency.) Use of the degree-day meter can help a homeowner accurately estimate the payback period on money spent weather-proofing his building.
Source: (Popular Electronics Electronic Experimenter's Handbook (1983)
Also see:
Build a Vocal "Truth" Analyzer
Tools & Equipment for Electronic Workbenches