
The vacuum-tube voltmeter, the AM signal generator, the sweep signal generator, and the oscilloscope are the four basic test instruments of the tele vision serviceman. Without them repairing television receivers would be more or less of a haphazard affair filled with uncertainty. You would frequently find yourself wondering whether a set has been completely repaired or whether there was still something else that could have been done. On difficult jobs you would be forced to spend many needless hours locating the trouble. Certainly no one who expects to be a successful serviceman can afford to be without suitable test equipment.
There are, in addition to the foregoing instruments, other units which will perform specific jobs that arise either in connection with the servicing or alignment of television receivers, or in their installation. It is helpful, for example, to know the approximate strength of a received signal when erecting an antenna array. This can be done with a field strength meter. Or, a composite video signal genera tor would be of considerable assistance when used as a substitute for regular TV signals which may be off the air . These and other instruments, while they may not be as basic in application to all phases of television servicing as the instruments previously described, are not to be dismissed as so much fluff.
They serve a very definite purpose and are well regarded by the men who have occasion to use them.
Television servicing is a highly specialized and competitive field, and any device which will improve the efficiency of an operation is definitely worthwhile.
In this section we will consider some of the more important specialized instruments which are available to the service technician.
MARKER GENERATORS
The purpose of a marker generator, we know by now, is to provide known frequencies with which to probe and identify the various sections of a response curve.
The function of the marker generator is an important one in the alignment of television receivers and actually such generators should properly be considered as a basic TV service instrument. In essence this was done in Section 2 since marker pips can be provided by any AM generator of suitable range.
The reason for withholding the description of marker generators until this section is due to their specific designation as marker generators by their manufacturers (rather than AM signal generators) and because they contain certain special features which could not be fully appreciated until after sweep generators had been examined. Just what these are will be brought out as each instrument is examined.

Figure 1. Sylvania Television Marker Generator. Courtesy Sylvania Electric
Products, Inc.
A marker generator manufactured by Sylvania Electric is shown in Figure 1. Contained within the unit are two separate oscillators: a variable frequency oscillator (vfo) capable of generating frequencies from 15-240 mhz in four bands (labeled A, B, C, and D on the front panel) and a crystal-controlled oscillator which will operate with plug-in crystals having fundamental frequencies in the range of 2-20 mhz. The crystal oscillator is used for the alignment of intercarrier TV receiver sound systems (to be described later) and for checking the calibration of the vfo. The output of each oscillator is individually con trolled by attenuators.
A five-position "Selector" switch is used to turn power on or off and to choose the type of output desired. In the STAND BY position only the filament voltage is applied to the various tubes, while in the three operating positions which follow, the plate voltage is also applied. Indicator lights are used to denote STANDBY and OPERATE positions.
By means of the "Selector" switch it is possible to choose the output of the vfo and crystal oscillators separately or in combination. Thus, two marker pips may be obtained by the simultaneous use of both oscillators. Crystal controlled IF markers may be obtained from the harmonics of a crystal of appropriate frequency inserted in the panel socket. For example, if the receiver being worked on has a video carrier IF value of 26.4 mhz, a crystal with a fundamental frequency of 13.2 mhz will, on the second harmonic, produce the 26.4 mhz signal. The vfo can then be set at some other frequency to provide another identifying pip.
A feed-through connection is provided for the sweep generator signal, enabling both marker and sweep signals to combine. No attenuation is suffered by the sweep signal in this process while the amount of marker signal which is injected into the sweep signal can be controlled by its respective attenuator.
To check the frequency response curves of a television receiver using this marker generator, we would proceed as follows. Set the "Selector" switch to the position labeled STANDBY and allow the unit to warm up. Connect the output of the sweep generator to the marker generator connector labeled "Sweep Generator Input". Connect the output of the marker generator to the circuit under test in the manner designated for the sweep generator. See Figure 2.
Proceed to display the TV receiver response curve on the oscilloscope using the sweep generator only.
Set the "Band" switch to the proper position. Adjust the marker generator dial to correspond with the center frequency of the sweep signal generator. Set the "Selector" switch to the position marked VFO. Observe the oscilloscope and advance the "VFO Attenuator" until the marker pip appears. If the marker pip is broad or fuzzy, shunt the input to the oscilloscope with a .001 mfd. capacitor. The output of the marker generator should be kept at a minimum to avoid distortion of the response curve. Adjust the vfo marker pip to the desired position on the response curve and read the frequency from the vfo scale.
To check the calibration of the vfo against the crystal, we would proceed as follows. First we would feed the signal output of a sweep unit into this marker generator and then feed the combined marker and sweep output into the circuit under test. See Figure 2. An oscilloscope would then be connected to the other end of the circuit and adjusted so that the response curve would be displayed on its screen.
Next , a crystal is selected having either its fundamental or a harmonic of its fundamental frequency lie within the pass-band of the curve displayed on the oscilloscope and this crystal is inserted into the crystal socket of the marker generator. The "Selector" switch is set to the position marked XTAL & VFO. The "Crystal Attenuator" control is adjusted until the cry st al marker pip appears on the response curve.
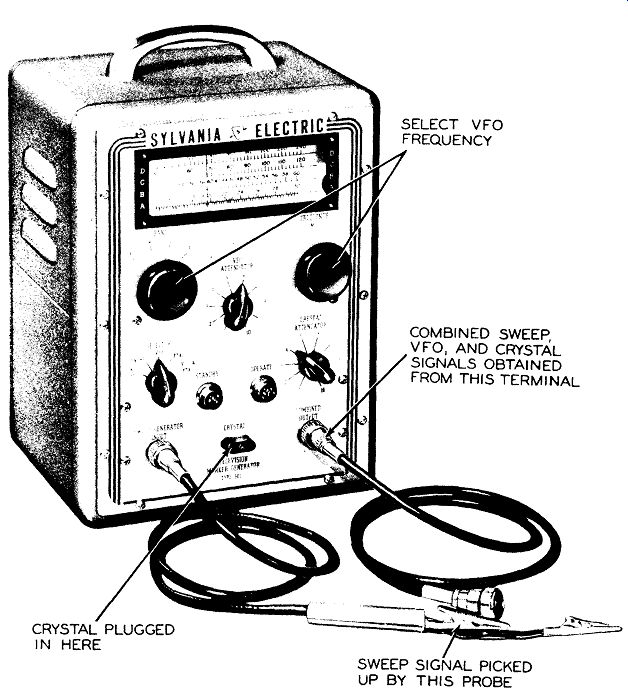
Figure 1. Sylvania Television Marker Generator. (Model 501, Courtesy of Sylvania
Electric Products Inc.)

Figure 2. Connecting Sweep Generator to Marker Generator.

Figure 3. A Crystal Detector which can be Used for Zero Beating Two Signals,
as Described in Text.

Fig. 4
Now, adjust the vfo marker pip to coincide with the crystal marker pip and check the frequency indicated on the dial against the crystal frequency ( or the harmonic which is being beat against). Slight inaccuracies can be corrected by adjusting a vfo trimmer.
Another way of checking the vfo against a crystal, without using a sweep generator, is to feed both vfo and crystal signals into the video IF system of a television receiver. An oscilloscope is placed across the video second detector load. resistor. Then the vfo frequency is varied until zero beat is observed on the oscilloscope screen. The reading of the vfo scale should be at or close to the crystal oscillator frequency or a multiple thereof.
Crystal calibration of the vfo can also be carried out by feeding the combined output of the vfo and crystal oscillator into the detector network shown in Figure 3 and then transferring the demodulated signal to the vertical input terminals of an oscilloscope.
When the vfo frequency coincides with the crystal frequency or one of its harmonics, a zero beat pattern will be observed on the scope screen.

Figure 4. A Versatile Marker Generator. Included is a Crystal-Calibrated Variable
Frequency Oscillator, Two Crystal-Controlled Oscillators, a Modulator Stage
for Internally Modulating the Output at Audio and RF Frequencies, and an Audio
Amplifier with Internal Speaker. Courtesy RCA.
RCA TELEVISION CALBRATOR
The number of functions which a marker generator can be designed to perform is limited only by the ingenuity of the designer and the selling price which he wishes to place on the instrument. The instrument shown in Figure 4 is a combination of the following:
1. A crystal-calibrated TV marker generator with dual markers for all TV frequencies.
2. A bar-pattern generator for making linearity adjustments.
3. A re-broadcast miniature. transmitter for checking all 12 TV-channels.
4. A heterodyne frequency meter including amplifier and speaker.
5. A signal generator operating on fundamentals in all TV bands.
6. A dual crystal standard with three crystals supplied.
The variable frequency oscillator which is the primary source of marker signals has a range from 19 mhz to 240 mhz on fundamentals, and twice this on second harmonics. In addition , there are three crystals, .25 mhz, 2.5 mhz, and 4.5 mhz, which can be employed for calibration, for producing additional marker pips, or for alignment of the sound IF system of intercarrier receivers. Zero beating facilities are provided in the form of a built-in speaker or, when the signal is weak, headphones may be plugged in. A jack is also provided to permit insertion of an external modulating voltage of any frequency when modulation of the output frequency of the variable-frequency oscillator is desired. Finally, the instrument may be utilized for checking the vertical and horizontal linearity of a television receiver. This latter application is somewhat outside the province of marker generators and so the manner in which it is achieved may be of interest.

Figure 5. Vertical Bars to Check Horizontal Linearity.

Figure 6. Horizontal Bars Designed to Check Vertical Linearity.
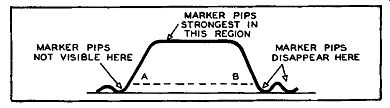
Figure 7. When the Marker Signal Passes Through the Circuit Under Test, it
is Frequently Difficult to Discern the Marker Pips Below Level A-B.

Figure 8. Marker Pip Amplitudes Can be Kept Constant Across the Entire Response
Curve by not Passing Marker Signal Through the Test Circuit. See Text.
The instrument is tuned to the picture carrier frequency (of one of the 12 channels) and the "Calibrate" switch is set to .25 mhz. This causes the .25 mhz crystal oscillator output to modulate the output of the variable frequency oscillator. When this signal is applied to a television receiver, a vertical bar pattern of approximately 16 bars will appear on the receiver s c re en . See Figure 5. If the bars are all evenly spaced, the horizontal motion of the scanning beam is linear; if the spacing is uneven, the horizontal linearity requires adjustment.
To check the vertical linearity, the "Calibrate" switch is turned to the CRYSTALS OFF position and an audio oscillator is plugged into the "Mod. In" jack.
If the audio frequency is set at 1200 hz, 20 horizontal bars will appear on the receiver screen. See Figure 6. If the vertical motion of the scanning beam is linear, the bars will be evenly spaced from each other; non-linearity will reveal itself by unevenly spaced bars.
ALTERNATE METHOD OF MARKER INSERTION
In all of the previous applications of marker generators, their signals were passed through the circuit under test together with the sweeping signals.
Extreme care must be observed at all times that the marker signal amplitude is kept low enough so that it does not disturb the response curve.
Another difficulty that is frequently encountered with this method of marker insertion is the disappearance of the marker pip when it passes through a depression produced by a trap circuit. Thus, in Figure 7, the pip will be visible as long as it is kept above the level of the dashed line, A-B, but when it drops down into one of the dips produced by the video traps the pip energy is absorbed (along with the sweep signal at that frequency) and very little if any of the marker will be seen on the screen. This makes it difficult to determine whether or not the trap circuit is adjusted exactly on frequency. It also means that the pip amplitude will vary at different points along the response curve (just as the curve amplitude does) and this necessitates frequent adjustment of the marker signal amplitude.
It is possible to circumvent these difficulties by not passing the marker signal through the test circuit at all. The set up for the equipment is shown in Figure 8. The signal from the sweep generator is fed to the circuit under test in the normal manner.
At the same time, a small portion of the same sweep signal is fed to a special marker generator.
Within the marker generator the sweep signal and the marker signal are mixed together and detected producing the same pip they would have, had they both been sent through the test circuit and its detector.
This pip is then combined with the detected output of the circuit under test and fed to the vertical input terminals of an oscilloscope . Because the same sweep signal is used with the marker generator and the test circuit, the position of the pip on the response curve will be where it would have been had it been passed through the test circuit. However, now the pip amplitude is constant over the entire response curve, even in valleys produced by trap circuits, or at other points near the response baseline.
For a marker generator to be employed in this manner, it must contain facilities for accepting the sweep signal, for mixing it with the marker voltage and then combining the resultant pip with the demodulated signal from the circuit under test. This necessitates a special design, such as that possessed by the marker generator shown in Figure 9A. A block diagram of this instrument is shown in Figure 9B. A modified Colpitts type oscillator comprises one half of a 12AT7 tube. A 15 position gang switch provides the means of switching any one of twelve crystals or three tuneable circuits into the grid of the oscillator. For greater frequency stability, the crystal fundamentals are kept low and harmonic outputs a r e used for the desired picture carrier frequencies. The following list gives the crystal fundamental and harmonic used for each channel.

Figure 9A. A Special Marker Generator Designed to Develop Marker Pips Independently
of the Test Circuit. Courtesy of General Electric Company.
Crystal Picture Channel Fundamentals Carrier
Crystal Harmonic
The output of the picture carrier oscillator is taken from the cathode and fed to the grid of the mixer modulator tube (the other half of the 12AT7 tube). A sampling of the sweep generator output is c able d to the marker generator. This voltage is applied to the grid of the sweep coupling tube, which prevents any interaction between equipments. The output of this tube is taken from its cathode and fed to the cathode of the mixer modulator stage.
Since the mixer modulator grid is being driven by the picture carrier oscillator across a large value grid resistor, it is biased to the non-linear portion of its operating curve. Thus, the tube acts as an untuned detector and demodulates the combined signals applied to it. The pip output appears at the plate load resistor and is transferred to the grid of the first marker amplifier stage.
There are three stages of marker amplifiers and as the pips pass through, they are shaped and sharpened to produce a clearly defined marker indication when they are subsequently presented on an oscilloscope screen. Control of the marker output is accomplished by the "Marker Size" control wired into the grid circuit of the last marker amplifier. The output of the final marker amplifier tube is fed to the cathode of the superimposing section.
The output of the receiver being aligned is connected to J3 which injects the signal on the grid of the superimposing section. The detected marker signals are fed to the cathode of the same tube and the combined output appears at J4 to be transferred to the vertical input of the test oscilloscope.

Figure 9-B. Block Diagram of The G.E. Marker Generator.

Figure 10.

Figure 11. Another Special Marker Signal Generator. Courtesy Kay Electric Company.
4. 5 and 1.5 mhz OSCILLATOR
The crystal used in the crystal oscillator grid circuit is a triplex cut and normally oscillates at 4.5 mhz. By changing the plate tuning, it will also oscillate at 1.5 mhz. The plate load switching is done with the 3-position "Crystal Modulator" selector switch. B+ can be removed by actuating the ON-OFF switch located just below the selector switch.
The output of the crystal modulator is fed to the plate of the modulator tube where it plate modulates the picture carrier oscillator output, producing side band markers ±4. 5 mhz from the picture carrier to show the relation of picture carrier to audio carrier.
See Figure 10A. In the 1.5 mhz position, markers are produced every 1.5 mhz across the response curve, allowing the operator to check adjacent channel response and band pass characteristics. See Figure 10B. The reader will find it interesting to study Figure 10B because it demonstrates very effectively the following relationships that exist between adjacent channel signals:
1. Picture carrier of one c h an n el is 1. 5 mhz from sound carrier of lower channel. 67 .25 mhz is the picture carrier of channel 4; 65. 75 mhz is the sound carrier of channel 3.
2. Picture carrier and sound carrier of same channel separated by 4.5 mhz.
3. Adjacent picture carriers are separated by 6.0 mhz.
Hence, by knowing the frequency of the picture carrier oscillator, it is a simple matter to check the remainder of the response curve by noting the position of each 1.5 mhz marker.
Another marker generator that can be employed in the same manner is the unit shown in Figure 11.
The signal from the sweep generator is applied to the input terminal where a portion of it is fed to an RF buffer amplifier. The rest of the sweep signal appears at the output terminal from which point it is fed to the circuit under test.
Within the marker generator, the abstracted portion of the s we e p. signal passes through an RF amplifier to a 6AK5 variable oscillator and detector stage. The result ant beat note obtained from the mixing of the sweep and marker signals is passed through a tuned 10 khz network to a 6J6 du a 1 audio frequency amplifier and thence to the "Pip Output" terminals of the instrument. By means of a low capacity shielded lead or a twisted pair, the pip signal is taken from these terminals and applied to the vertical input terminals of an oscilloscope where it combines with the demodulated response signal from the circuit under test. The set-up of the instruments is shown in Figure 12.
Note that with this instrument, combination of the pip signal and the response voltage from the test circuit does not occur in the marker generator (as in the previous instrument), but at the vertical input terminals of the oscilloscope. All other phases of this operation, however, are similar.
The frequency range of the continuous or marker oscillator extends from 19 to 49 mhz in two bands--10 to 30 mhz and 30 to 49 mhz. A separate crystal oscillator generates a frequency of 4.5 mhz for alignment of the sound system of intercarrier receivers and for adjusting 4.5 mhz video traps. Also, harmonics of 4.5 mhz may be employed to check the calibration of the variable (CW) oscillator.
UHF SWEEP-MARKER GENERATOR

Figure 9A. A Special Marker Generator Designed to Develop Marker Pips Independently
of the Test Circuit. (Model ST-5A, Courtesy General Electric Co.)
Figure 11. Another Special Marker Signal Generator. (Megaliner, Courtesy of
Kay Electric Co.)

Figure 12. Instrument Set-Up Using the Marker Generator Shown in Figure 11.
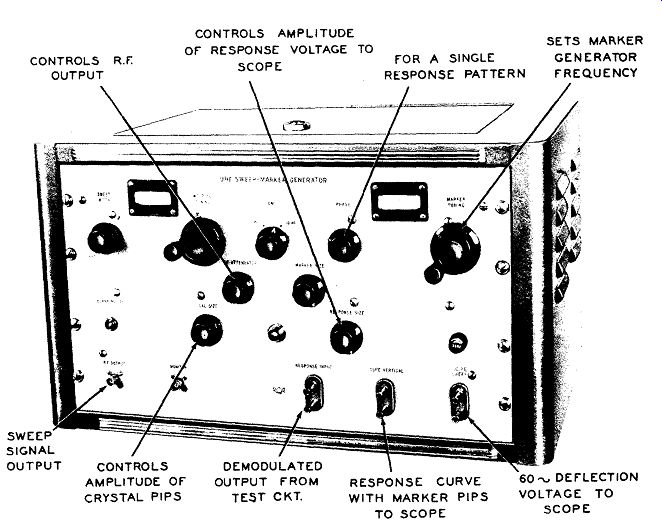
Figure 13. A UHF Sweep-Marker Generator. (Courtesy of RCA.)

Figure 13. A UHF Sweep-Marker Generator. Courtesy RCA.
With the opening of the ultra-high frequencies ( 470 - 890 mhz) to television broadcasting, spec i a 1 sweep and marker generators designed to operate within this range will be required by the television service man and the television engineer. At the time of this writing very few popular priced UHF generators have made their appearance, and so it is difficult to judge what their price range will be or how they will differ from their VHF counterparts, especially in the oscillator section of the instrument. Information has been released on the RCA WR-40A UHF Sweep-Marker generator and it may be instructive to examine its features to see what has been done along these lines.
The WR-40A (shown in Figure 13) is· a sweep oscillator with built-in marker oscillator and crystal calibrator. The generator also includes mixers and adders for superimposing markers upon the response curve after the signal has passed through the tuner under test.
The sweep frequency oscillator in this instrument employs a type 5675 UHF pencil-type triode in a modified cavity resonator circuit and is continuously tuneable from 470 to 890 mhz. It is frequency modulated by a vibrating device which varies the inductance of the cavity to provide a linear frequency deviation up to 45 mhz. The cavity is designed to have very low leakage, and a capacitance adjustment in the cavity compensates for shifts in calibration when it is necessary to replace the oscillator tube. Blanking of the sweep oscillator is included to give a reference base line. The blanking voltage is controlled by a push-button on the front panel so that it may be easily removed for precise setting of the phasing control.
The marker system included in the instrument consists of a variable frequency oscillator similar to the sweep oscillator and a crystal calibrator which provides 1 and 10 mhz calibration pips throughout the UHF TV band. The crystal calibrator consists of a 10 mhz crystal oscillator, a 1 mhz locked-in oscillator, and a three tube harmonic generator. A sensitive amplifier together with mixers and adders is used to superimpose the variable freq u en c y and crystal markers on the response curve for observation on an oscilloscope screen.
From the block diagram of the generator, Figure 14, we see that the output of the sweep oscillator, V9, goes to three different points in the circuit. One portion of the sweep oscillator connects directly to the RF output terminal from which point it is fed to the circuit under test. Another portion of the sweep oscillator signal goes to a crystal mixer - CR2 - where it combines with the marker signal to form a pip. The final connection from the sweep oscillator is made to CR1, a crystal mixer where the output from the crystal calibrating circuits is combined with the sweep signal to form a series of pips spaced at 1 or 10 mhz intervals, depending on the crystal oscillator chosen by the " Cal" switch.
The pips produced by the marker section of the instrument and the pips produced by the calibrating section are each separately shaped and amplified and then combined in V7B. At the same time, the de modulated output from the tuner ( which is the response curve of this tuner) is brought back to the instrument via the "Response Input" terminal and amplified by V8B. From here the signal goes to V8A where the marker and/or crystal pips are added and then the combined signal goes to the vertical input terminals of an oscilloscope. See Figure 15. The horizontal sweep frequency for the oscilloscope is also obtained from the front panel of this generator.
Note that none of the pips pass through the test circuit and hence cannot affect the amplitude of the response curve. Furthermore, all pips are equally visible at every point on the curve.
TV SIGNAL SUBSTITUTE INSTRUMENTS
Lack of a television signal hampers the service man by preventing him from performing an air check on a receiver before it leaves the shop or from con ducting certain tests while he is repairing it. With out a signal he may be unable to determine what the defect is; or, if the set repaired, he may be unable to make final adjustments on certain operating controls which frequently require some correction, however slight. Into this category fall the vertical and horizontal hold, linearity, and size controls. In the pages that follow, a representative group of instruments are described, instruments which will provide partial or total substitution for a TV signal.
LINEARITY CHECKS

Figure 14. Block Diagram of the RCA UHF Sweep Marker Generator.
In a properly adjusted television receiver, the electron scanning beam travels from left to right and from top to bottom at uniform rates of speed. Any speeding up of the beam will cause the picture to stretch out while any slowdown will result in image compression. Either effect is labeled as non-linearity and in the absence of a component defect can usually be corrected by adjust men t of the corresponding linearity controls.

Figure 15. The Manner in Which the UHF Generator is Employed to Align a UHF
Tuner. Courtesy RCA.

Figure 16.
To determine whether non-linearity exists in either sweep section of a television receiver, we must first produce a test pattern (preferably) or a picture on the screen. Non-linearity cannot be determined by using a raster alone. In the absence of a received signal, linearity checks can be performed in several different ways. The simplest approach is to take an audio generator and connect it across the load resistor of the video second detector stage. If we set the generator frequency to 60 cycles, then half the screen will be light and half will be dark. See Figure 16. This is so because it takes the electron scanning beam approximately 1/60th of a second to travel from the top of the screen to the bottom and in this time the applied 60 cycle sine wave will have passed through one-half positive cycle and one-half negative cycle.
If we assume that the positive half cycle is active first, then the top half of the screen will be bright.
During the succeeding negative half cycle, the beam current reaching the screen will decrease, possibly reducing to zero. Therefore, the screen during this half cycle will be dark.
To increase the number of bars on the screen, we need only raise the frequency of the generator.
When the frequency reaches 660 cycles, its voltage (which, remember, is reaching the grid of the picture tube) will pass through eleven complete cycles in the time it takes the beam to travel once from top to bottom of the screen. We will thus see eleven white and eleven black bars, all horizontal. This is shown in Figure 17.

Figure 17.
Generally, it is desirable to have 20 or so bars on the screen obtained by raising the audio generator frequency to 1200 cycles or higher. In this way the bars are not too thick and the vertical linearity can be adjusted accurately. The pattern observed on the screen will be stationary because some of the signal applied across the video second detector load resistor will find its way into the sync circuits and stabilize the vertical sweep oscillator. (Sync take-off points are almost always placed after the video detector.) To check the horizontal linearity of a set, we must develop a series of vertical bars across the face of the tube. See Figure 18. This can be achieved by raising the frequency of the applied sine wave until it affects the electron beam during the scanning of a single line. We know that lines are scanned out at the rate of Hi, 750 per second. Hence, in order to blank out portions of a line while the beam is moving across the face of the tube, the frequency of the applied signal should be higher than 15,750 cycles. A good value to use is 315,000 cycles, this being 20 times 15,750 and therefore capable of producing 20 vertical bars. however, any multiple of 15,750 may be used, as desired.
To obtain a signal of 315 khz, an RF signal generator will be needed since few audio generators extend this high. The output leads of the generator are connected across the video detector load resistor as discussed above. When the signal frequency is an exact multiple of 15,750, the vertical bars will be stationary on the screen because the horizontal sweep oscillator of the receiver will be held in synchronism with the signal.

Figure 18.
We can obtain results similar to the above by connecting an RF generator to the antenna terminals of the receiver, setting its frequency to the video carrier value of any of the twelve channels, and then amplitude modulating this signal first with a 1200 cycle voltage (for a vertical linearity check) and then with a 315 khz voltage (for a horizontal linearity check). This was substantially the method suggested for sever al of the generators in Section 3 and for the RCA Television Calibrator earlier in this section. Modulating frequencies other than 1200 cycles and 315 khz may be used, the only difference being a change in the number of bars developed on the screen. Several of the instruments to follow will have their own facilities for producing screen patterns to check linearity, but the end results will usually be quite similar.
Thus, consider the cross-bar generator shown in Figure 19. This generator contains two oscillators: a VHF oscillator which will tune from channel 2 through channel 6 and a low frequency oscillator which can be set at either 1100 cycles (approx.) or at 362.25 khz. The output from the low-frequency oscillator is a series of pulses and these are fed to the VHF oscillator where they amplitude modulate the signal developed here. This modulated RF signal is then applied to the antenna input terminals of a receiver.
The pattern appearing on the receiver screen will consist of a series of vertical or horizontal bars depending upon whether the low-frequency oscillator is set for 1100 cycles or 362.25 khz.
It will be noted that the VHF oscillator in the instrument tunes only through channels 2 to 6. Linearity in a receiver is independent of channel setting and if a receiver is adjusted for proper linearity on the low channels, it will retain this linearity on the high channels. By designing this instrument only for low band operation, its usefulness remains unaffected, while its cost can be kept down.

Figure 19. A Cross-Bar Generator which can be Employed for Setting the Linearity
Controls of a Tele vision Receiver and for Limited Servicing of the Vertical
and Horizontal Sweep Systems. Courtesy Superior Instrument Company.

Figure 20. The Schematic Diagram of the Superior Cross-Bar Generator.
CHECKING SWEEP CIRCUITS
It is also possible to employ the cross-bar generator to supply pulses directly to the vertical or horizontal systems of a television receiver for checking purposes. In this case the output pulses are obtained directly from the low frequency oscillator.
For checking the horizontal sweep system, the oscillator frequency is set at 15,750 cycles; for checking the vertical sweep system, the low frequency oscillator is converted to an amplifier and a 60-cycle voltage from the filament transformer is passed through it.
The amplifier distorts the wave into an approximate saw-tooth shape. This is then fed to the vertical sweep system to be tested.
The usefulness of the cross-bar generator in checking the sweep systems of a television receiver lies in its ability to substitute its own pulses for those which would ordinarily be produced by the receiver sweep oscillators. Thus, if the high voltage in a receiver is missing and the serviceman wishes to determine whether this is due to the failure of the horizontal oscillator, he can connect the output of this generator to the point in the receiver where these pulses would normally be present. If the high-voltage reappears, then either the oscillator is inoperative or else the circuit path from the oscillator to the point where the bar generator is connected has been broken.
The reader will recognize that there are other servicing methods for the same problem which would not require use of a bar generator. However, this facility is available in this instrument and may be used, if desired.

Figure 21. The Hickok Linearity Generator.
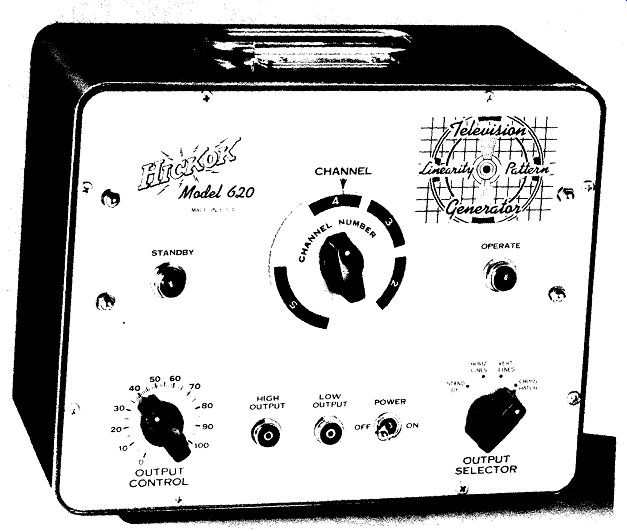
Figure 21. The Hickok Linearity Generator. (Model 620, Courtesy Hickok Electrical
Instrument Co.)

Figure 24. An Elaborate Servicing Instrument Designed to Enable the Serviceman
to Carry out a Series of Tests on a Television Receiver. Some of its Features
Are Discussed in the Text. (Model 650, Courtesy Hickok Electrical Instrument
Co.)
A circuit diagram of the generator is shown in Figure 20. The VHF oscillator is a grounded-plate Colpitts with signal take-off achieved capacitively by means of the stray capacitance existing between L3 and L4. (The word capacitive here is not an error.) The low frequency oscillator is a Hartley in position 1 of the 4-position switch, operating near 362.25 khz to produce 23 vertical bars. In position 2, the oscillator becomes a blocking oscillator functioning at some harmonic of 60 cycles (to produce horizontal bars). In position 3, the oscillator generates a frequency near 15,750 cycles, while in position 4, the stage becomes an amplifier to distort the 60-cycle voltage obtained from the filament transformer.
The "Linearity-Sweep" switch determine s whether the output will come from the VHF oscillator or from the low-frequency oscillator.

Figure 22. A Cross-Hatch Pattern Possessing the Proper 4:3 Aspect Ratio.
Another linearity pattern generator is the unit shown in Figure 21. This instrument will operate on channels 2, 3, 4, and 5, and provide either vertical or horizontal bars separately, or in a cross-hatch combination, as shown in Figure 22. There are 9 horizontal lines generated and 12 vertical lines providing a cross-hatch pattern possessing the proper 4:3 aspect ratio. This will enable the serviceman to adjust the height and width controls of the television receiver.
The vertical and horizontal bar frequencies are crystal-controlled, and consequently the vertical and ...
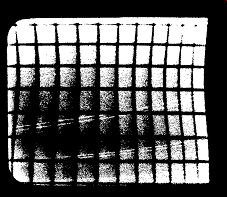
Figure 23. A Cross-Hatch Pattern is a very Sensitive Indicator
of Hum in a Television Receiver.
... horizontal hold controls i n the receiver can be adjusted for correct lock-in. The horizontal hold control will lock the pattern in horizontally in only one position.
However, the vertical hold control will lock the pattern in at several points. Only one point is correct: that is, when the vertical oscillator frequency is 60 cycles, This setting can be found quite readily. When the vertical hold control is properly set, the crosshatch pattern will be absolutely motionless. If the vertical hold control is misadjusted, the pattern will appear shaky.
A crosshatch pattern is a very sensitive indicator of hum in either the horizontal or vertical deflection systems. If 60-cycle hum is present, the vertical bars will show a slight sine wave ripple, one sine wave per height of screen. See Figure 23. A 120-cycle hum will produce two sine waves per height of screen.
Figure 24. An Elaborate Servicing Instrument Designed to Enable the Serviceman
to Carry out a Series of Tests on a Television Receiver. Some of its Features
are Discussed in the Text. Courtesy Hickok Electrical Instrument Company.

Figure 25. The Voltage Waveform of the Cross-Hatch Signal.
TELEVISION VIDEOMETER
The Television Video meter (Figure 24) can be considered as an elaboration of the previous linearity and cross-bar generators. Thus, it will produce horizontal or vertical bars separately, a crosshatch pattern or a dot pattern. The latter is shown in Figure 27. There are also available 60 cycle and 15, 750 cycle saw-tooth voltages, permitting this instrument to serve in place of the receiver saw-tooth generators.
RF signals covering channels 2 to 13 can be internally modulated by the signal shown in Figure 25. (This is the crosshatch signal in voltage form.) By means of a high-frequency probe and an oscilloscope, this signal can be traced through the RF and IF stages of a television receiver. When the probe is placed at a point in either system, the waveform shown in Figure 25 should appear on the scope screen. Absence or distortion of the signal indicates that the circuit is defective.
The number of tests which can be made with this instrument are indicated, in part, by the following illustration taken from its instruction manual.
A. Checks on Frequency Response
1. High Frequency Response. The vertical lines of the crosshatch pattern are produced by sharp 3.4 khz pulses, and to faithfully re produce these lines, the receiver circuits must be capable of passing at least the tenth harmonic of 3.5 khz, which is 3.15 mhz. The pattern in Figure 26 illustrates how a loss of high frequency response would show up.
Note that the edges of the vertical lines are blurry whereas they should be distinct.
2. Low Frequency Response. If, in viewing the dot pattern the picture shading gradually gets darker from top to bottom of the raster, the low frequency response is poor. See Figure 27. This may be due to a grid resistor in the video amplifier decreasing in value or a coupling capacitor of decreased value.
3. Phase Distortion. Black vertical lines with a white trailing edge would indicate phase distortion in the receiver. See Figure 28. This may be caused by improper RF-IF alignment or excessive high frequency phase shift in the video amplifier.
B. Degree of Isolation Between Sweep Circuits
In viewing the crosshatch pattern, the vertical lines or bars appear bent at the crossover points with the horizontal lines or bars as in Figure 29, it is an indication that the horizontal bar frequency (900 cycles) is disturbing the horizontal oscillator in the TV receiver. The cause is an inadequate high-pass filter in the sync circuits permitting low frequency components to interfere with the horizontal oscillator.
Another cause would be direct interaction between the two sweep systems due to stray fields.
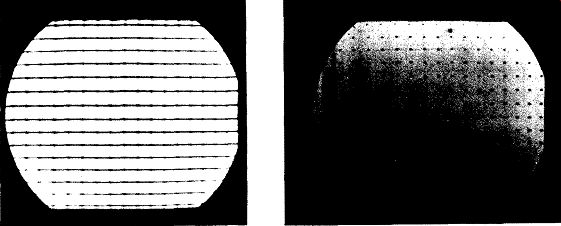
Figure 26. Loss of High-Frequency Response in the Video System as Indicated
by the Cross-Hatch Pattern. Figure 27. Poor Low-Frequency Response.

Figure 28. High-Frequency Phase Shift as Indicated on Cross-Hatch Pattern.
Figure 29. Poor Isolation Between Horizontal and Vertical Deflection Circuits.
In addition to the foregoing , such things as ripple or raster fold-over,. horizontal phasing mis-adjustment, picture blooming, and hum in the various stages will all be made evident on the crosshatch or dot patterns, enabling the serviceman to deal with them whether or not a station is on the air.
COMPOSITE VIDEO GENERATOR
The Videometer will produce a crosshatch and a dot pattern, and crystal-controlled 60 cycle and 15,750 cycle pulses, but it will not produce a video signal containing all the sync, blanking, and equalizing pulses in the form specified by the FCC. Such a signal can be obtained from the composite video generator shown in Figure 30. In addition, video modulation is provided in the form of precisely spaced pulses that appear on the picture tube as a grating composed of small black squares. Since the blanking and equalizing pulses are contained in the signal , these may be viewed on the picture screen, too.
This type of generator can readily be used with a monoscope to produce a complete video test pattern.
Small broadcast stations and receiver manufacturers use this combination extensively, the former for broadcasting and the latter for developing a suitable test signal for production line testing positions. The serviceman can use the instrument for many of the tests previously described for the Videometer. Note, however, that the composite video generator does not, in itself, contain an RF oscillator and therefore its signals could not be fed through the front stages of a television receiver. However, the video signal from this generator can be employed to amplitude modulate the RF carrier of an RF generator of suitable range and in this way enter a receiver through its front end.
TV FIELD STRENGTH METERS
No television receiver is better than the antenna system to which it is connected. By the same token, no matter how elaborate the antenna is, unless it is positioned where it can intercept the maximum amount of signal, it will be unsatisfactory.* Radio and Television Maintenance Magazine, December, 1950, page 9.
All of which boils down to one pertinent question.
In erecting any antenna, how can you be sure that it is being placed where the signal is strongest? The best answer, to date, is a field strength meter, such as the Simpson unit illustrated in Figure 31. A field strength meter is essentially a miniature receiver.
The television signal from the antenna is fed into the input terminals of the instrument where it goes through the same processes of amplification, con version, and detection as it does in a normal receiver.
The voltage which the signal develops at the output of the second detector is then applied to a microvolt meter. By calibrating the meter in terms of input voltages, rather than the actual voltage developed at the detector, we can read directly the strength of the signal at the antenna.
The meter used in this instrument has a 4.5 inch scale, calibrated evenly from 0 to 50 microvolts.
Fifty microvolts input will produce full-scale deflection, a desirable feature for those concerned with fringe area installations. By means of a multiplying switch, the meter can be converted to read up to 500, 5,000 or 50,000 microvolts extending the usefulness of the instrument into areas where the signal strength is high.

Figure 30. A composite Video Generator. (Model 665, Courtesy Supreme, Inc.)
The manner in which a field strength meter is used is quite simple. The transmission line from the antenna which ordinarily goes to the receiver is attached to the input terminals of the instrument . There is provision for a 300-ohm balanced line or for a 75-ohm unbalanced, coaxial line, as the case may be. With the meter power on, the antenna is moved about until the point is found where the signal level is greatest. This is governed by the orientation of the antenna and the height of the antenna. While it is generally true that the higher the antenna, the greater the signal developed it will also be found in many places, that as the antenna is raised, the signal will go through successive maxima and minima.
With the meter connected to the receiver end of the transmission line, you know exactly what the television set receives. This is important, because it is only the voltage which actually reaches the receiver that is responsible for the picture you see.
There may be 1,000 microvolts at the antenna, but if your set only receives 50 of these microvolts, the picture developed will be snowy or otherwise defective.
INSTRUMENT APPLICATIONS
It is common practice for installation men to judge the comparative strength of the signal received in various location by observing the quality of the picture. This is satisfactory where the difference in signal strength is large and the signal intensity is high. It is quite unreliable, though, where the avail able signal is weak. .And to the man living in a weak signal area, every microvolt is important.
Field strength meters have also been profitable used in customer relations. Servicemen who come in frequent contact with the public they serve know only too well that every service call is, in part, set servicing and, in part, customer servicing. Sometimes it is difficult to say which is most important. It is not unusual for a retailer to blame a poor antenna installation for a poor picture--or for an installation crew to blame the set. A field strength meter will resolve such disagreements once and for all. The meter here serves the customer in the same manner as a counter tube tester.
A money-saving application of the meter is to permit wider use of one-man installation crews. It is customary in most organizations to have two men in stall an antenna. One man walks about the roof with the antenna while the other man sits at the set and observes the picture. When the best picture is obtained, the man at the set relays this information to the man on the roof and the antenna 1s erected at the designated spot.

Figure 31. The Simpson TV Field Strength Meter. (Model 488, Courtesy Simpson
Electrical Company.)
However, the rapid rate of television expansion, coupled with the current e x pan s i on of the armed forces, and the increase in war work have combined to reduce the number of men available to the television service industry. One solution to this shortage is a number of one-man installation crews equipped with field strength meters. With a meter, one man can readily locate those points where the signal intensity is greatest. Erection of the antenna at this point, with a lead-in running to the set, will complete the job.
If ghosts are encountered, the antenna can be moved to another spot, again revealed by the meter. The installation man, by walking about the roof and ob serving the changing signal intensity, can for m a mental image of how the signal strength varies from point to point. If ghosts appear in one section, the antenna can be moved to another spot where the signal level is still usable.
There are, in addition to the foregoing applications, such additional uses as comparison of various boosters, comparison of transmission lines to determine which introduce the least loss, determination of which antennas are better suited for a certain installation, etc. To the man who is daily concerned with antenna installation, a field strength meter soon becomes almost indispensable.

Figure 32. Block Diagram of the Simpson Field Strength Meter.
CIRCUIT DESCRIPTION
The block diagram of the meter in Figure 32 shows its operation. The front end of the unit contains a Standard Coil rotary turret tuner with a 12-channel switch. As in television receivers, there is a fine tuning control to enable the operator to tune in each station for maximum meter indication. The incoming signal is amplified by an RF amplifier (6AG5) and then converted to 26 mhz (approx.) by mixing with a local oscillator signal.
Following the mixer is a 2-stage IF system peaked to 26 mhz. This is equivalent to the video IF system in a television receiver, except that the stages are sharply peaked here , since we are primarily concerned with the carrier and not the sidebands.
The signal is detected by a IN34 crystal and the peak value of the video signal--as established by the in coming sync pulses--is then indicated by the meter.
A rotary switch underneath the meter permits the proper shunt to be brought in for an on-meter reading.
In the last, or off, position of the rotary switch, a short is placed across the meter to prevent damage to the movement when the unit is not in operation.
A 6AU6 amplifier beyond the video second detector output receives whatever signal is developed by the detector and feeds this signal into a phone jack.
The purpose of this stage is to permit identification of interference signals, when these are encountered.
In the absence of interference, only the 60-cycle vertical sync buzz will be heard when earphones are plugged into the jack.
The sound carrier of any station except those on channels 6 and 13 may be received by switching the channel selector to the next higher frequency channel and adjusting the fine tuning control to the low frequency end of its range.
CONCLUSION
The survey of special TV test instruments in this section is indicative of the different types of units which are available for television service work. No attempt has been made either to cover all such units or to fully explain what any one can do. Neither of these fit in with the objective of this guide. However, sufficient information is given to indicate to the serviceman just how these instruments can ease the burden of his labor.