by E.A. Ballik [McMaster Univ., Hamilton, Ontario ]
IT IS WIDELY RECOGNIZED that peak recording levels can be considerably greater than the average levels. The majority of tape recorders employ average-reading VU meters, primarily because of circuit economics. Furthermore, VU meters generally have a frequency response which is relatively uniform in the region of 20 Hz to 20 kHz. Unfortunately magnetic tape does not have a uniform frequency response, and therefore considerable recording experience is required with standard VU meters in order to achieve high signal-to-noise ratios together with low distortion.
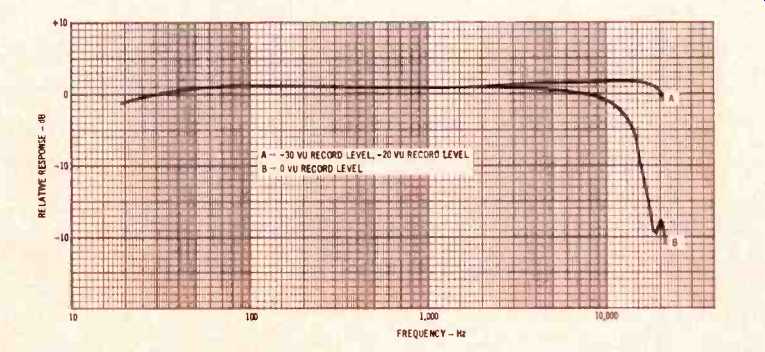
Fig. 1--Record-playback response at 7 1/2 ips. 0 VU corresponds to a
400 Hz signal recorded 8 dB below the 3% THD level.
This article describes a simple, and relatively inexpensive, peak-reading VU meter circuit which can be used either at the high level output of a tape recorder (PHONE or LINE) or which can be incorporated into the recorder itself.
The circuit also provides compensation for the recording and saturation characteristics of the tape medium. This compensated peak-reading VU meter circuit makes it possible to achieve the maximum available signal-to-noise ratio from the tape and ensures that THD and intermodulation distortion are kept at acceptable levels over the whole of the audio spectrum.
A slightly modified two-track Revox A77 tape recorder and Scotch 206 tape were used for all the measurements reported below. The Revox meters were calibrated so that 0 VU corresponds to a 400 Hz signal recorded 8 dB below the 3% THD level. Playback response, as measured with an Ampex 21690010-01 two-track test tape, was well within ± 1 dB. The unweighted record-playback signal-to-noise ratio at 400 Hz was 60 dB for 1% THD.
Tape Record-Playback Characteristics
Figure 1 illustrates the relative record-playback response at 7 1/2 ips, taken at constant input with frequency. Curve A corresponds to record levels of -30 VU and -20 VU. The only difference noticed during these two measurements was a decrease in the 20 kHz response of approximately ' dB at the higher input level. Curve B corresponds to a record level of 0 VU. The decrease at higher frequencies results from tape saturation. Clearly curve A would be the response quoted in manufacturers' literature or in test reports.
Several parameters affect the high frequency response of the tape and consequently the saturation behavior.
Several of these are inherent in the tape. These include: Oxide Layer: The oxide material, the particle size, and the coating thickness can all have a significant effect. These effects can only be controlled in the tape manufacturing processes. Oxide coatings have been slowly but constantly improved in recent years and are expected to continue to do so.
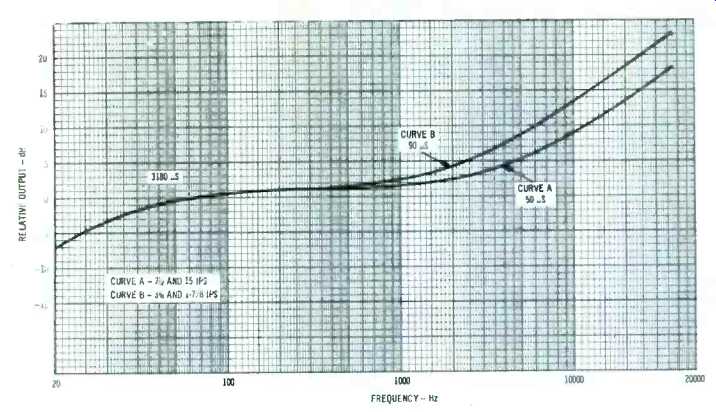
Fig. 2--NAB standard reproducing characteristic. Reproducing amplifier
output for constant flux in the core of an ideal reproducing head.

Fig. 3--Revox A77 record amplifier response. The curve is essentially
the same for both 3 3/4 and 7 1/2 ips.
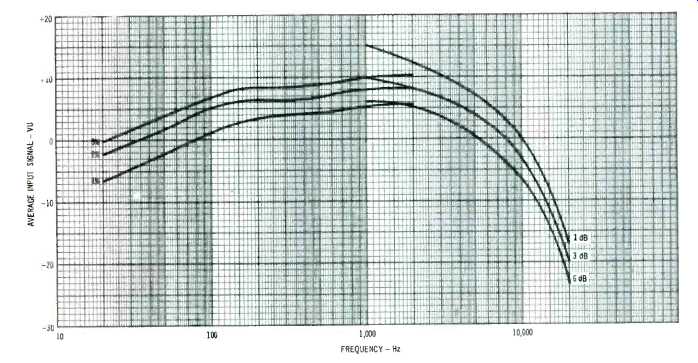
Fig. 4--Tape distortion-saturation data. Curves are given for 7 1/2
ips. Those below 1 kHz correspond to THD; those above 1 kHz to the output
in decibels below the peak saturation output.
Penetration Losses: At low frequencies the full depth of the tape is magnetized. With higher frequencies (i.e. short recorded wavelengths) the depth of magnetization decreases, until only the surface of the oxide coating is magnetized. The high frequency recorded intensity is therefore decreased. Penetration losses for a given oxide can only be modified by varying the tape thickness. However this usually affects other parameters such as tape uniformity and signal-to-noise ratio, particularly at lower frequencies.
Self-Demagnetization: At high frequencies the recorded magnetic poles are closely spaced and thereby cause a decrease in the recorded signal. This effect is usually small. However it can increase with storage time of the recorded tape. Losses of a few decibels at the highest recorded frequencies are possible after storage of several years.
Other sources of high frequency losses are primarily caused by the tape recorder characteristics. These include: Recording Demagnetization: Increasing the recording bias results in high frequency attenuation (i.e. self-erasure). A low bias cannot be used because it would result in high distortion levels.
Generally the optimum bias is characteristic of the particular tape used.
Head Losses: The playback output drops to zero when the playback head gap is equal to a recorded wavelength.
The effect can be made negligible by the use of an extremely narrow gap.
This will result, however, in a very small output, with decreased signal-to-noise ratio. In practice a compromise is made in the gap size which results in significant head losses at the higher recorded frequencies.
Equalization to compensate for high frequency losses is carried out in both the record and the playback amplifiers.
In order to allow interchangeability of recorded tapes a standard playback equalization is used in the better audiophile recorders and in professional equipment. The current standard reproducing characteristics used in North America is the NAB standard, shown in Fig. 2. The curves are for a constant flux in the core of an ideal reproducing head (i.e. zero frequency-dependent head losses). Note that with zero playback equalization a constant flux would give a playback output which increases at the rate of 6 dB per octave.
The equalization illustrated in Fig. 2 provides a 6 dB per octave boost at high frequencies (3 dB up at 1.6 kHz for 3 3/4 and 1 7/8 ips, and 3 dB up at 3.2 kHz for 7 1/2 and 15 ips). In addition there is a 6 dB per octave cut at low frequencies (3 dB down at 50 Hz). Standard playback tapes are recorded in such a way that an ideal reproducing head will give constant output with frequency.
Note that all recorders will have some additional playback equalization to correct for playback head losses.
It should be clear from Fig. 2 that the record amplifier requires a 6 dB per octave boost (3 dB up at 50 Hz) to compensate for the playback characteristics at low frequencies.
As mentioned previously the high frequency boost in Fig. 2 only partially compensates for the high frequency losses; additional boost is provided in the record amplifier. The record-amplifier response can be determined by measuring the record current in the record head. For this measurement the bias oscillator is disconnected. A low value of resistance is placed between the "ground" terminal of the record-head and "ground." The record-head current, in the record mode of the tape recorder, is proportional to the voltage developed across the resistance. A resistance value of 100 ohms or less can typically be used. It should, however, be made several times smaller than the d.c. resistance of the record-head, unless it is already an integral part of the circuit.
The measured record-amplifier response of the Revox recorder is shown in Fig. 3 and was essentially similar for both 3 3/4 and 7 1/2 ips. The curve indicates that tape saturation will occur more easily at both the low and high frequencies in comparison with the midrange. This is acceptable for many recording applications because most of the signal is usually in the mid-range of the audio spectrum.
Figure 4 illustrates record-playback distortion and saturation measurements at 7 1/2 ips. These were made by monitoring during recording. The curves below 1 kHz are input levels in VU for 1, 2 and 3% THD. The curves above 1 kHz are for input levels 1, 3 and 6 dB below maximum output. These latter curves were obtained by increasing the signal input until the playback output started to decrease, and then decreasing the input until the output is decreased the appropriate decibels below the peak output level. In general the THD measurements have little value at the higher frequencies, and the saturation measurements have little value at the lower frequencies.
It can be seen that the 6 dB below maximum output curve makes a good match with the 2% THD curve. This combination was used for all subsequent work.
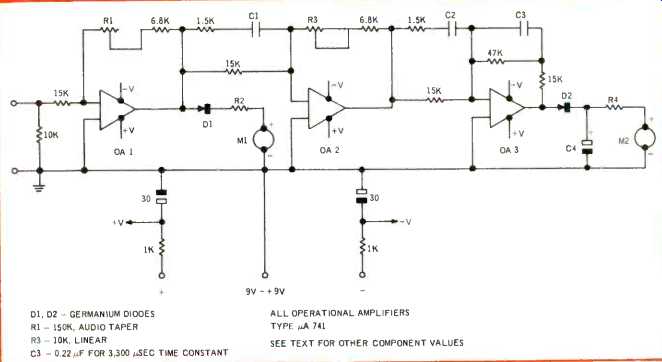
Fig. 5--Compensated peak-reading meter circuit. The circuit provides
for both peak-reading and average reading capability.
The advantages of peak-reading meters are obvious. It should also be obvious from the above that the meter amplifier response should compensate for the distortion-saturation curve of the tape. Such a meter circuit will allow the maximum possible recording levels while minimizing distortion caused by transients and tape saturation.
Comparison of Fig. 4 with Fig. 3 shows that the saturation response characteristics relate closely to the record-amplifier response characteristics. Thus either the record-amplifier characteristics or the distortion-saturation curves can be used to determine the compensation for the meter amplifier. The latter, however, is considerably more accurate because it includes the complete record-playback response.
Compensated Peak-reading Meter Circuit
The complete circuit is shown in Fig. 5 and includes both an average-reading and a compensated peak-reading meter.
It is based on inexpensive operational amplifiers, namely the µA741, and simple RC networks. The µA741 is particularly useful because it is internally compensated and therefore requires a minimum of external components. No attempt has been made to correct for d.c. offset or bias current because of the relatively low d.c. gain.
Meter MI can be omitted if the average reading capability is not desired. Alternatively a single meter can be switched to provide either average-reading or peak-reading.
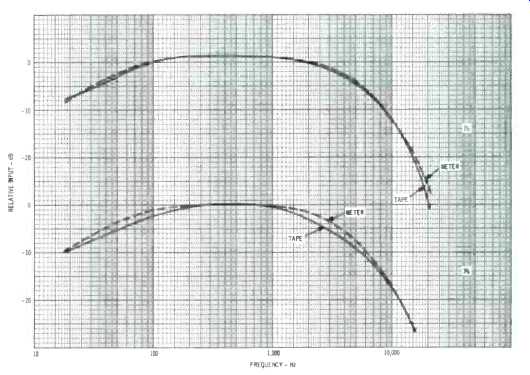
Fig. 6--Comparison of tape saturation characteristics with meter circuit
compensation. The solid curves correspond to the distortion-saturation
characteristics of the tape; the dashed lines correspond to the meter
amplifier equalization.
The first stage (OA1) has an input impedance of 6 kilohms and provides a low output impedance drive for the average-reading meter and for the following stage. An input capacitor should be used if d.c. components are present in the input signal. Potentiometer R1 provides a first stage gain which is variable from -7 dB to +20 dB. Potentiometer R3 gives a second stage gain in the range-7 dB to +t/ dB. This is used to calibrate meter M2 relative to meter M1. Operational amplifier OA3 provides a low impedance drive for the peak-reading meter M2. Low frequency boost results from C3 in series with 15 kilohms. A 0.22 µF capacitor gives a time constant RC = 3,300 µSec, which is close to the NAB standard of 3,180 µSec. The 47 kilohms resistance in parallel with C3 limits the extreme low frequency gain in order to prevent low frequency instability.
High frequency boost, at 6 dB per octave, results from C1 in parallel with 15 kilohms and by C2 in parallel with 15 kilohms. The ultimate boost is therefore at the rate of 12 dB per octave. The 1.5 kilohm resistors in series with C1 and C2 limit the maximum gain in order to prevent instability at the extreme high frequencies. Capacitors C1 and C2 are chosen so as to give the best fit to the distortion saturation curve.
This can be done either by calculation or by "trial and error." Series meter resistors R2 and R4 should be chosen to allow full scale meter deflection (+3 VU) for an rms input signal of about 1 volt at the meter diode. The meters used in the design were inexpensive d.c. microammeters with VU scales. These had full scale sensitivities of 400 µA (for +3 VU) and d.c. resistances of 650 ohms. It was found that 470 ohms was a suitable value for R2 and 2.2 kilohms for R4. A value of C4 = 60 µF was found to be satisfactory. This provides a decay time constant of RC =0.17 sec (since R=2.2 kilohms + 0.65 kilohms) for the peak reading meter. A decay time-constant of about 0.2 sec appears to be the optimum value for most recording applications. The measured charge time-constant was about 15 mS and corresponds to an equivalent input resistance of about 250 ohms. The limitation here is the particular diode used for D2 (a small signal germanium) rather than the operational amplifier. The measured effective 0A3 output impedance is considerably lower than 250 ohms. Although it doesn't appear to be necessary, the transient response can be improved by decreasing the charge time. This can be done either by use of low forward resistance germanium diodes or by the use of more sensitive meters. The latter will allow the use of a larger value of R4 (and also R2), and therefore a smaller value of C4.
A constant input with frequency gives a constant average reading. The relative input required to give a constant indication on the peak-reading meter is shown in Fig. 6 for both 7 1/2 and 3 3/4 ips.
The solid curves are distortion-saturation curves derived from Fig. 4 and similar data. The dashed curves represent measurements which give the relative input required for a constant peak-reading indication. For 7 1/2 ips, C1 and C2 were each chosen to give time constants of RC = 25 µSec. There is clearly an excellent match between the tape saturation curve and the peak reading meter compensation. For 3 3/4 ips, C1 was chosen to give a time con stand of RC = 37 µSec. The match here is good but can obviously be improved by some adjustments of the time constants. Clearly the appropriate time constants are determined by the tape speed, the particular tape used, and by the tape-recorder characteristics.
It should be noted that the roll-off on the saturation curves occurs at lower frequencies with decreasing tape speeds. Thus frequency compensated meter circuits are particularly essential for quality recording at the lower tape speeds.
Performance
A two-channel system was built for stereo recording. Initial test recordings helped establish the optimum relative mid-range sensitivity between the average and peak-reading meters. As a result of these tests the peak-reading meter was calibrated to give a reading of-3 VU at 400 Hz for an average reading meter indication of 0 VU. From inspection of Fig. 2 it can be seen that a peak reading of 0 VU corresponds to about 1% THD at all frequencies, and +3 VU corresponds to about 2% THD at all frequencies. Here the saturation is considered in terms of the equivalent THD because this will directly determine the magnitude of the intermodulation products.
Several live recordings have been made at 7 1/2 ips and the results have been most gratifying. If the peak-reading value is always kept below about +2 to +3 VU, then there is negligible audible distortion. The distortion increases rapidly when the recording levels are increased above these levels.
Various types of live concerts were used. An organ recital provided an excellent check of extreme low frequency behavior. The highest average recording levels were reached with the pedal tones. The compensated peak recording levels were generally 4 to 5 VU above the average readings (actual difference is 7 to 8 dB!), even on sustained notes.
Several recordings of mixed choirs indicated that the average and compensated peak readings are generally comparable (actual difference 3 dB). Occasionally, however, the compensated peak readings were 3 to 4 VU above the average readings (actual difference 6 to 7 dB!). With woodwind quintet it was found that both readings were also generally comparable (actual difference 3 dB). Only rarely did the peak indication exceed the average indication.
In summary it was found that average-reading meters on a professional quality tape recorder could achieve excellent recording quality at 7 1/2 ips, provided that the 0 VU indication was set 8 dB below 3% THD at 400 Hz, and that the signal levels were always kept below 0 VU. With average program material, where the low and high frequency components were of relatively low intensity, this results in a sacrifice of 3 to 4 dB in signal-to-noise ratio.
More dramatic differences will obviously occur at slower tape speeds because the high frequency roll-off occurs at lower frequencies.
A major advantage of the system is the complete confidence and ease of operation that it provides during recording because there exist well defined limits on the maximum recording levels.
Thus the compensated peak-reading meters allow utilization of the full signal-to-noise capabilities of the tape under all recording conditions.
It should be noted that the cost per channel is quite modest even though the circuit contains more components than absolutely necessary. This was done in order to keep the design as simple as possible and also to achieve maximum flexibility. A more sophisticated design can obviously result in a considerable reduction in the number of components, and consequently in the cost.
==========
(adapted from Audio magazine, Oct. 1972)
Also see:
The New Level Meters (Dec. 1980)
A Dynamic Noise Filter for Mastering (June 1972)
Noise Reduction Techniques (Oct. 1972)
Dolby B-Type Noise Reduction System (Sept. 1973)
Dolby B-Type Noise Reduction System--Part 2 (Oct. 1973)
Introducing Dolby S-Type Noise Reduction (Jun. 1990)
EQ & NR: Striking A Balance (Aug. 1988)
Deck to Deck Matching and NR: Straightening the Mirror (Aug. 1986)
= = = =