DAVID GRIESINGER
How to Build and Use a Sound-Level Meter with One-Third Octave Filters
-----------
SPECIFICATIONS
Sensitivity 30 to 120 dB SPL when used with microphone having sensitivity of -60 dB re 1V/µbar
Frequency Range 20 to 20,000 Hz in three ranges
Frequency Accuracy ±10%
Input Impedance 100 k-ohms at Mic input 1.0 Meg at high-level input
Power Required 9V at 2.5 mA from transistor radio battery. Life about 10 hours.
------------
MOST SERIOUS RECORDED-MUSIC listeners are aware that the sound they eventually hear depends to a large extent on the acoustics of their listening room. Even after determining the best possible placement for the speakers, and perhaps adding some drapes or a rug, the system as a whole can sound muddy, or lack the lifelike quality of the more-fortunate systems. True realism depends on having a flat frequency response where you listen, and most rooms will not cooperate. Fortunately, frequency response is easy to vary electronically.
Several devices have appeared recently which are intended to deal with this problem, and simple electronic filters are really quite easy to make. Unhappily, adjusting such a filter can be frustrating. It is difficult to determine just what corrections to make by merely listening to music. One of the most meaningful ways of measuring the frequency response of a hi-fi system is to measure the response of the system to narrow bands of filtered noise. The little instrument described in this article, when combined with a high quality omnidirectional microphone, is capable of making this kind of measurement as well as many others. The sound level meter is not tricky to build, and should cost less than fifty dollars.
All the meter needs to measure room response is a calibrated preamplifier, a tunable active filter, and a VU meter. To measure the sound levels of music and machines, a bass filter is included to give the standard "A" weightings. The result is a true sound-level meter, capable of measuring sounds down to 20 dB SPL and third-octave noise down to 0 dB SPL. With a microphone sensitivity of -60 dB re 1V/pbar, this corresponds to a pure tone input of only 0.18 µV rms, making it possible to measure the noise output of almost anything.
Before describing the circuit, I think I should say something about the way the instrument is to be used, and how that use determines the choice of microphone.
Figure 1 shows the response of my living room to pure tones and to third-octave noise, with the mike placed where I do most of my listening. The wide variations in the pure-tone response exist in all rooms, and correspond to resonances or standing waves similar to the ones in organ pipes. The number of possible frequencies for these resonances or standing waves is very large, since the sound wave can bounce around the room in many directions, using combinations of the walls, floor, and ceiling as reflectors. We hear the combination of all the reflections. For some frequencies, these reflections add up in phase, creating a peak, and for others they cancel each other out, giving us no sound at all. The ear is much more sensitive to peaks in the response than to dips.
Above 200 Hz the response to pure tones looks similar, except that it becomes rather difficult to measure. The variations in the response get very close together on the dial of the oscillator, and unless you tune very slowly it is easy to miss them entirely.
Fortunately, music sounds much better in such a room than this curve would seem to predict. Musical tones are continuously changing, and the individual resonances do not have time to build up.
The response that we subjectively hear is the average of nearby resonances, and is a lot smoother than the pure-tone curve.
Unfortunately, it is still not very flat. To measure accurately how a room sounds to music, one must use tones which resemble music in the way they waver.
Although music generally wavers about a semitone, or a twelfth of an octave, noise filtered through a third-octave filter gives good results. Figure 1 shows that the third-octave curve follows the response to pure tones. The noise curve may look smooth, but it must be treated with respect. A dip or a peak of three decibels in a third-octave-noise curve is almost always audible, especially if it occurs between 300 and 2000 Hz.
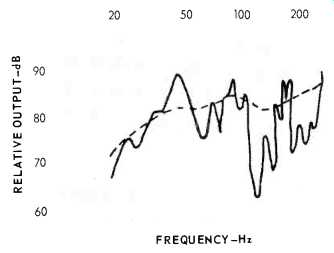
Fig. 1--Low-frequency response of the author's room with AR-5 placed near
a corner and microphone at room center. (- 1/3 octave noise;--pure tones)
The basic principle of this discussion has been that sound in a room does not simply come from the speaker to you, but forms standing waves which surround you. To measure the intensity of the sound correctly you must use an omnidirectional microphone. Cardioid microphones have a predictable response in a very large room or in an anechoic chamber, but when put into a standing wave their output can vary widely.
Microphone Selection
The microphone used must be at least as good as the system you are trying to measure. Fortunately, there are many high-quality omnidirectional condenser microphones available. These microphones have been designed for recording, but they can easily be used for sound measurement, especially if you do not need to know the absolute level of the sound.
There is a complication to using a recording mike. Any omnidirectional microphone is only really omnidirectional at low frequencies. When the wavelength of the measured sound becomes close to the diameter of the microphone, diffraction effects tend to reduce the response to any wave which does not come from the front. If the sound in your room comes from all directions, some roll-off to the measured sound will be noticed at high frequencies. To compensate for this effect some manufacturers build a treble rise into the response of microphones designed to measure noise. These mikes, such as the B&K 4134, are flat to randomly incident noise (Fig. 2). Recording mikes are usually closer to the B&K 4133, with a flat on-axis response. Most people would shudder at a treble rise in the on-axis response, although when using an omnidirectional mike in a large live hall some treble boost is often necessary.
Notice from Fig. 2 that diffraction effects depend strongly on the diameter of the microphone. B&K types 4131 and 4132 are one-inch microphones, 4133 and 4134 are half-inch, and 4135 and 4136 are quarter-inch. For a microphone of 0.75-inch diameter or less, these diffraction effects occur mostly above 4 kHz, and are serious only above 10 kHz. The sound in a room is usually not omnidirectional at those frequencies. Some loss of treble will be noticed due to the nature of the microphone, but if it is pointed directly at the speaker this roll-off is not too serious. In any case it is not possible to predict exactly how much it will be.
When making measurements at these frequencies it is better to look for the smoothness of the response. If you want an exact number, the best way to get it is to point the microphone 90 deg. from the speaker, and correct the resulting measurements for the response of the microphone to randomly incident noise.
Some microphone manufacturers supply such a curve with the mike. For those which don't, it tends to be close to the response to pure tones at 90 deg. incidence.
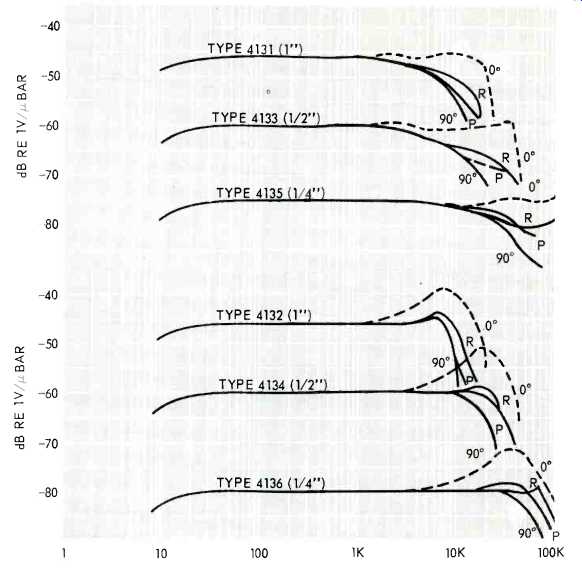
Fig. 2--Typical frequency responses of some B & K condenser microphones.
0°=free-field response at 0° (normal incidence); 90°=free-field response
at 90° (grazing incidence); R=random incidence response, and P=pressure response.
The condenser microphone chosen should have a well known on-axis response, and be 0.75-inch diameter or less. If you intend to make a large number of speaker measurements, a 1/2-inch sound measurement microphone might be a good investment. Otherwise it would be wise to choose your microphone for its use in other applications, such as recording. Remember that good omnidirectional microphones of similar diameter and flat on-axis response will sound identical.
Cardioid microphones are currently popular, but I prefer to use an omni wherever I can. They tend to add echo in a natural way, and lack the increase in bass when close to the source of sound.
Making the Measurements
Making speaker measurements is delightfully simple. You just feed some source of broad-band noise into the speaker system, and measure the resulting sound with the meter. Noise which sounds uniform in frequency content and has equal energy content per third-octave band is called pink noise. If you have such a generator, use it. Otherwise, use the interstation noise from an FM tuner.
You may have to disconnect the antenna to get noise which sounds uniform enough. This noise is not pink, but you can correct your curves by measuring it electrically with the meter.
The microphone should be placed in the position you use for most of your listening. If you get too close to the speakers, interference between the drivers can give misleading results, although you can test for high-frequency dispersion this way. You should occasionally turn off the speakers to make sure that the background sound in the room is below the level you are measuring.
Measure each speaker separately, since they usually require different compensation. If you insist on having a composite curve for the whole system, be sure to set the tuner on stereo to get independent noise in both channels. Otherwise interference effects can occur.
The measured response is usually less than wonderful! What can you do about it? Try moving the speaker first. The standard things to try are lifting the speaker off the floor or away from the wall by a foot or so, to the long side rather than the short side of a room, or vice versa. You should avoid having two reflective surfaces facing each other. I prefer to make these changes by ear, using a choral recording or a record of a familiar voice.
Your response will probably still show various slopes in the midrange. These slopes are very important. Try varying both the settings of the speaker balance controls and the amplifier tone controls.
If you can't do much this way, you must add some compensating networks between the preamplifier and the amplifier.
If your preamp has low output impedance when compared to the input impedance of the amplifier, simple networks of the type shown in Fig. 3 will need no amplification. Often a simple network of this type can improve the sound greatly, especially when combined with changes in the speaker controls. More complicated filters can be built, but will require some amplification. See the article on integrated-circuit preamplifiers in the June issue of this magazine. When you are through you should have sound that is noticeably more natural. Don't hesitate to readjust your tone controls for individual records. Some speakers may have a hidden peak which makes the sound unpleasant, and records are often made with the treble boosted.
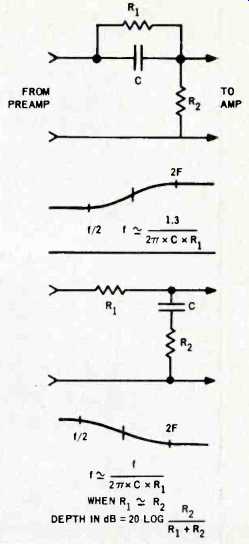
Fig. 3--Showing simple bass- and treble-boost circuits.
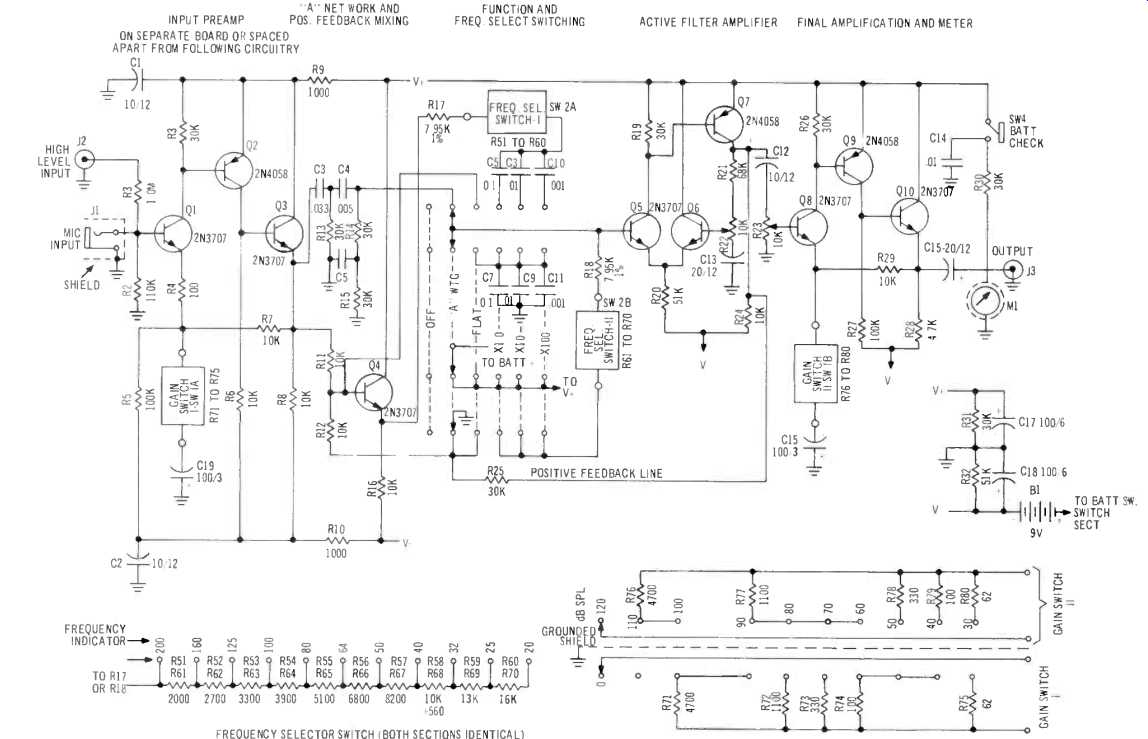
Fig. 4--Overall schematic of author's third-octave sound-level meter. Both
sections of frequency determining switch are identical The two sections of
the gain switch are shown independently.
Circuit Description
The circuit of the meter (Fig. 4) looks more complicated than it actually is. The original version of the device used integrated circuits, but it had more noise and drew more battery current than this one, which draws only 2.5 mA. The basic amplifiers are very easy to build.
The first three transistors function as a simple preamp. The gain is determined by the value of the first emitter resistor. Even though the overall gain varies from 200 to one there is no tendency to oscillate, since the first emitter resistor controls both the open loop and the closed loop gains. Because of its single ended input, when used at gains over ten this amplifier is capable of very-low-noise operation.
The next stage is both an amplifier and an active filter, and deserves some detailed explanation. Consider the circuit with the function switch in the first filtered position. Q. then acts as a simple emitter follower, and supplies signal from the mike preamp to the top of the frequency-selecting network. This network is called a Wien bridge. The top section, with the resistor and the capacitor in series, functions as a high-pass filter. The bottom section, with the resistor and the capacitor to ground, acts as a low-pass filter. Together the two networks form a band-pass filter with a center frequency given by f =1/2 pi RC. At the center of the pass band, the output of the network is in phase with the input, and has about one third the amplitude. Since both the high-pass and the low-pass networks have only one section, the slope of the sides of the band-pass curve is 6 dB per octave.
We can make the filter sharper by adding positive feedback. The amplifier which follows the bridge has a gain of about ten. Signal from its output returns to the input of the filter through the feedback mixing resistors R, and R,. When we add positive feedback the gain of the whole circuit is increased, but since the band-pass filter is inside the feedback loop the amount of feedback, and thus the increase in gain, is controlled by the network. The center frequency, since it has both the highest amplitude and the correct phase, is boosted the most. Frequencies far down on the sides of the band-pass curve get very little positive feedback, and are not increased in amplitude. Obviously, if the gain of the amplifier is set high enough to overcome the losses in the feedback mixing network and the Wien bridge, the unit will oscillate at the center frequency. By using just slightly less gain, you can make the filter as sharp as you want.
Setting the gain of the filter amplifier is equivalent to adjusting the Q of an LC resonant filter. You set the filter to give a third-octave pass band by setting an oscillator to the center of the pass band in one position of the frequency selector switch, and then adjusting the amplifier until the meter indicates 10 dB less when the switch is moved one-third octave either way. The resulting filter shape is shown in Fig. 5.
Notice that the bottom of the curve still has a slope of 6 dB per octave. Since the frequencies down there have no positive feedback, the slope of the curve is determined by the response of the Wein bridge without feedback. The slope could be increased to conform to the U.S. standard for sound level meters only by adding two more independent Wien bridges in series with the first, and that would make the meter much more complicated. Fortunately, this filter shape is adequate for measuring speaker response, and will also give useful results when used to measure most noises.
When you measure a noise in the flat or "A" positions of the meter, and then filter out all but a narrow band of frequencies, the power reaching the meter is lowered. This device compensates for this effect by raising the response of the meter to pure tones by 20 dB when you switch to a filtered mode. The addition of positive feedback causes the pure-tone gain to increase by about 14 dB, and the additional 6 dB is obtained by lowering the sensitivity when the meter is set to "flat." In this position, the feedback line is grounded, and R, and R, reduce the signal. Q, is bypassed to improve the signal-to-noise ratio. The "A" filter also reduces the signal, as well as providing the proper bass response for these measurements.
The amplifier which follows the filter adds extra sensitivity to the unit, and helps to keep the input preamplifier from overloading when there is a strong signal outside the pass band of the filter. The rather strange way the gains of the two amplifiers have been staggered represents a compromise between optimum signal-to-noise ratio and freedom from overload.
The output of the final amplifier goes directly into a standard VU meter. These meters are damped to have a relatively fast response, and when measuring low frequency noise the meter tends to jump around quite a bit. However, I found that it was not difficult to average the swings by eye, and no attempt was made to give the meter a slow response. Any standard VU meter will work in the circuit, although the damping in the cheaper models tends to vary from unit to unit.
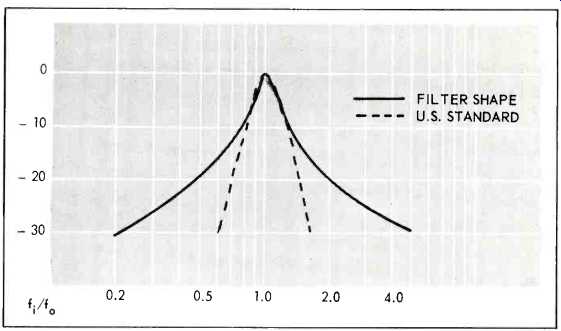
Fig.5 --Filter shape of sound-level meter comp a red with curve for standard
third-octave filters. Note that skirts of the curve do not continue at the
same slope, but instead decrease to a slope of 6 dB per octave.
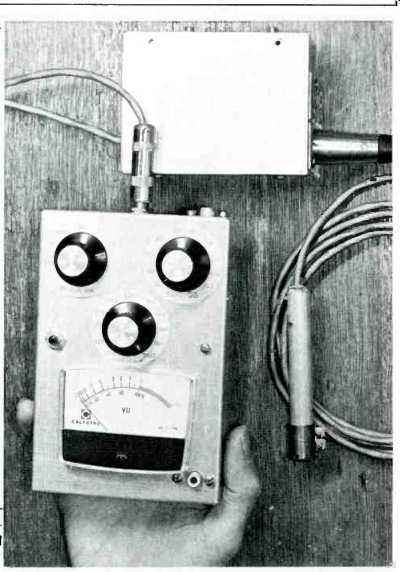
Fig. 6--Completed sound level meter with condenser microphone and its power
supply.
Construction
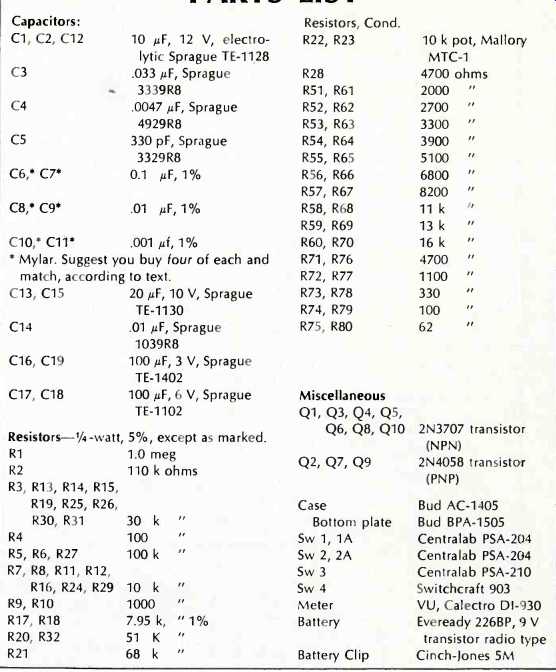
Building the circuit is rather straightforward, and many alterations are possible from the parts listed. The suggested case is only 4 x 6 x 1.5 in., but it is not too crowded if the PSA switches are used. A larger case could be used, but if it is plastic it should be lined with grounded foil. The transistors listed have very low noise, and are inexpensive.
Make sure you use Mylar capacitors in the bridge. Ceramics types have too great a power factor. No matter how you build the circuit it will work for measuring speakers, but the extra gain can be a lot of fun. To keep the device stable at the highest gains I was forced to add a shield between the sections of the sensitivity switch. I simply cut a piece of metal about 1 inch square from a can and added it like an extra wafer to the switch. A pair of 2-56 nuts on top of the shield ensure that it stays grounded. Since the works of a VU meter are connected to the output of the final amplifier, you may have to add a grounded foil shield around the case of the meter. I built the preamp and its power-supply-decoupling capacitors on a separate board, tucked behind the sensitivity switch. The input jacks and wiring should be shielded. The rest of the circuit can be built any way you want, except that the output of the final amplifier should be at least one inch from any of the filter parts. I built the rest of the circuit on a large board which attaches to the meter terminals.
For those of you who have not done much construction of this type, I highly recommend using Vector board and T28 subminiature clips. Make sure you also use an insertion tool. Figure 6, A-D, shows how I built the filter amplifier.
Calibrating the instrument is simple, although there are some tricks to making the device work properly at all settings of the switches. First, the 8 k resistors in the frequency-selecting network must be matched to within 1 percent. If the selectivity (or the sensitivity to pure tones) changes as the frequency-selecting switch is rotated, these resistors should be trimmed. Reducing R3 will increase the selectivity at the high-frequency settings.
Since you will probably want to make this resistor by putting two lower resistors in series, simply measure the resulting combination on a good ohmmeter, and adjust it to 8 k. Secondly, the ratios of the capacitors in the bridge circuit must be matched to within 1 percent.
If you can find a capacitance bridge, or 1-percent capacitors, use them. Otherwise, adjust the selectivity of the unit with the multiplier set on the lowest range. Then switch to the next range, and add small trimming capacitors to one of the .01 capacitors until this range has the same selectivity. You may have to readjust the oscillator to stay at the center of the pass band. Increasing the value of the upper capacitor will increase the selectivity, and vice versa. Then do the same for the highest range. When you are through, the meter should have the same selectivity and sensitivity to pure tones through the whole audio range.
The overall sensitivity of the unit is adjusted by using the cal potentiometer.
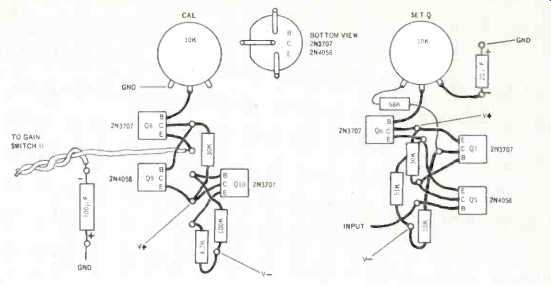
Fig. 6B--Layout of parts on Vector boards for final amplifier at left and
filter amplifier at right. Preamp section is similar to the final amplifier.
All layouts are designed to be maximally flat so cover can be slipped on
barely over the parts, thus serving as a shield.
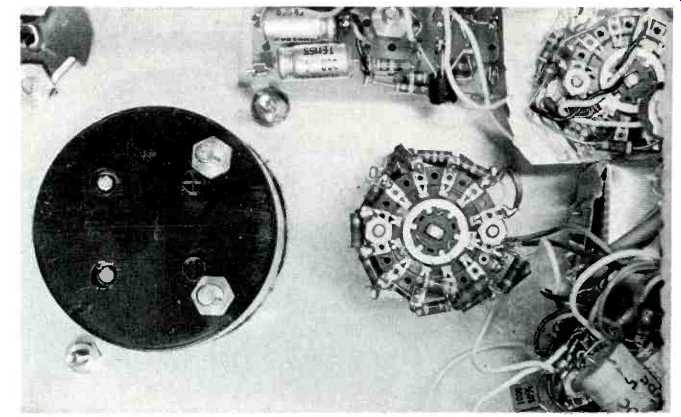
Fig. 6C--Start of construction, before Vector board is installed over meter
terminals. Note shield between sections of gain switch at lower left. Frequency-determining
switch is seen at upper left corner. Metal shield at left covers microphone
input jack.
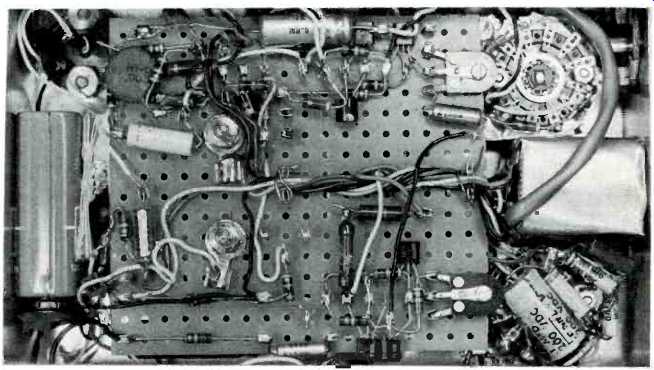
Fig. 6D--Vector board in place over meter terminals. Note similarity of
parts layout to drawing of Fig. 6B.
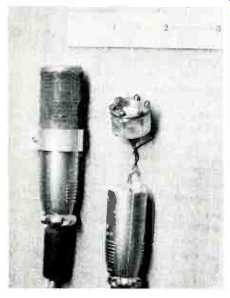
---- The author designed and built this microphone for use with his S-L
meter. The electronics are similar to an Altec 210.
To do this you will have to determine the sound pressure which corresponds to a voltage you can generate easily. Unfortunately, microphone specifications are given in many ways. Figure 7 may be useful. Sound measurement microphones without built-in transformers tend to have a sensitivity of about -60 dB re 1V/ u-bar, and the meter is designed around this kind of input. Many recording mikes have some 20 dB greater sensitivity due to a matching transformer. If your microphone is above -55 dB re 1V/µbar you should reduce the level to about-60 dB with resistors, or use the microphone without a matching transformer. One µbar is equivalent to 74 dB SPL, so a microphone of-60 dB sensitivity re 1V/µbar should have an output of .02 V rms at 100 dB SPL. This corresponds to .05 V p-p, so a 1-volt p-p signal into the high-level input should read 105 dB on the meter.
-----------
0 dB SPL=
20 microNewtons/meter^2=
2x10^-4 µbar (1µbar=dyne/cm^2)
Thus all the following microphones have the same sensitivity:
-60 dB re 1v/µbar
-40 dB re 1v/10 dynes/cm^2 1mv/µbar When using a transformer, multiply by the square root of the impedance ratio.
----------
Fig. 7--Some comparative sensitivities.
When you are through you should have a very useful instrument. Besides making many speaker measurements, I immediately used mine to shop for a really quiet air conditioner. I have used the meter to design low-noise mike pre amps, and for making signal-to-noise improvements in my tape recorders. One can easily calibrate it in microvolts, and use it as a very sensitive a.f. voltmeter.
Use your imagination!
PARTS LIST
(adapted from Audio magazine, Dec. 1970)
Also see:
The Function Generator (Nov. 1970)
Negative Feedback by Norman H. Crowhurst (Apr. 1970)
More on Negative Feedback (Feb. 1970)
Transistor Oscillators (Jun. 1970)
Negative Feedback by Norman H. Crowhurst (May 1970)
= = = =