With solid-state and modular receivers already on the market, a very considerable change will have to be made in the selection and shop use of test equipment to service these new products efficiently. With the low operating voltages (less than 1 volt) encountered in some semiconductor circuits, the gross inaccuracies of previous amateur gear, such as inexpensive meter kits and $150 oscilloscopes, are totally inadequate. Also, in such receivers you will find a growing number of 2 and 5 percent resistors, 5 and 10 percent capacitors, fine tolerance coils, and many closely regulated power supplies. If your service equipment can't be calibrated closer than these 5 percent average allowable circuit component variations, then many measurements will be highly inaccurate or completely worthless, and you won't be able to make the needed repairs.
True, module replacement will satisfy over 80 percent of the problems in the new receivers, but the other 20 percent (chassis breakdowns) will be extraordinarily difficult if your equipment isn't right. At the local distributor's, we're noticing more and more solid-state sets that have been badly "shot-gunned" by service people who either don't know how or refuse to use adequate equipment for almost any sort of repairs. The television business is a good business only if all test equipment is both relatively new and good, and servicemen are thoroughly trained in its use. Transistor and integrated circuit receivers simply require new and more sophisticated methods of attack with very modern waveform display devices and signal generators.
DC AMPLIFIER, TRIGGERED SWEEP OSCILLOSCOPE
During this discussion, we progress from the exotic to what might be termed "standard" service equipment to demonstrate what really can be done with the best, then with the above average but absolutely not second rate gear.
To use an oscilloscope effectively, you must exploit all of its advantages with considerable efficiency and be competent in interpreting what you see. Initially, any oscilloscope you use should have a 10-millivolt deflection factor, a bandpass of at least 10 MHz (plus or minus 3 db down) a calibration ac curacy of no less than 5 percent (with 3 percent preferred), and DC vertical amplifiers that are linear throughout from 10 millivolts to 20 volts or more (0.1 volt to 200 volts per division with a low-capacitance 10X probe). A dual-trace scope is preferred, but a single-trace model is acceptable, except servicing more than one section of a receiver at one time will be somewhat more difficult. A scope should have sufficient high voltage for full, fast trace resolution, some power supply regulation, calibration ranges that are easily set, and a horizontal sweep section and amplifier that will sweep from at least 0.5 seconds to 500 nanoseconds, with 100 to 200 nanoseconds favored. Those are the basic requirements, but you can be fancier if your pocketbook allows.
What's all this cost? Prices will range from $400 for a single-trace scope to $500, $600, $975 and up for the better dual trace units. The one we use first happens to be an exceedingly fine Hewlett-Packard Type 180 (Fig. 14-1) with 1801A dual trace 50-MHz amplifier and 1821A time-base generator, a package that's worth $2390. Obviously, we don't expect service people to buy "Henry's Mark 4," but something in between a great oscilloscope and an inaccurate AC-coupled excuse is most necessary and desirable. The Tektronix 7403N dual-trace scope, which we use later, is shown in Fig. 14-2.
Any serviceable oscilloscope has three outstanding uses: peak-to-peak voltage readings for AC measurements, DC readings for voltmeter measurements, and time-base readings for time and frequency measurements. Anything less, say AC only, actually is only one-third of an oscilloscope, and such basics are hardly worthwhile. Of course, the RMS (root mean square) work ability of a sine wave is equivalent to a DC voltage. So if your oscilloscope is calibrated in DC volts, for instance, the RMS voltage x 1.414 equals peak and X2 or RMS X 2.828 equals peak-to-peak.
Pulses and square waves go from one DC level to another, so the oscilloscope can follow these transitions also for ac curate readings. DC-wise, you simply set the amplifier trace at some point on the graticule, and the number of semi- or complete divisions the trace rises or falls is the positive or negative DC voltage, respectively. If you are looking at an AC waveform and want to know on what DC voltage it's "riding" or "hanging," simply flip the DC-AC selector switch, and the number divisions the AC trace goes up or down times the vertical attenuator setting tells you the DC level. When a trace (amplifier) is reading a pure AC input, the waveform is half above and half below DC reference level 0, or "ground." To demonstrate how an oscilloscope can be used to find trouble in tricky circuits, let's take the scope into a horizontal sweep system.
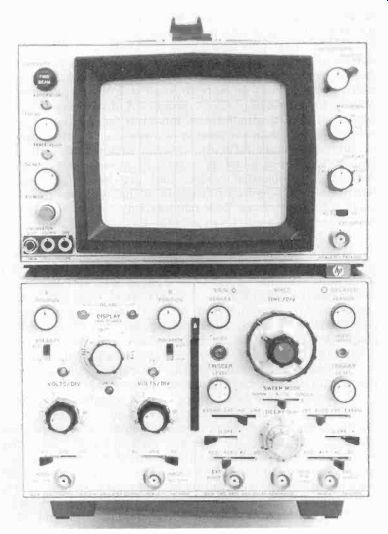
Fig. 14-1. H-P's 50-MHz dual-trace scope with A and B time bases, mixed sweep,
and a time base that (with 10X magnifier), will display waveforms at 10 nanoseconds
per division ($2390).
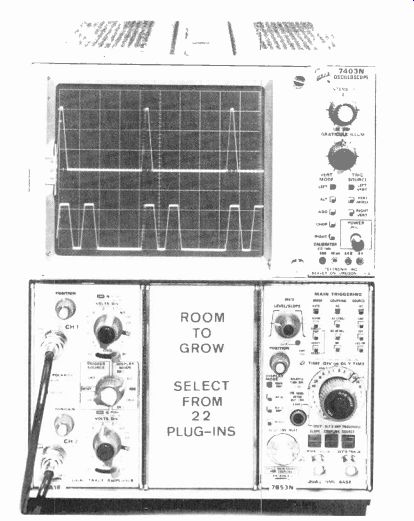
Fig. 14-2. Tektronix 50-MHz oscilloscope with three plug-in units. It is
accurate to 2 percent, with 1.22 cm per division. The unit ($1670 to $2200)
features an 8 x 10 graticule, 5 my per division vertical sensitivity, two time
bases, and room to grow.
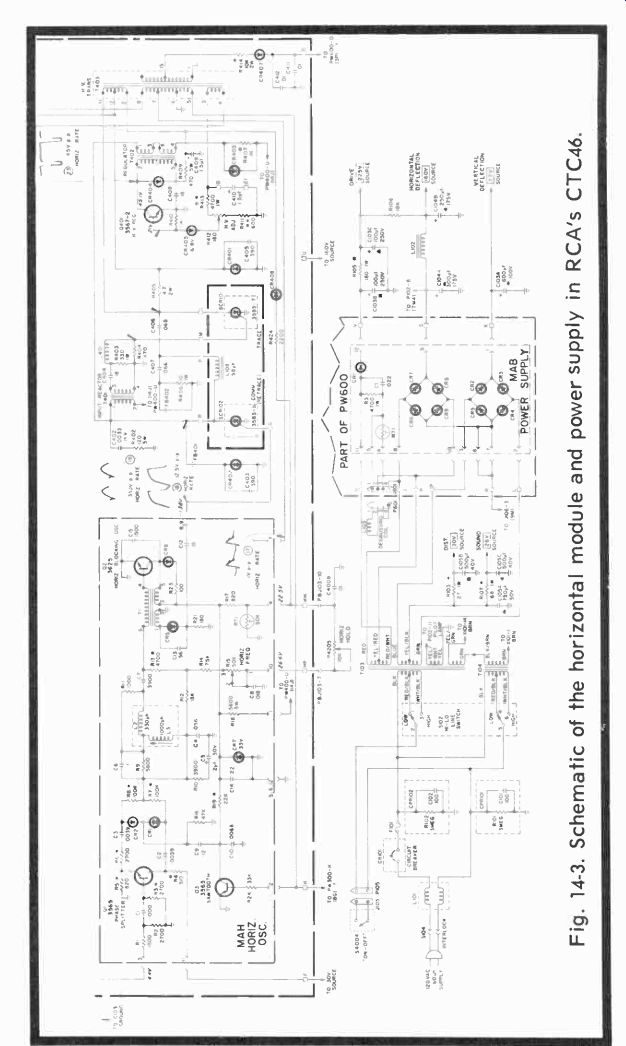
Fig. 14-3. Schematic of the horizontal module and power supply in RCA's CTC46.
A Cantankerous Case of Horizontal Flops
In the RCA CTC46, RCA's instructions for oscillator alignment are to bias off the incoming sync signal to the phase splitter, disrupt an RC time-constant to the sine-wave coil, adjust the horizontal hold for a slowly or non-floating picture, then do the same for the sine-wave coil, removing one jumper as each assignment is completed. That done, you hopefully turn on this completely IC and transistorized receiver, expecting the picture to be neatly framed. But, when this set was turned on (with antenna connected) the picture was somewhat out of horizontal sync, but in about 30 seconds corrected itself.
With a color-bar generator connected to the antenna terminals, the set was turned back on after a short turn off period. There was a distinct sync bend (possibly 60 Hz) that didn't go away for about 30 seconds. Now, theoretically, you should have one of two conditions: either the thermistor in the degaussing circuit (Fig. 14-3) is faulty or there is a bad filter capacitor in a 60-Hz power supply line. If you go back to the MAH horizontal oscillator, you'll see what appears to be a flyback pulse feed to the blocking oscillator through CR408, but that isn't the real circuit at all. You'll also discover that the 22.5 volts shown on the schematic turns out to be nearer 33 volts, since there is a zener regulator (CR7) for this entire line connected from one end of R17, with a 50K thermistor to ground from the other end and this won't produce much of a voltage drop. CR408 turns out to be an AC blocking diode and is the pathway for the high-voltage regulator collector supply. If you measure across 5-watt R409, you'll find only a difference of 48 to 56 volts, which is a bit of a startler when you're expecting something else. But, indeed, it's perfectly all right.
Right away you begin to question the presence of any 60-Hz stray hum in the circuit-and there can't be any, since both the 160-volt and 30-volt sources originate from bridge diode rectifiers and these just don't produce 60-Hz ripple unless one of them is defective. However, if that were the case, you wouldn't have 160 volts varying slightly with signal because of non-regulation and a 30-volt source that does the same, but with less magnitude because of the lower voltage and additional filtering and, therefore, more regulation.
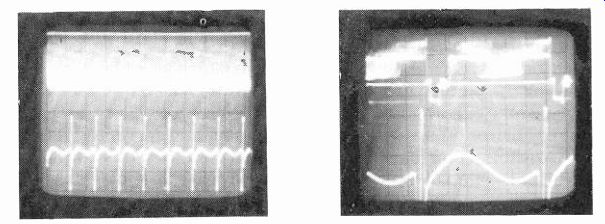
Fig. 14-4. Horizontal oscillator sine-wave outputs with all tips equal. Fig.
14-5. Video and sync at 10 milliseconds per division. Top amplitude 2v per division;
the bottom is 0.5v per division.
If we jump to the top of zener regulator diode CR7 and find 33 or 34 volts there, the entire module is getting all its rightful voltages. After this, we can profitably examine both the video and horizontal oscillator waveshapes at the junction of C7, R11, and L2, the output portion of the sine-wave coil we have always tuned so that all peaks are on an even plane. In Fig. 14 4, the top trace was picked up at the sync separator. We increased the scan rate of the scope to 10 microseconds per division (Fig. 14-5), and the horizontal oscillator waveform and the video appeared spread out. The waveforms in Fig. 14-5 are something exceeding one line of video information and a little more than one cycle of horizontal oscillation-both relatively normal, except the difference in peaks of the oscillator transition amounted to 0.6v at one half volt per division. But since we had just retuned the entire oscillator according to RCA's instructions, we let it go temporarily. The video looked good and the burst on the sync pulse back porch is outstanding. The small overshoot at the trailing edge of the horizontal sync pulse can be ignored since it is in the no-picture period anyway and could not be seen.
For curiosity (Fig. 14-6), we turned to another station, using the same scope time interval, but not the same amplitude on the bottom trace (1-v per division), and found the horizontal sync pedestal more uniform but the 3.58-MHz burst was considerably lower in amplitude. Yet, strangely enough, if you went to the broadcasting station, they would probably have the magnitude of this "varying" color carrier exactly right. And this simply means that in your local area, you'll have to learn (on a good receiver) the nominal signal inputs from the antenna and what to expect in the way of normal or seemingly abnormal transmissions. In Fig. 14-5, the top trace is set at 2 volts per division, with the zero reference at the center horizontal graticule line. The bottom trace is calibrated for 0.5 volts p-p, with the zero reference on the next line to the bottom.

Fig. 14-6. Same signals as in Fig. 14-5, but the waveform is calibrated at
2 volts, while the bottom is 1 volt. The receiver was tuned to another station.
Fig. 14-7. The top trace is the horizontal sync pulse; the lower trace is
the sine-wave horizontal oscillator output, 10 volts per division and 1 volt
per division, respectively. Time base, 10 microseconds per division.
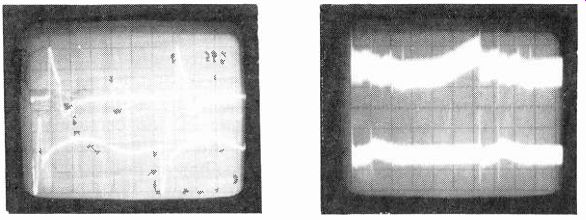
Fig.
14-8. Waveform at the top (5v per division) was observed at the base of the
phase splitter. Jitter is normal for AFC diodes and this type of circuit,
since frequency searching is continuous. Fig. 14-9. Normal ripple of 0.5v
per division in the 160v supply and 0.2v per division in the 30v sup ply;
top and bottom traces, respectively.
A picture of one almost complete horizontal line sweep interval (at 10 microseconds per division) is seen at the top in Fig. 14-7 (10v per division). The sine wave (bottom, 1-v per division) was set for equal peaks, just for curiosity. The 30-volt horizontal timing pulse was all right, but the sine-wave coil tuned for symmetrical peaks just didn't work out. So we retuned for the unsymmetrical waveform and took a look at the horizontal sync pulse through the differentiating network and at the base of the phase splitter transistor, Fig. 14-8. It's total amplitude was 15 volts p-p, and the 45-microsecond straight line portion was just about at DC. So certainly the amplitude is sufficient, even though the trailing edge of the pulse (at 10 microseconds per division) has an initial fall time of almost 10 microseconds before its down time becomes steeper and the total fall width is only about 5 microseconds.
Suppose it had been 10 or more? Wouldn't this have caused all sorts of sync problems? It certainly would have.
What about the power supplies? Do they come on instantly when the receiver does? Any unusual ripple or transients getting through? As previously checked, the DC values were entirely adequate, and both 160-volt and 30-volt supplies appeared immediately when the on switch was engaged. What about ripple? The top trace in 14-9 was set for 0.5 per division AC only, and the bottom at 0.2v per division AC only. So in the top trace you have some 0.7v ripple and bottom about 0.2v ripple with, of course, some 1.5-volt SCR high-voltage spikes that don't show up on the other sides of the decoupling resistors, such as 5-watt R18 (the 160-volt input) and R4, the 30-volt input. It's also possible that the SCR spikes were picked up by the probes and not in the power supplies at all, but this isn't altogether plausible since there's no outstanding trace of the spiking problem once you're into the horizontal circuit. We did find, however, that the voltage at point HH was much nearer 30 volts than the 22.5 listed on the schematic-and as it should be because of the 33-volt zener (CR7) regulator. R424 is 3.3K and precedes CR408, being part of a time constant with filter C409.
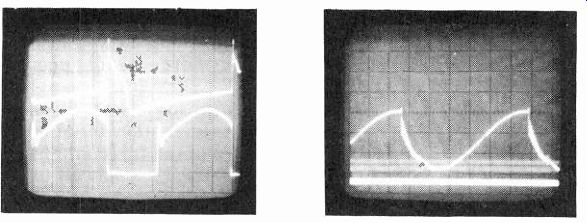
Fig. 14-10. The oscillator drive waveform (top, 2v per division) shows a
small spike trigger and retrace SCR output with small spike showing in the
oscillator forward trace one division past the center of the graticule. Fig.
14-11. These scope traces show the charge (faint trace) and discharge of C4008.
The 1.5v trace is the residual waveform.
How do we know the waveform spikes in Fig. 14-9, which are uniform distances apart (one in each cycle), are from the high voltage? Look at Fig. 14-10. The top trace is the horizontal oscillator drive to the SCR at 2 volts per division, point G. The bottom trace, at 100v per division, is the retrace SCR waveform. These traces are synced on alternate sweep cycles within the scope. You can see the small pip at about 15 microseconds of the conduction period (top) coincide with the trailing edge of the SCR waveform cutoff . In dealing with NPN pulse circuits, of course, the conduction trace is near or at 0 when the transistor is conducting, and at the power supply level when off. So here, the drive pulse is 6 volts and the retrace SCR goes for just over 300 volts p-p, with a conduction time of just about 25 microseconds, since the scope time base is set for 10 microseconds per division.
Now, what if the filter (C4008) at the end of the horizontal hold is defective? C4008 is connected to the forward-opening control panel, a rather formidable task, so it seems, to get to.
So use an oscilloscope to check the capacitor. In a DC condition such as this, the job should be rather easy. The nearest path to ground is through the 3.3K resistor, diode, and HV transformer, or through the blocking oscillator, itself, if it switches completely into saturation, something we don't (at the moment) know. But, say, we have a theoretical 50K resistance for this capacitor to discharge through. The time constant would be 0.01 x 10^- 6 x 0.5 x 10^-6 equals 5 x 10^-3 or 5 milliseconds. Now, it's true we can't tell if there is slight leakage, and there may be. But we can certainly tell if the capacitor is open or shorted, and here's how: Since we're dealing with a 30-volt DC swing, set the oscilloscope's vertical amplifier (using only one channel this time) to 5 volts per division (Fig. 14-11) so that the trace actually covers six vertical divisions, and it should do so in the time of 5 milliseconds or less. Turn the receiver on and see what hap pens. In this instance, the trace bounced up very fast. If you look sharply, you can see a slight and light wave reaching to about the sixth horizontal graticule division from the bottom.
The next test is to see if this capacitor discharges at about the same rate. When the receiver is turned off, the two "traces" near the bottom are actually the bounce and settled traces, with the more intense bottom band about 2.5 volts above zero reference, which is the bottom horizontal graticule line. So the capacitor doesn't discharge completely when the power supply is cut, but it does lose its charge rapidly enough to be evaluated as probably good.
What should this residual waveform look like? To show you (still Fig. 14-10, upper trace), we did another bit of trick photography, taking a double exposure of the trace amplified on AC only at 0.5v per division. As you see, it's a 1.5-volt trace with a sharp positive pip for at least a simulated sync pulse, followed by ringing during the downward conduction time and a smooth trace as the waveform ascends toward cutoff.
Shunting another capacitor across terminal HH to ground did reduce the amplitude of the waveform but seemed to increase the amount of the ringing. So we must presume the other inductance and capacitances in the circuit, including C4008, are possible ringers, too.
If you really want to check leakage here, just pull the MAH module and put an ohmmeter from HH to ground. In the open horizontal hold position, the measurement across both the control and to ground is 9K. In the closed (zero) position of the hold control, the measurement across the capacitor to ground is still 9K. R4205 should look almost like an open circuit, since it isn't connected to anything but CR408 and R424 plus the HV transformer. Let's make one final check. With the hold control closed (zero resistance) the measurement from terminal HP on PW400 measures 15K. Yet, there's the diode and resistor still connected to ground through the secondary of the high-voltage transformer, and this is the other 9K.
In desperation you could pull the control assembly from the back side of the chassis (it's held together by two 1/4-inch screws) and change this suspected capacitor; it may or may not do any good. The one in the circuit showed a slightly excessive power factor. For curiosity, we took the assembly and its connecting cables apart and changed the capacitor just to go through the process and to look at the quality of the part.
After finding the excessive power factor (dissipation the capacitor shouldn't have) the part was replaced, but with no real certainty this was a cure for the problem simply because the fault seemed too minor.
With the new capacitor installed, we decided to make two more checks: In Fig. 14-12, you see the blanking pulse (top) from the feedback loop on the transformer at 10v per division, at terminal H a total of some 30 volts, and this checks. Below it is the sawtooth output of Q3 at 5 volts per division. Both pulses are acceptable since they reach the proper amplitude; neither is on during the 11-microsecond horizontal blanking interval as you can see by the positive pulse off time of the upper trace and the Q3 cutoff before the linear rise of the bottom trace.
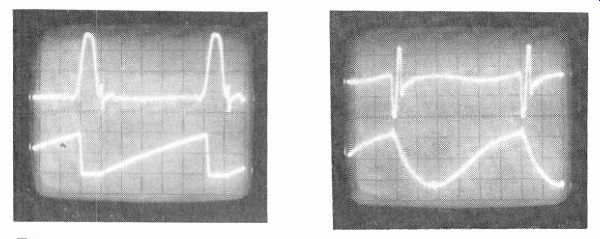
Fig. 14-12. High-voltage blanking pulse (top waveform) and sawtooth drive
(lower waveform). Notice that the drive "bottoms" no longer than
the period of blanking which is 10 microseconds. Fig. 14-13. Peaks are even
in the oscillator output (top), and the lower drive pulses are clean. But
this isn't the solution, believe it or not.
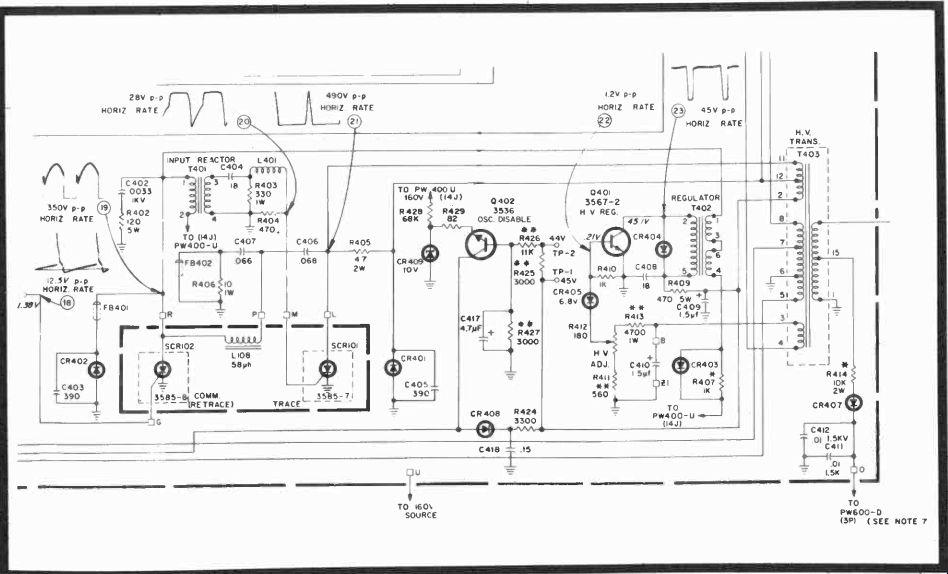
Fig. 14-14. CTC54 partial schematic with oscillator disable change included.
This will not be included on your CTC46 schematics since its a recent FCC
requirement.
Now, what about the linearity of the trace at the junction of the horizontal hold and our new C4008, after, that is, we re adjusted the sine-wave coil? Fig. 14-13 shows the results.
There is no ringing in the lower trace, and the upper sine-wave peaks are exactly even at the maximum points, touching the third horizontal graticule line from the top. Another interesting thing: The horizontal hold, if moved steadily across its total range, does not disturb the oscillator lock in the slightest. If moved fast and clicked at each end, however, it will throw the oscillator out of sync with about four or five broad horizontal bands. Are we really repaired? Well, let's let this "intermittent" be turned on and off at several long intervals for a while and we'll be positive.
Sometimes, such careful waveform analysis is entirely necessary. And when you're doing it, you have to analyze the circuit operation as well. It's also emphasizes the fact that many of these modular plug-in boards can be serviced while plugged into the receiver. It's simple to insert a substitute, but normal circuit problems are no more difficult than some much advertised "hand-wired" circuits. Actually, as far as the author is concerned, plug boards are easier to troubleshoot than the old point-to-point terminal strip connections. The big difference is that you just don't pull components off the boards and replace them at random. Many are specialized types, as you will discover by consulting the parts list, and others are unique enough so that only the manufacturer is your supplier.
Therefore, in the future, if the fault isn't on the board, try an analysis such as the CTC46 problem just demonstrated, and with a little practice many joyous things should come to pass.
We deliberately picked a problem that could have been in the AGC, sync separator, horizontal oscillator, a bad return winding on the flyback transformer, defective AFC diodes, or a few other passive components. Seldom do you collide with such stubborn, unyielding difficulties, since complaints ordinarily are directed at permanent breakdowns. But once in a while this is the case, and then you are stuck with the same sort of investigation just undertaken.
Meanwhile, we did find that resistor R10 had been changed from 3.9K to 1.2K, for some reason, probably to speed up the anti-hunt reaction, since this a shorter time-constant.
So we changed it to the original value for curiosity, and let the set rest.
Schematic Changes Unfortunately, changes are necessary. Manufacturers are faced with necessities and certain dictated changes once in a while and there's no help for it. Our problem (with all past waveforms still correct) was transistor Q402 on the PW400 deflection board. This transistor monitors the difference voltage, and, therefore, the current across R425, a 2 percent resistor. Under good working conditions TP1 measures some 44 volts and TP2 about 54 volts. Since this is a 3K resistor, and 10 volts is dropped across it, the current is 10 divided by 3 x 10³ or 3.33 milliamperes. Observe that zener CR409 should be an emitter reference of 10 volts also; consequently, the base-emitter potential is zero and the transistor is not conducting.
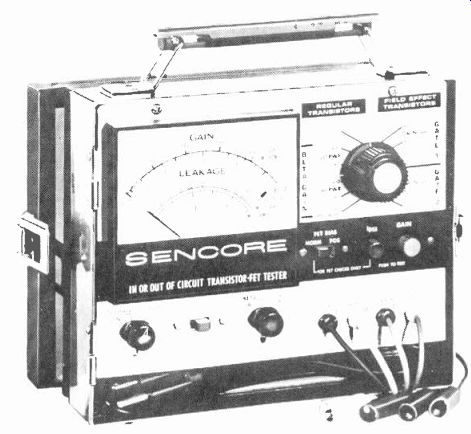
Fig. 14-15. Sencore's TF17 circuit transistor checker is handy for FETs and
bipolars when you're in semiconductor trouble.
Should the high voltage current increase, however, the voltage across R425 will also increase, forward biasing Q402 into conduction, but not saturation, and therefore NOT a severe 10-volt clamp. Since C417 removes all AC from the base of Q402, the forward bias would be straight DC. And this means that when Q402 begins to conduct, current flows through the collector and base into the emitter and across R429, causing a subtractive voltage drop in the 32 volts at HH (Fig.14-14) and throwing the horizontal blocking oscillator out of sync. (You might also say that any two positive voltages subtract.) So that's the story of the reluctant oscillator. CR401, by the way, can be involved here also, but undoubtedly in a much more decided way, since we doubt the oscillator would swing back into sync of its own accord. What happened here was that the transistor beta dropped from 200 to 20. Since it is a small transistor, and being partially on, it became more of a resistor than a transistor, and pulled the oscillator's DC voltage down so that the set had to run a bit before sync recovery. A transistor checker (Fig. 14-15) is very handy here when you aren't always sure. Also, diode CR409 must be very nearly 10 volts, not 9.2 or 9.5, or you're in real trouble! Later CTC46 chassis include this diode-transistor modification to prevent runaway high voltage and, thereby, remove any possibility of unwanted radiation.
The best way we've found to check the HV regulator action is to monitor the voltage between the emitter and base of Q402.
With a 68K R428 (ours measured 75K and we left it in the circuit), this voltage should be 8.5 and 9 volts either at the two electrodes of the transistor or as the drop between TP1 and TP2. Adjust the high voltage carefully with the brightness down, then recheck. If advancing the brightness control causes the Q402 base voltage to rise above its emitter, then the regulator is not operating as it should, and you should try a replacement.
The zener may be bad, too, so monitor both electrodes simultaneously. The regulator transistor, by the way, is something of a power transistor and will not check accurately except under load, so don't expect an ohmmeter to tell you anything, unless there's an absolute open or short. Use a good power transistor checker every time! This equipment, best used with the component out of circuit, will insure proper loading, sufficient current for a substantial test, and give you a quality indication of what both power and small signal FETs and transistors can really do. An ohmmeter is only a very poor, inadequate last resort.
As for the actual horizontal oscillator alignment, you have to put the first peak about 0.5 volt higher than the second peak just before retrace as shown in Fig. 14-5. Afterwards, check to see that the receiver when turned off does NOT lose sync as the raster is extinguished, but lets the entire picture collapse as originally framed under full power. This latter is the acid test, not only for this receiver but for any B&W or color receiver.
While we're on solid-state horizontal and high-voltage problems, RCA Technical Manager, H. C Horton describes what might have been identified heretofore as output Barkhausen oscillations, snivets, squiggles, etc., in the older tube receivers. Here, we'll just call these various straight and bowed lines that sometimes show on weak signals as high voltage interference. See Fig. 14-16. In another instance, the author found that the green MAD module had become weak and developed some oscillation that also showed as a squiggle on the right side of the screen. A replacement, of course, cleared the trouble and also brought up the green gun considerably.
POINTERS ON ALIGNMENT
As with troubleshooting, you cannot use antiquated equipment for alignment. A lot of very useful sweep alignment gear has now appeared on the market. There's RCA, Lectrotech, Heath, B & K, Sencore-to name a few, plus some imports. So there is competitive gear from which to pick. But you should make some sort of educated selection, depending on anticipated reliability, accuracy, utility, and what you need to spend. Again, as in selecting an oscilloscope, you're going to get what you pay for. A pinched dollar buys a cheap product, and a "cheep" sweep generator just doesn't do the whole job not if you're a professional. Top service equipment sweep and markers cost between $400 and $500 (round figures), and there's no way around it. Combine this with $500 to $700 for a really good dual-trace oscilloscope, a crack color-bar generator, and you have between $1,000 and $1,300 invested already, and this is precisely what it's going to take (1972 prices). How do you select a good sweep generator? We can't give you all the answers, but here are some pointers to help.
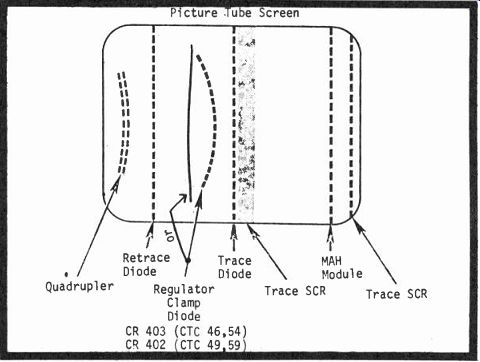
Fig. 14-16. Vertical interference lines are caused by trouble in a solid-state
receiver's horizontal sweep system.
Voice-coil driven capacitors and inductors are simple, inexpensive, and easily designed. The vibrator can be either a capacitor or coil. Possible problems are caused by too much mechanical vibration, poor linearity, and inductors used as tuners. Needed is a heavy duty voice coil magnet and small diaphragm movement for best results.
Saturable reactors, the "increductor" types, are still used to some extent to produce IF and VHF frequencies. They are both simple and reliable over their limited range. However, saturable reactors often have low Q and are subject to possible drift problems and residual FM developed from surrounding magnetic fields. On the other hand, there are no vibrations because the sweep is electronic, and very slow sweep rates are practical. The output usually is both flat and linear, if the design is good.
Solid-state generators with saturable reactors and varactors have little drift, almost nonexistent heating problems, frequency ranges from low MHz to microwave frequencies, and individual frequency oscillators, or several, depending on the sweep ranges needed or desired. Combined with switch-activated crystals at close to .005 percent ac curacy, this type of generator is highly desirable. However, if a generator has individual crystal-controlled RF oscillators, the channel selection will often be limited. And if oscillators are varactor tuned, there may be some spurious marker beats here and there that you must learn to recognize. Naturally, the warm-up time is very short, and the crystals and the oscillating circuits seem to stabilize rapidly. The overall flatness of the sweep output is a good thing to see, as is the range of most generators.
Markers are one of four types (Fig. 14-17)-birdie, absorption, pulse, and intensity. Pulse markers sweep (or ring) a crystal-tuned circuit; birdie markers mix a sample of the sweep signal with the crystal frequency output for a beat; absorption markers cause a frequency suckout on the swept waveform; and intensity markers are applied to the Z axis input on an oscilloscope's cathode ray tube. For accuracy, you must have all crystal-controlled markers. A general slide-rule or "machined" metal dial is not sufficient-it can't be! Most generators, by the way, provide birdie markers, and these are fine if you can control the amplitude and width completely, and if you can turn them 90 degrees (sideway) for the steeper portions of any well-trapped response curve. You'll see why shortly.
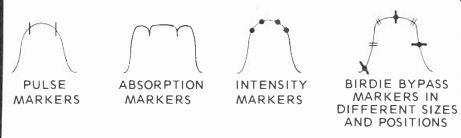
Fig. 14-17. Various types of markers are used. Markers must be added to the
response curve only after the sweep has passed through all tuned circuits
to prevent distortion.
The Sencore generator (Fig. 14-18) uses a birdie bypass varactor sweep system, and you'll see both vertical birdies and horizontal birdies.
Do you really need to align? That's the biggest question that has to be answered. What are the criteria?
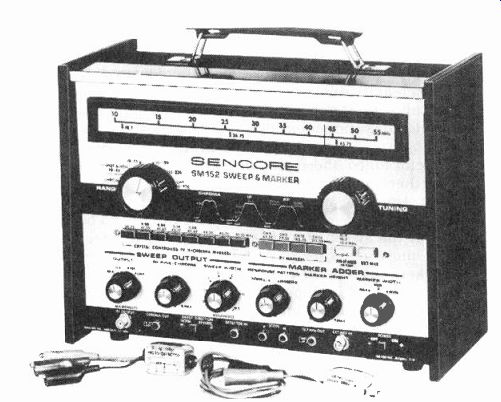
Fig.
14-18. Varistor tuned SM152 Sencore sweep, crystal-controlled marker generator
with ranges from 10 MHz to 900 MHz. It contains 13 close frequency crystals
with both vertical and horizontal markers, virtually flat output. ($459)
Does the receiver have good picture definition, but just weak?
Picture quality is poor, but the fine tuning has little video effect?
Some channels are OK and others poor?
Vertical or horizontal bars in the picture?
Bad horizontal or bad vertical sync?
Good video but sound bars in the picture?
Dark picture, good detail, brightness or contrast un changing?
Colors washed out, video good?
Color fringing, sound and picture OK?
If the receiver has any or all these faults, you don't need to do an alignment! But you must look at:
Video amplifiers, AGC, or RF amplifier.
If the fine tuning won't take the sound bars out, tune the 4.5-MHz and-or and 41.25-MHz sound traps. Or, you may have a component breakdown.
You have horizontal or vertical troubles, usually, if the sync is bad one way and not the other. If sync is bad both ways, of course, it can mean anything from AGC troubles to a faulty sync separator, etc.
A dark picture has to do with AGC, overloaded video amplifiers, insufficient high voltage, or a shorted picture tube.
Poor colors are probably the result of bad chroma amplifiers; mixed up colors can be trouble in the demodulators; no colors may be trouble in the 3.58-MHz oscillator, or a lack of chroma bandpass response.
For color fringing trouble, check the static and dynamic convergence.
A smeary picture without sound interference often comes from the video amplifier and can be due to defective peaking coils, leaky and open capacitors and bad load resistors.
You may definitely need alignment IF:
The picture quality is poor and fine tuning does affect definition and possibly contrast.
Poor, grainy picture, touchy sound, wavery sync.
The IF link may not be aligned in older receivers after a new tuner is installed.
New IF amplifiers may have been added or circuits repaired.
Check a test pattern for low- and high-frequency response and leading or trailing edges. As scenes change during a broadcast, distortion will vary.
Weak, watery, unsaturated chroma signals, and a poorly defined picture.
A 3.58-MHz oscillator perpetually falling out of sync could be caused by oscillator or burst amplifier problems. And while we think of it, tune your 3.58-MHz color subcarrier from a broadcast signal, then check another station or two to be sure the lock in range is right. The burst amplifier feedback circuit can also be tuned the same way. Every hue control should be able to go from magenta tones on the left side of the screen to greens on the right-at least 30 degrees in either direction from the mechanical center position (the chroma bars that start with yellow average and go to greens on the right).
Now you should be ready to look at an IF sweep and vectorscope alignment.
VIDEO IF ALIGNMENT
In any alignment, you begin by setting up the sweep-marker generator (Figs. 14-19, 14-20) and a good sensitivity oscilloscope (Figs. 14-21, 14-22 or 14-23). When alignment as we know it now is outmoded, you may be using a sweep and function generator like the EXACT Model 7060 (Fig. 14-24) or 124 multi-generator for IF and stereo checkouts.
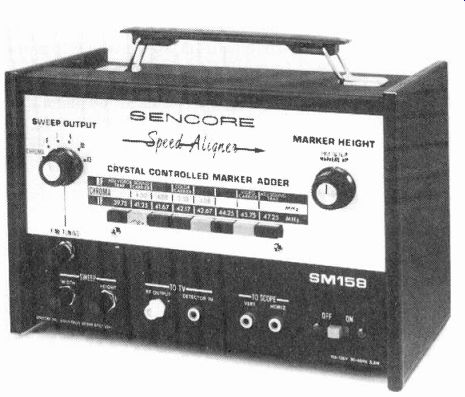
Fig. 14-19. Sencore's SM158 Speed Aligner for VHF TV RF, IF, and chroma alignment.
($275)
If your equipment has 3-pronged plugs (including ground) and your bench electrical setup has a common, so much the better. If not, securely run braid (coaxial cable with Bx connectors is good) between (or among) all equipment, including the television receiver, and if possible, pick a single point on the TV chassis for all grounds to meet. Then select a bias supply either from the TV itself (through a potentiometer), or an isolated supply such as one contained in the B&K sweep generator or the Sencore BE156 separate bias source. Make all hookups precisely as specified by the manufacturer. Sometimes a bias voltage will vary somewhat from that given, but when a manufacturer asks for an ac curate peak-to-peak display on the oscilloscope, he has a definite reason, and you must comply. So again, your scope must be accurate! In this particular receiver, (Fig. 14-25), we had to remove the tuner-IF cable, and the MAH, PM200, MAL, MAC, MAE,
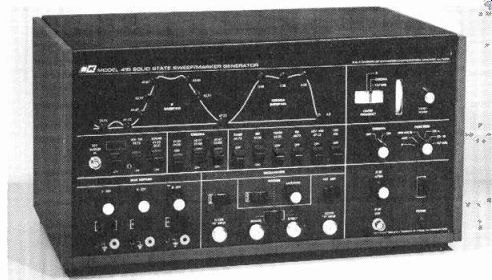
Fig. 14-20. B & K ( Dynascan) Model 415 solid-state sweep marker generator
with RF on Charnels 4 and 10 and lighted marker signals. Includes bias supplies,
400-Hz modulation, V and H markers and 14 crystals. ($400) and MAN modules,
ground certain points, shunt two others with a capacitor, plus warm up the
equipment and receiver for 10 minutes before beginning. First there was the
interstage alignment, then the overall IF alignment.
The initial overall response we picked up is shown in Fig. 14-26. The receiver, of course, was working nicely and an alignment was not indicated. On the left baseline is the 47.25 MHz adjacent-channel sound trap marker, on the left slope is the 45.75-MHz video carrier, at the top the 44.25-MHz center point, on the right slope the 42.17-MHz chroma carrier and on the right baseline is the 41.25-MHz sound trap. The chroma carrier is almost exactly at the 50-percent point, but if you want to be a little persnickety, the video carrier is about 60 percent up on the left slope. Do you align or don't you? Under ordinary circumstances with the receiver running well, probably not, but for demonstration purposes we did touch it up. With a twiddle here and there, the response curve came out to be that in Fig. 14-27--not quite as symmetrical, but precise. The markers, right to left, are 39.75, 41.25, 42.17, 44.25, 45.75, 47.25 (all MHz), and all exactly in place. The only difference is a slight out-of-round on the left top of the haystack, and we can always live with this if all the markers are right.
For a precise check, we turned the markers (Fig. 14-28) on their sides. Notice that the vertical baseline trap markers now disappear. The peak-to-peak amplitude is a total of 5 volts.
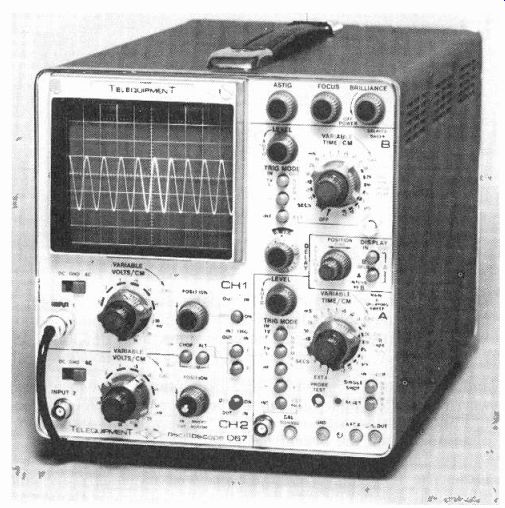
Fig. 14-21. Tektronix deluxe D67 Telequipment scope with delayed sweep and
delay line, two time bases, regulated power supplies. Your own scope doesn't
have to be this fancy, but it helps. Accuracy is better than its guaranteed
3 percent. ($975)
CHROMA ALIGNMENT
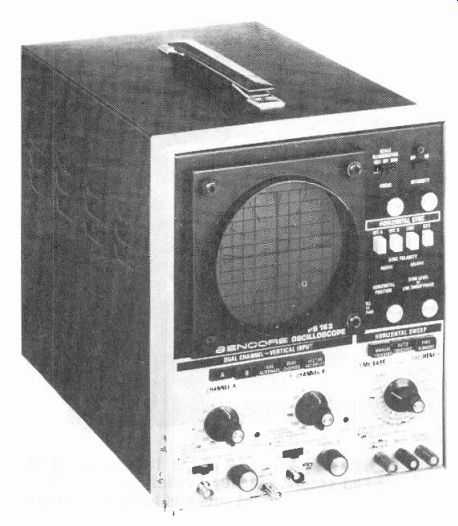
Fig. 14-22. Dual-trace, triggered and free-run sweep, Sencore PS163 scope
with front panel vector inputs; deflection factor to 5 millivolts, sweep to
100 nanoseconds. ($495)
Again, we were instructed by RCA to remove modules MAH, MAK, PM200, MAL, and MAN, add another short, and also a resistive coupling-termination (no AGC). This time we set the sweep generator to the pre-set chroma position so there would be no tinkering with the sweep, except the height and width of the markers. The initial chroma response found is shown in Fig. 14-29. Again, this is excellent and certainly not worth disturbing. The author wanted to investigate, however, and so we began a touchup. Also, and simultaneously, we used a vectorscope with gated rainbow generator to confirm (or deny) our findings. This initial display is shown in Fig. 14-30, with the brightness advanced to normal. In the reduced brightness photo in Fig. 14-31, the waveform is relatively clean but distorted, especially in the first three petals, and there are some phase problems in others. As you can see in Fig. 14-32, we connected an 80-mfd microfarad capacitor to AB on PW600 to take out the luminance channel, and the vector pattern looks better.
Fig. 14-23. Dynascan's B & K Type 1460 single-channel triggered sweep
scope with 10 my deflection factor, 10-MHz bandpass, and sweep 0.5 seconds
to 500 nanoseconds. ($390)
To continue with the alignment (Fig. 14-33), the 4.08-MHz marker is on the left slope, the 3.58-MHz marker in the center; the 3.08-MHz lower sideband marker is turned off. This looks pretty good, and is within the left downward slope; in this instance, toward a lower frequency. We do the same thing for the 3.08-MHz marker, but show what happens when you turn one of the transformer slugs a bit too far. The marker begins to go down the slope of the curve, narrowing the bandpass and that's not good (Fig. 14-34). So we reduced the amplitude and width of both markers and put them at the top, just inside the specified slope limits (Fig. 14-35). Next, we increased the amplitude and width of the markers so you could compare them with the initial picture (Fig. 14-36). See any real difference? I doubt it, but look at the final vectorscope picture (Fig. 14-37). Really, all we did was to reduce the chroma amplitude and turn the hue control until the third bar and the ninth bar were pointed to +R-Y and-(R-Y), 270 degrees, respectively. The pattern now tells us this receiver is demodulating at an angle of 105 degrees, the first bar starts at 40 degrees, instead of the "perfect" 30 degrees, and there are no crossovers in the display to indicate transformer mistuning.
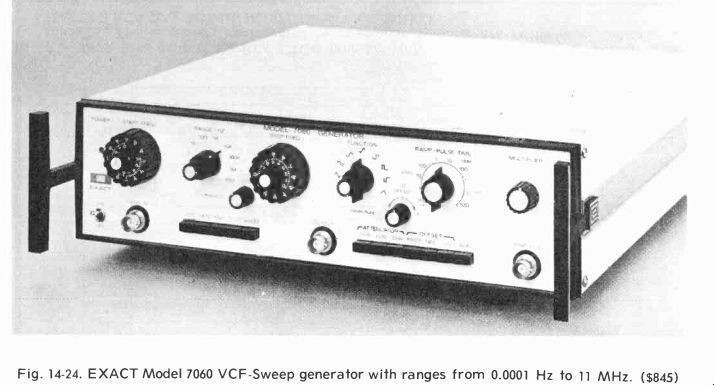
Fig. 14-24
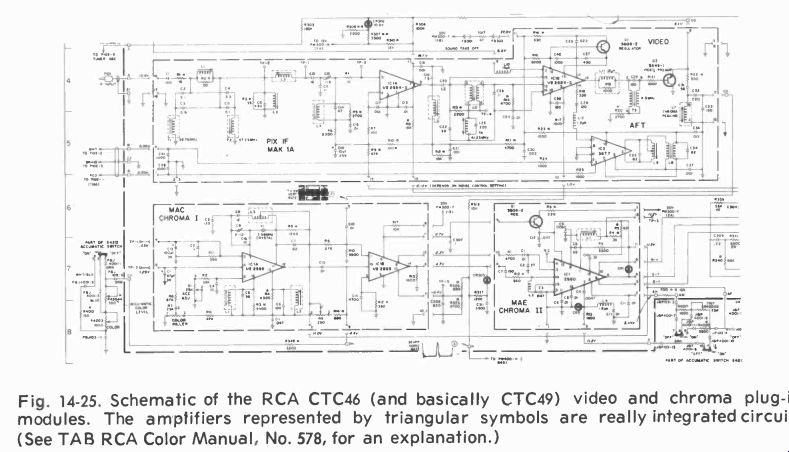
Fig.
14-25. Schematic of the RCA CTC46 (and basically CTC49) video and chroma plug-in
modules. The amplifiers represented by triangular symbols are really integrated
circuits. (See TAB RCA Color Manual, No. 578, for an explanation.)
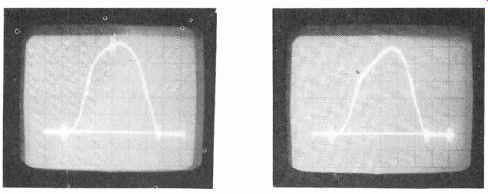
Fig. 14-26. CTC46 initial overall video I-F response.
Fig. 14-27. Final IF alignment curve.
Markers left to right in MHz are: 39.75, 41.25, 42.17, 44.25, 45.75, 47.25.
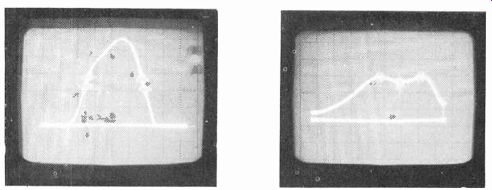
Fig. 14-28. Same as Fig. 14-27, but with the markers turned on the side for
a precise check. Fig. 14-29. Initial chroma waveform with 3.08 MHz on the
right, 3.58-MHz in the center, and 4.08 MHz on the left.
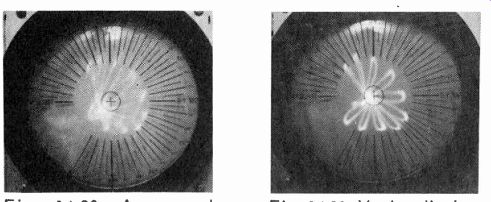
Fig. 14-30. A normal brightness setting on cathode-fed CRTs plays havoc with
a vector display.
Fig. 14-31. Vector display with the brightness turned down.
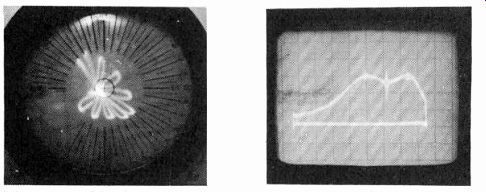
Fig. 14-32. Vector display with an 80-mfd capacitor connected to AB on the
PW600 mother board.
Fig. 14-33. The 4.08-MHz marker is close to the left edge; 3.58 MHz is still in the center.
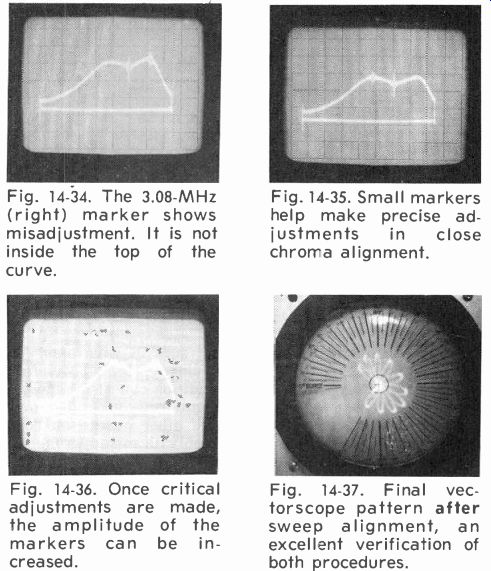
Fig. 14-34. The 3.08-MHz (right) marker shows misadjustment. It is not inside
the top of the curve.
Fig. 14-36. Once critical adjustments are made, the amplitude of the markers can be increased.
Fig. 14-35. Small markers help make precise adjustments in close chroma alignment.
Fig. 14-37. Final vectorscope pattern after sweep alignment, an excellent verification of both procedures.
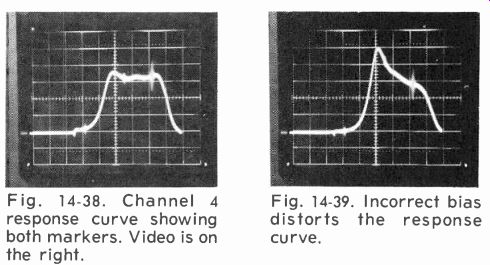
Fig. 14-38. Channel 4 response curve showing both markers. Video is on the right.
Fig. 14-39. Incorrect bias distorts the response curve.
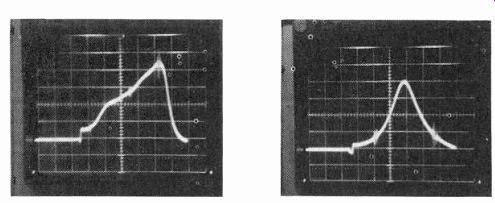
Fig. 14-40. Curve showing the effect of improper fine tuning. Fig. 14-41. Poor
Channel 10 response, but markers are firmly in position, so try another more
favorable channel.
TUNER ALIGNMENT
In any tuner alignment, you're likely to be told to add so much AGC DC to the tuner input, additional AFT voltage, and use certain channels for best results. You then must tune certain trimmer capacitors, squeeze a few coils, and be sure the local oscillator is on frequency so that the center IF output is 44 MHz, plus even a bit of trap twiddling. The instructions for each tuner will vary somewhat, but this is about what you will see. Occasionally, you're given two settings, say, Channels 6 and 13, and the others are supposed to fall in place automatically. Then you may be told to add specific terminations, and connect an oscilloscope to certain spots on the tuner to observe the outputs.
It is important that you do what the instructions say to the letter, for there's no magic way of executing an alignment without following the manufacturer's instructions; most of us who have tried otherwise have found out rather decisively the error of our ways. However, there are quick checks which you should know about.
In the Zenith tuner 19CC19 (formerly 4B25C19), we simply connected the Sencore SM152 sweep generator to the antenna terminals and applied a 3-volt bias to the tuner AFT input, with the receiver AFT leads disconnected. The scope was connected to the tuner IF output through a demodulator probe.
First, we found a channel where we could produce a reasonable pattern (Fig. 14-38). This Channel was 4, and on the right top of the curve-where it should be-is the 67.25-MHz video carrier, and on the left is the audio carrier represented by the beat of a separate 4.5-MHz crystal. This, of course, is a very pretty tuner double-humped pattern exactly what you should see on every channel.
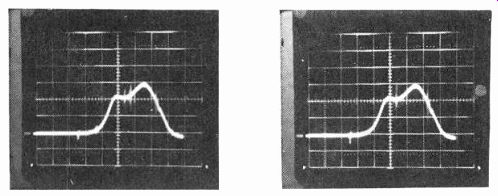
Fig. 14-42. Channel 13 response curve-better, but with a spurious marker
on the left.
Fig. 14-43. With the 4.5-MHz marker cut off, the spurious one is on the left and is immediately recognizable.
Suppose, however, you weren't sure of your bias. The pattern might look like Fig. 14-39-a sloppy, slanted waveform that is completely useless. This condition can also happen if each piece of your equipment isn't uniformly grounded to the receiver and to each other. On the other hand, you could develop somewhat the same condition with misadjustment of the local oscillator fine tuning (Fig. 14-40). If the output of the sweep generator were too high, the curve would "bump" a certain upper level and then begin to flatten the pattern out. So you must always allow a little leeway for bias and generator amplitude adjustment so that the waveform isn't distorted.
(The manufacturer usually specifies the amplitude.) Let's assume you now have a complete check on Channel 4, and now go to Channel 10 (Fig. 14-41). Look what happens here: you almost have an IF haystack, but with the 193.25-MHz (right) and the 4.5-MHz markers much too far down on the response curve. What do you do? Just go on to a higher channel and hope for the best. The final channel turns out to be 13, and this curve doesn't look too terrible (Fig. 14-42), but it does have an extra marker on the top that shouldn't be there.
When you have such a situation, simply reduce the amplitude of all markers and-or turn off the controlled markers one-by-one until the spurious marker stands alone. In this instance, you will find the spurious marker (Fig. 14-43) on the extreme left when the 4.5-MHz marker is turned off.
All these are pretty good lessons in alignment, because, if nothing more, they tell you what to prepare for. Following exact instructions is no more than a matter of reading a rather simple book. The quick checks described will help you to discover the good or bad of a tuner, IF, or chroma section be fore, we hope, you dive into a full-fledged alignment, and a quick check can go a long way towards telling you what may or may not be wrong. Use it whenever, in doubt, especially if you have a good sweep generator and handy bias supply.
Sweeping a tuned circuit can tell many things, both in alignment and when searching for troubles. For instance, if a certain IF or RF stage can't be tuned, there is something obviously wrong with that tuned circuit, and the sooner you correct it the quicker your difficulties will be over. Another evergreen suggestion is: set the traps first, then go about any needed alignment.
IF ALIGNMENT PROCEDURE
Ordinarily, you set the Channel selector to 13, connect the sweep generator input to the base of the third IF, the scope to the emitter of the first video amplifier, and begin adjusting the fourth video IF transformer. Afterwards, connect the generator to the tuner test point, and do the rest of the trap and transformer settings. But, again, there's usually a way to quick check the IFs. Apply external AGC to the first IF, and if your generator pads are near the proper impedance, you can simply connect the RF input of your sweep generator to the tuner-IF coupling network. Naturally, the scope connects to the video detector (if you have ancient equipment) or first video amplifier. In the Zenith 19CC19 (Fig. 14-44), the RF input could go between L101B and L101A, and the response curve...
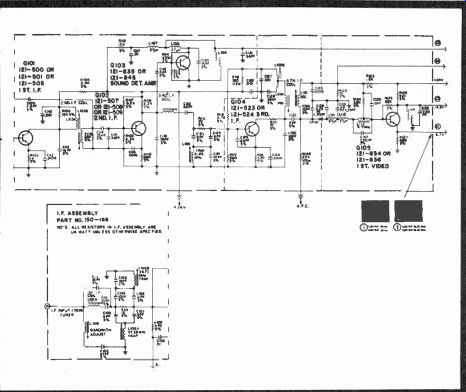
Fig. 14-44. Schematic of Zenith's 4B25C19 (now 19CC19) plug-in video IF strip.
...would be picked up across R127 in the emitter of first video amplifier Q105. The resulting waveform (Fig. 14-45) should be a true representation of the video IFs. We extended the amplitude of the markers so you would have no trouble identifying them. From left to right they are: 47.25-MHz lower adjacent sound carrier trap video carrier, 45.75-MHz, center frequency of 44.25 MHz at the top, 42.17-MHz chroma sub-carrier crystal beat on the right slope, and the 41.25-MHz sound carrier at the right baseline. This is an excellent IF response. The curve could be moved a hair to the right, but it might upset the video and chroma carrier positions; therefore, there's no need to change it all.
We're told that Zenith aligns tuner and IFs separately at the plant, and only touches up the converter coil when checking the final mating. Not too long in the future, there'll probably be no actual touchups at all.
CHROMA ALIGNMENT PROCEDURE
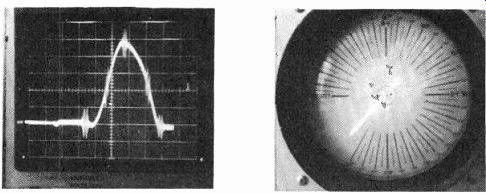
Fig. 14-44. Schematic of Zenith's 4B25C19 (now 19CC19) plug-in video IF strip. Fig.
14-45. Zenith's 19CC19 video IF response curve. Excellent marker positions;
no need to change them.
Happy to say we couldn't show any simple alignment of the chroma circuits in this Zenith with a sweep generator if we wanted to. There are no tunable transformers, and the only variable passive components are resistors. So, with these receivers, which are self-bandpass limiting, you simply use a voltmeter (or DC scope) and a color-bar generator, and the chroma alignment is done-just about as quickly as we can write it.
But we did think a few pointers on chroma alignment with a vectorscope, even using this receiver, might be of benefit. In one of these receivers, where chroma and video are mixed before entering the picture tube, you usually have to adjust brightness and sometimes contrast, or you'll have a picture like Fig. 14-46. Later, lower the brightness, but fail to AC short the luminance channel and provide no ground for the vectorscope, the unpleasant "barrel" such as shown in Fig. 14-47 will appear. Then, if you're using one type of color-bar generator, the pattern you'll see appears as in Fig. 14-48, and this is a well-known generator, too. But it's so smeary you can't use it. In Fig. 14-49, if the fine tuning is slightly off, or should the bandpass transformer be somewhat misadjusted, the petals in the pattern tend to become rather wide open. On the other hand, a badly tuned crosstalk potentiometer (and this "pot" controls both passband and amplitude of the chroma input) can cause highly undesirable crossovers that positively cannot be permitted (Fig. 14-50).
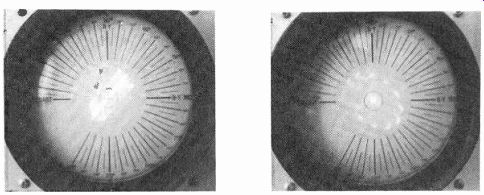
Fig. 14-47. This pattern appeared with no ground and no capacitor short.
Fig. 14-48. One available color-bar generator produced a pattern with considerable smear.
What should a good vectorscope pattern look like? Fig. 14 51 shows good chroma alignment using our own modified Mercury 1900 color-bar generator that is virtually free of 189-kHz oscillator "gating" spray in the chroma oscillator. The first bar begins at about 30 degrees; the second is obviously 60 degrees; we've set the R-Y third bar at 90 degrees, resulting in a demodulation angle of 105 degrees between the third R-Y and sixth B-Y bars, with all others falling nicely into place as they should. You'll recall that the color generator gates every 30 degrees from burst reference around to 300 degrees. So this chroma circuit, as you can plainly see, is highly accurate, and offers excellent color demodulation. Vectorscope connections were made at the limiting resistors going into the base of the cathode ray tube. You might also remember that this is a cathode-fed tube, and vectorscope inputs must be 180 degrees out of phase with those in a grid-screen CRT matrix receiver.
An R-Y (RC) equalizing network was used to help make the pattern somewhat rounder and to pick up the high frequencies.
Values were 390 ohms shunted by 180 pf. The vectorscope used is a Mercury 3000.
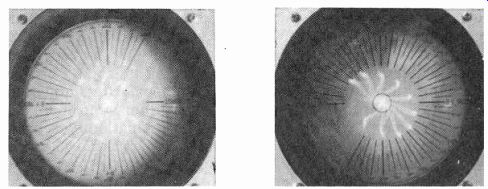
Fig. 14-49. The crosstalk adjust spreads the petals and changes the input
bandpass.
Fig. 14-50. Crosstalk can also cause bad crossovers, and this means washed-out colors.
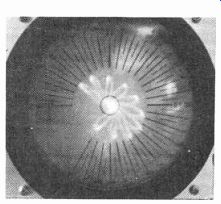
Fig. 14-51. Pattern achieved when the Zenith 19CC19 chroma circuits are aligned
correctly.
AGC PROBLEMS
To acquaint you with AGC problems, let's run through some of the day-to-day difficulties briefly. Since most receivers today have a keyed AGC system, anytime you have high-voltage problems, the keying part of the automatic gain control function is not there, and sync can feed through to the audio, causing a buzz. Whenever there is AGC overload, you may or may not hear this same sync buzz, but the screen will certainly become dark, and the picture may go into saturated bends. These bends occur because the tips of the sync pulses have been clipped by amplifier overload, and too much overload will cause the image to lose sync entirely, beginning with the vertical oscillator.
In tube-type sets, AGC is a negative voltage that cuts down on grid conduction. In most transistor receivers, all AGC is a positive forward bias that causes a reduction in hfe (forward current) in specially selected transistors before these transistors saturate and lose both gain and power in the process.
With AGC bias, each controlled stage continues as an amplifier, but stay out of saturation unless heavily over-biased.
Of course, there is little or no AGC if the keyer fails, or if there is no video input to the AGC to establish its conduction level. The usual collector or plate DC voltage probably will provide a little action, but not enough to gain a satisfactory picture. A lot of alignments, by the way, have been done for just such a flimsy reason. Where there is the slightest doubt, clamp the AGC line in vacuum tubes with a negative source and no disconnects, and in transistorized IFs, break the AGC line somehow and apply a positive voltage from a stiff DC source and see if there is any worthwhile response. If not, your problems are probably in the IFs, and then you need not only an AGC source, but a demodulator probe for IF investigation as well. These serviceman's de-modulator probes, incidentally, rarely give you true peak-to-peak values, but are used solely to monitor signal passage and relative stage gain among the two to four video amplifiers.
HIGH-VOLTAGE vs LUMINANCE AMPLIFIERS
Since high voltage (keying) and luminance amplifiers (video) play fundamental roles in operating the AGC, it's natural we should consider these two functions as well. Many servicemen are perpetually confused when they look at a color receiver and see a blank screen. The immediate inclination is to tear into the set, replace anything in sight, and hope for the best. Obviously, this is absolutely not the way to approach this problem.
First, measure the high voltage to discover if there is any.
If you have high voltage, then proceed to the video detector and follow through to the cause of the problem. Frankly, it's just as simple as that. Or you can use an oscilloscope all the way. Look at the conduction period of the high voltage (if there is any) without ever going inside the set; you'll have to be near the HV cage or transformer though, so determine if it looks good. Should this be your decision, then go to the limiter and video channels and find out what's wrong.
We deliberately didn't mention the chroma-video outputs on the new CRT cathode-fed receivers, because usually only one of these fail at a time, and the colors and luminance are then promptly affected, according to the extent of the trouble.
VERTICAL JITTER; VERTICAL LINES
Another mystifying situation is vertical jitter or a vertical line problem that affects some receivers. Unfortunately, the cause of the trouble can range from a bad tube, transistor, dirty potentiometer, or possibly a slightly leaky capacitor (but not likely). It is a very difficult condition to diagnose in that horizontal frequencies are filtering through the deflection yoke and modulating the vertical output. Remember, vertical line problems can come from horizontal modulation, and horizontal problems from vertical modulation. Sounds like the pincushion transformer, doesn't it? Yet, we've seen times when a dark line on a CRT would appear with diminished brightness and, in normal control settings, the vertical scan would just sit there and ever so slightly jitter. When we went to the vertical stages, numerous unknown frequencies appeared on the drive to the vertical output. And the condition was even worse at the plate of the vertical output tube itself. With a triggered sweep, we quickly determined that these stray frequencies were horizontal pulses leaking through the deflection yoke. A yoke change put conditions right immediately.
Another condition we recently ran into was a "waterfall" problem, where the vertical sweep was modulated with what looked like low-frequency wiggles. You'd be safe in betting either a vertical filter or the vertical deflection yoke had a lot to do with this. The receiver-a new Motorola-had no other source of 60-Hz since its starting voltage is a full wave doubler and its horizontal oscillator-run power supply is, of course, cycling at 15,734 Hz. Sometimes, in tube sets, you might suspect a damper, but this receiver is damped on a plug board, and that one had already been substituted. A crosshatch generator oftentimes can help diagnose an aggravated sync fault. Just mentally think horizontal for vertical, etc., and the extent of the problem should take shape. The solution, of course, could take a little longer.
All sorts of conditions can occur in any receiver. Many will appear to be similar to many you've seen before and yet turn out to be something entirely different. Background experience is excellent, and a few corrective tips from the manufacturer often are a windfall. But in most instances, you have to depend on your own initiative. When you have a color problem, look at the chroma and-or luminance outputs (if they're together, or separately, if not) with an oscilloscope and color-bar generator and trace back to your troubles. If video-chroma voltages are good and the waveforms true, by all means use a cathode ray tube checker to prove whether or not the CRT is shot. There are some good CRT checkers around: two we know are Sencore and Mercury (Figs. 14-52, 14-53). The Sencore is slightly more advanced, but both will track each of the three RGB guns relative to each other, and this is the true test of whether or not a color tube will actually perform, provided it has initial emission and no shorts or opens. CRT testers, good ones, are valuable investments and are enormous time-, money-, and reputation-savers.
COLOR FAULTS
To illustrate the visible effects caused by trouble in chroma circuits, we've used an almost totally integrated circuit TV color section. No longer do you have the simple barber-pole faults of oscillators being off frequency, single colors absent while all others shine, a potentiometer or quarter-watt resistor being burned or changing in value from hot or warm running currents, or big capacitors opening or shorting and producing large faults that are fairly easily dealt with.
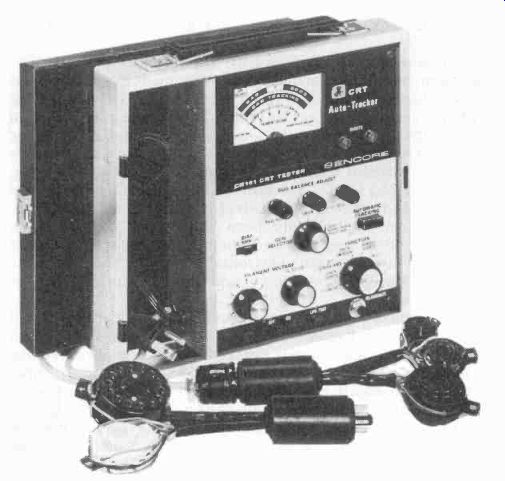
Fig. 14-52. Sencore's CR161 CRT checker with automatic gun tracker (memory) for all tubes, including Trinitrons.
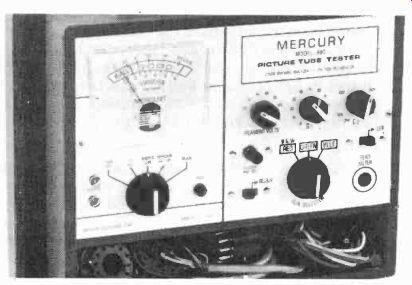
Fig. 14-53. Mercury's 880 is easily set up and is a color tracker as well
as a rejuvenator.
In IC color processors (and before long, all-IC receivers), a host of small, even minute, breakdowns will completely blot out color altogether, pop out the circuitbreaker and turn off the entire set, or shift the phase colors so that the problem appears to be one caused by anyone of a number of sources.
With ICs in chroma circuits, you have DC-controlled bandpass amplifiers, DC-phase shift hue and chroma controls, filters of all descriptions, and tuned circuits that must maintain their parallel and series resonant frequencies as maximum and minimum impedance paths, respectively. The best of professionals are designing these receivers with programmed computers to help, and semiconductors are not nearly as restrictive as vacuum tubes, considering what can be done with them. So with ICs, you have but two salvations: a handy socket mount and-or plug board, and a very good quality DC triggered sweep oscilloscope. Thereafter, it will be a case of signal in, signal out, and checking rated voltages from the set's power supply. Figs. 14-55 through 14-79 in the color photo section depict the screen effect of various chroma circuit troubles.
Regarding color-bar generators, positive dot and crosshatch pattern stability without the use of J-K flip-flops...
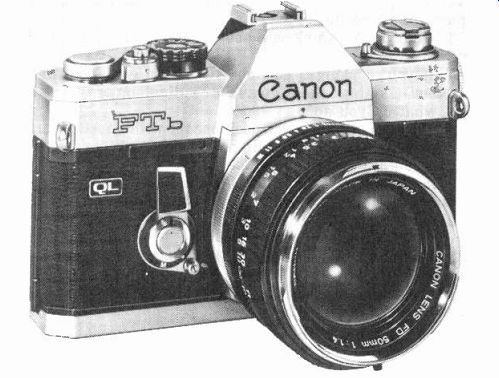
Fig. 14-54. Bell & Howell FTb Canon camera used to take the photos in
the color section. It has an FD 50mm F:1.4 lens. (Courtesy Mike Laurane, Bell & Howell,
Chicago)
...and other ICs in the count down chain will be either extremely difficult or downright impossible to maintain. The IC generators may cost a little more, but the price stretched over the months will be wholly worth the needed professional convenience. Once adjusted, these count-chains stay and produce fine-line, highly stable dot-bar patterns that make convergence on the better receivers a pleasure. You will also be able to set up the poorer converging sets so that fringing barely shows along the sides, top and bottom, if at all, from a distance of six or more feet. In the pictures you'll see several examples. The only problem you continue to face with available color-bar generators is they still don't gate the chroma oscillator cleanly enough to avoid producing fuzzy vector patterns. We've made the point now to enough test equipment manufacturers so that some day one will see the light and proudly offer something with more utility than we have now.
QUESTIONS
1. How can you justify $500, $700, $1,000, $2,500, for a good oscilloscope?
2. Is there ever a time when an analog meter can be used in place of an oscilloscope?
3. What do you think will soon replace vane-type analog meters?
4. If you're using a scope's AC amplifiers and want to know the DC voltage the AC wave is "riding" on or "hanging" from, what do you do?
5. Can you calibrate a DC oscilloscope with an AC voltage?
6. What are convenient time-base rates to observe vertical and horizontal sync waveforms?
7. In the waveform in Fig. 14-8, what's all the jitter in the top pulse? Is this a satisfactory condition?
8. Why can't you use the dual-trace chopped mode on traces at kHz frequencies and above?
9. Why don't you randomly change parts just to see if the set won't "work"?
10. Are solid-state color receivers susceptible to Barkhausen oscillations?
11. From reading the descriptions, what sweep generator would you select if you wanted 1) reliability and restricted sweep coverage; or 2) a wide range and sweep flatteners?
12. Name the four types of markers.
13. If a receiver has good video but sound bars in the picture, does it need video IF alignment?
14. What if you have a smeary picture with no sound interference? Does this indicate a need for alignment?
15. What about IF alignment when the picture quality is poor and fine tuning does affect definition and probably contrast?
16. How can you pull the sync and sweep circuits out of a receiver and still get an alignment pattern.
17. Look at Fig. 14-28 and see if side-appearing markers aren't thoroughly useful. But why two sets?
18. Why do you remove luminance when you want to use a vectorscope on a totally cathode-excited picture tube?
19. A chroma alignment (Fig. 14-33) can be best done with all three markers visible simultaneously? 20. What can cause tilt in RF and IF swept waveforms besides bad oscillator tuning?
21. What would you do if, by touching your hookup cables, the shape of the alignment response curve changed?
22. When there are spurious markers what do you do?
23. Do most demodulator probes render accurate p-p voltages? What is their big response problem? 24. How would you determine whether or not horizontal frequency signals are interfering in the vertical circuits, or vice versa?
25. Why do you need a cathode ray tube checker when the outside technician "eyeballs" a gassy appearing tube and declares that it's shot?
Next: Link | --Domestic CAN Systems
Also see:
TV Antennas and Transmission lines
Air Time--An Intro to Television Broadcasting
TV and Radio Tube Troubles (1958)