Color is a combination of light and dark, tints and broad displays that can be described as brightness, hue, and saturation, where brightness (luminance) is identified as the various shadings (usually 10) from very light to very dark; hue describes the actual color such as red, blue, and green; and saturation tells whether these colors are intense (fully saturated) or have considerable white content and are, therefore, pastels.
COLOR MIXES
An artist mixes paints such as yellow and blue to produce green, red and yellow for orange, and blue and red to make purple. His primary colors are blue, red, and yellow. And, in mixing these individual pigments, he finds they absorb particular hues; therefore, it is a process identified as a sub tractive color mixing.
Color television, however, uses an additive method where light (Y for luminance) is added directly to primary reds, blues, and greens, so that R(red)-Y(luminance, B( blue)-Y( luminance), and G(green)-Y(luminance) are the color signals and in the receiver are either combined with luminance in the output color amplifiers for passage to the cathodes of the picture tube (in the late model receivers), or continue as separate luminance and color signals to the grids and screens of the cathode ray tube where they are matrixed internally. This luminance information contains not only brightness, but also includes all the fine detail you see in any monochrome or color picture because color fills in only the larger areas of any televised scene.
As indicated above, the color mixes in color TV are entirely different from those made with pigments, and this is shown graphically in Fig. 2-1. Blue and green constitute cyan; blue and red make magenta; red and green produce yellow; and red, blue, and green combine in certain proportions to yield white. On the other hand, when any primary hue is subtracted from white, the result is a complementary color such as yellow being the complement of blue, with pairs cyan and red, green and magenta constituting equivalent complements, too. Other intermediate colors result from changing the proportions of the primaries. For instance, a certain mix of considerable red and green forms orange; chartreuse also comes from measured quantities of mostly green and some red, etc.
Completely saturated colors seldom appear in nature's settings. Even the sky and sea are somewhat less blue and green than full saturation might require. Consequently, the majority of colors you see are unsaturated and this means that most of the 1,000,000-odd phosphors on the face of the cathode ray tube are usually lighted to some extent, depending on the sweep and intensity (amplitude) of the incoming chroma signals.
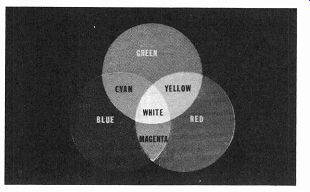
Fig. 2-1. Primary colors red, green, and blue mix to form cyan, white, magenta,
yellow.
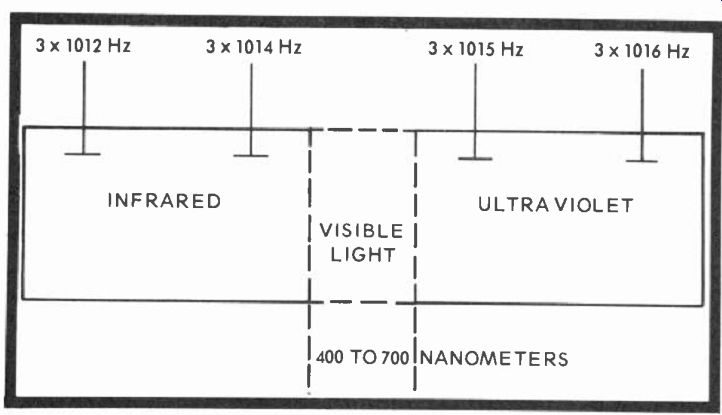
Fig. 2-2. Visible light appears in both the radiant energy spectrum and frequency
range between nonvisible infrared and ultraviolet.
COLOR FREQUENCIES & APPLICATIONS
Believe it or not, the eye can recognize more than 30,000 colors. These colors appear in the radiant energy spectrum between 400 and 700 nanometers (formerly milli-microns) from lower frequency ultraviolet progressively to blue, green, yellow, orange, and red, the upper visible frequency (Fig. 2-2).
In round numbers, you see light in the visible spectrum at frequencies between 3 x 10^14 and 3 x 10^15 Hz, just following infrared and before ultraviolet.
The primary television colors, red, blue, and green, have spectrum wavelengths of 680, 470, and 540 nanometers, respectively, and have been deliberately selected to deliver the greatest range of suitable colors. For instance, in Fig. 2-1, 50 percent of two of the three colors produce magenta, yellow, and cyan, and these are fully saturated colors when there is no third hue to intervene. When all three saturated colors combine (unmodulated), the result is (or should be) a uniform gray-white raster. At this point, all phosphors are lighted with the same intensity and, to the eye, appear to have equal energy or brightness.
Experimentally, we find that a reference white light with the three TV primary colors of the same intensity will produce apparent brightnesses of 59 percent green, 30 percent green, and 11 percent blue. In the real life picture tube, of course, these percentages are not valid because of the different efficiencies of the RGB phosphors which, incidentally, now favor green as the weaker (or reference) color, and red and blue as the stronger colors. Only a few years ago, red was decidedly the least efficient. But, with new Yttrium red phosphors, this color has gained considerable comparative strength.
For reference and general information, the chromaticity diagram (Fig. 2-3) from Sylvania Color TV Clinic Manual I shows you how the NTSC color triangle is put together, and where the various colors lie throughout the curve. The numerals surrounding the X-Y plot are the wavelengths in nanometers of the different visible colors.
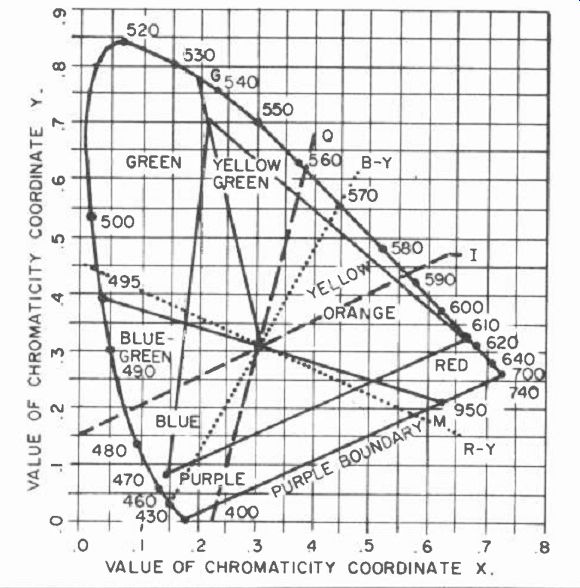
Fig. 2-3. Sylvania's color television chromaticity X-Y diagram with colors
identified in the radiant energy spectrum in terms of nanometers.
NTSC & SIDELOCK COLOR GENERATION
The highly useful but usually more expensive NTSC generator delivers carrier, sync, and pulse-shaped voltage levels to the chroma circuits of any receiver (Fig. 2-4), resulting in fully saturated colors that may number between 3 and 6, depending on the design of the individual generator. The amplitudes of the rectangular pulses in the set can be both positive and negative, depending on the action of the receiver's chroma demodulators, and each pulse occupies a unique level and position. The position and level tells you which red, blue or green output you're viewing, the condition of its demodulation, and the efficiency of its RGB-(Y) amplifier-all excellent things to know when either designing and-or troubleshooting chroma processing circuits. Notice the ...
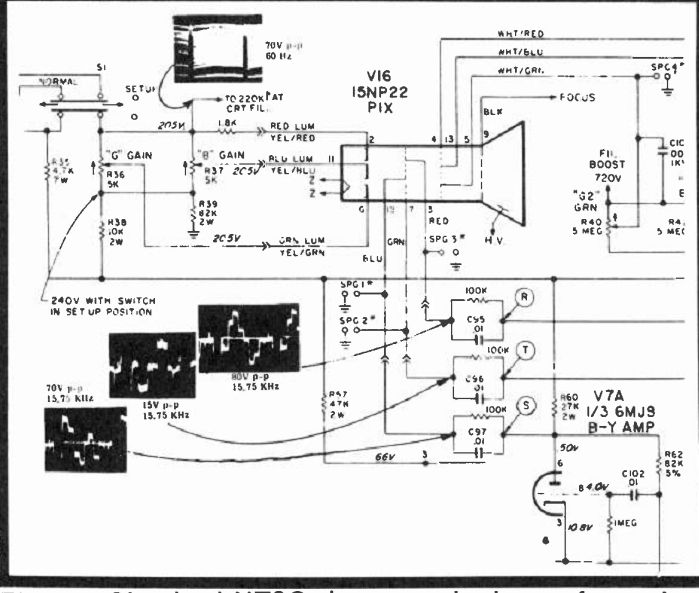
Fig. 2-4. Standard NTSC chroma output waveforms in a Zenith CM-114 chassis.
Luminance signal is at top.
... different pedestal levels and relative waveform time-intervals of the pulses at the RGB amplifier outputs in Fig. 2-4. The pulse peaks represent the largest amplitude swings out of each amplifier, and you can roughly estimate relative timing (without a triggered sweep oscilloscope) by the position of negative-going 11-microsecond blanking pulse before the start of each new cycle.
A little less than two cycles of each waveform are showing in each of the RGB-Y waveforms in Fig. 2-4. For instance, the B-Y amplifier swings fully positive at the beginning of every new cycle, then begins to descend while the R-Y amplifier output is rising. Meanwhile, the G-Y amplifier swings almost fully negative several microseconds after blanking. This sequence should indicate that the first color bar would be blue, the second magenta, and the third might well be a combination of red-blue (the total absence of a time base is con fusing) which could equal a third color, with blue substituted for yellow-white. So red-blue equals red-yellow + white equals 0 and yellow equals red + white. Therefore, yellow is the third color in the sequence, at least for the present best estimate.
Shortly, we'll demonstrate what you see exactly in a gated (side-lock) rainbow generated signal.
An NTSC color-bar generator (Fig. 2-5) produces a constant frequency of 3.579,545 MHz, the same as the chroma subcarrier oscillator in any color receiver, and produces saturated colors in the receiver circuits by both gated pulse amplitudes and certain phases that are time-delayed by taps on a fixed or variable delay line. Such generators, for in stance, produce red at 76.5 degrees, blue at 192 degrees, and yellow at 12 degrees in any normal 4-quadrant vector diagram.
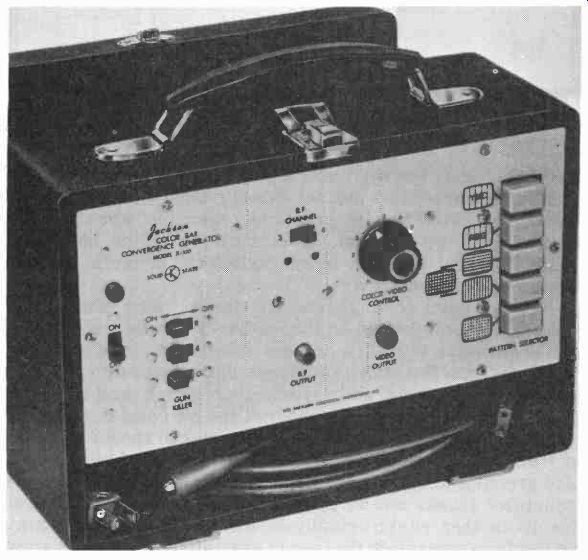
Fig. 2-5. Jackson X-100 NTSC type 3-bar and complement color generator with
315-kHz master oscillator, featuring RF and video outputs.
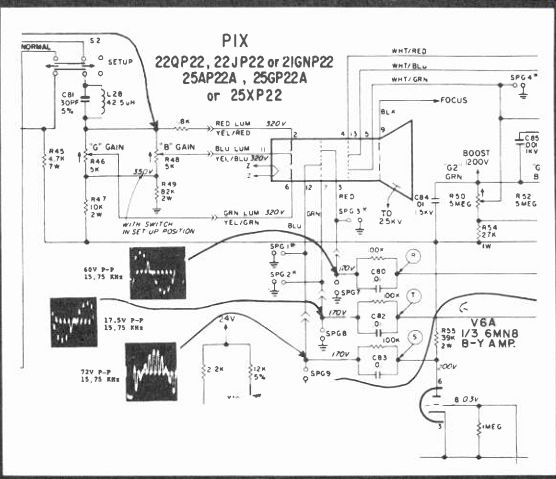
Fig. 2-6. Zenith CM-114S CRT input circuits with sidelock (rainbow) generated
color output waveforms.
The sidelock (or gated rainbow) generator is a somewhat less expensive instrument, depending on quality, overall performance and circuit composition. The term side-lock refers to the fact that the output sine-wave generator signal operates at exactly 15,734 Hz, minus the fixed color oscillator frequency of 3,579,545 Hz. This generator, then, produces one less alternation in each 63.5-microsecond horizontal scan interval, but at the start and finish of this period it is completely in phase and the set doesn't know the difference.
Therefore, color lock is practically possible when a color generator is offset by an exact multiple of the horizontal scanning rate, and the term "sidelock" is often used to describe such operation.
The original color generators simply had a blending of reds, blues, and greens, in that order, to produce a constant phase variation of from 0 degrees around the circle and back to 360 degrees. But with a bit more complex circuitry, such as countdown horizontal and vertical sync gating, and a master 190-kHz oscillator, it was found that twelve color bars should be produced that would cause the receiver to show variations of from yellow-orange, through reds, magentas, blues, cyans, and greens and some other shades in between. However, the generator blanks one of these color bars, and the receiver blanks another, so you actually see 9 or 10 color bars (one may be lost in overscan) on the face of any satisfactorily operating color receiver.
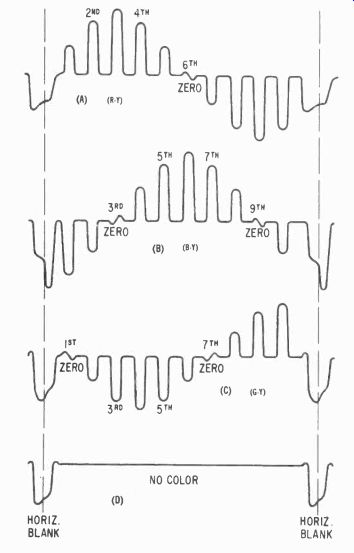
Fig. 2-7. R-Y, B-Y and G-Y reference patterns generated by a rainbow-type
generator. Notice the zero nulls in all three patterns.
The diagram in Fig. 2-6 shows a later model Zenith (with virtually the same color output circuitry) excited by a gated ture shows (pinkish) red. In the fourth bar, two units of positive R-Y, one unit of positive B-Y, and three units of negative G-Y resolve what is called magenta.
Notice that up until this time, there is virtually no greenish effect, and it is only when blue B-Y begins to go positive that the blue bars really enter the picture. When B-Y diminishes and R-Y goes negative, G-Y excitation rises positively and the final two bars are bluish green and green, respectively. After this follows the second cycle of blanking and the color-bar pattern begins all over again.
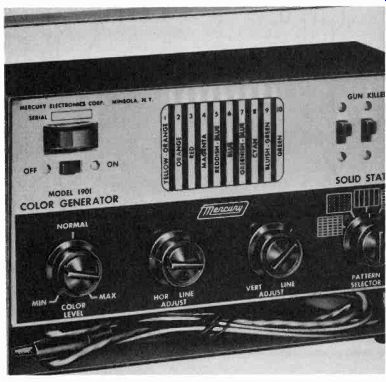
Fig. 2-8. Mercury's 1900-1901 inexpensive color-bar generator produces variable
size lines and dots.
Even though we can make a logical case of the position of the green color bar at certain phases of the line frequency scan, it isn't really necessary. Remember, in Section 1, the original I and Q information contained green in both instances.
In many receivers, even today, green is the negative output mix of the R-Y and B-Y amplifiers. Consequently, it's nice to rainbow generator. The one problem here is that these waveforms were taken with the hue (or tint) control turned just enough to disturb the classic relationship for zero reference. Usually, the R-Y demodulated output nulls at the sixth bar, G-Y at the first and seventh bars, and B-Y at the third and ninth bars. Nonetheless, you can see the voltage levels quite clearly, and the illustration is a good example of virtually the same receiver circuits operating with NTSC-type and gated rainbow inputs.
For the record, let's include the classic tri-phase color-bar output as it should appear so you will have an accurate reference for future demodulated chroma evaluation and comparison (Fig. 2-7). The generator we might have used appears in Fig. 2-8. Other sidelock generators and color-bar plus vectorscope patterns are exhibited in the chroma and test equipment sections. Here, the vectorscope patterns are accurately timed with the gated rainbows to show exactly how and why these color bars are produced and where the RGB (Y) receiver outputs combine to supply the various colors. A good receiver, we might add, does NOT blend various colors within the 10 color bars, but exhibits solid shades for each individual bar so they appear fully saturated. Pastels, wrong value, or faded colors usually mean there are defects in the chroma circuitry or, in the worst instance we can think of, you're looking at a poorly designed color receiver. And then, of course, any normal repair is a little more than difficult. As you will discover later in the vectorscope timing diagrams, however, only the R-Y and B-Y outputs are used, since these are Lissajous patterns, and only inputs 90 degrees out of phase can be used. If these exciting voltages were in phase, you'd have nothing but a right or left-slanted diagonal line.
WAVEFORM ANALYSIS
Just to keep the colorimetry in perspective, let's analyze a few points in these color test patterns and compare the generated colors in Fig. 2-9A with the idealized output drawings in Fig. 2-7 and the vectorscope color wheel in Fig. 2 9B. The first negative-going voltage is simply horizontal blanking that always precedes the start of the gated rainbow color pattern. In the first bar, with green at zero, two increments of negative-going B-Y and one positive R-Y produce a yellow orange color bar on the left. In time 2, two units of R-Y and one unit each of B-Y and G-Y (both negative-going) produce a full orange. The third bar, with two units of negative green, no B-Y, and a full three units of positive R-Y, the pic--know the G-Y stage is functioning, but the result is really academic to our analysis since its effects are already taken into account by the action of the red and blue demodulators.
Even in the newest receivers where green is demodulated separately from red and blue, the R-Y and B-Y demodulator-amplifiers (with luminance removed) still tell the gated rainbow color-bar story. New tri-phase demodulation, especially in integrated circuits with luminance directly added though, provides superior color since it delivers excellent greens, something that all X and Z or R-Y, B-Y systems don't always do.
Fig. 2-9. A gated rainbow (sidelock) generator produces 12 color bars. Two
are blanked, and either 9 or 10 should appear on any color CRT, one bar being
lost, usually, in overscan (B). Vectorscope pattern of Figs. 2-7 and 2-9A
combined. It can be seen on any vectorscope if the receiver is driven by a
clean gated rainbow generator.
USEFUL COLOR EQUATIONS
Here are some of the more useful equations that have been developed over the past 20-odd years to help explain our remarkable NTSC system of color:
I = .74 (R-Y)-.27 (B-Y) Q = . 48 (R-Y) + . 41 (B-Y) I and Q in terms of R-Y, B-Y I = . 6OR-.2 8G 3213 Q = . 21R-. 52G +. 31B I and Q in terms of red, blue, green Y = .30R + . 59G + 11B
Luminance in terms of red, blue, green
R-Y = . 9 61 + . 63Q B-Y =-1. 11I + 1. 72Q
Color difference RGB-(Y) in terms G-Y = 281-. 64Q off I, Q.
R-Y = .70R-.59G-.11B
G-Y = .41G-. 30R-11B
Color difference RGB-(Y) in B-Y = 8913-.59G-. 30R terms of red, green, and blue.
There are also three basic oscillator equations that might help explain the origin of the sync and color subcarrier frequencies. Since separation of sound and video carriers at 4.5 MHz can be classed as an even 286th multiple of the line scanning frequency rate of 15,750, a new line frequency can be equated:
4.504)500 x 106 = Lf =15 ,734. 264 Hz 286 or 63.5 microseconds
From this, a new vertical rate is determined, since each frame will consist of 525 lines:
15 734 2 64 Hz Ff = = 59. 94 Hz 525 or 16,662 microseconds
And, finally, a 455 multiple is supplied to keep the subcarrier frequency a certain distance above the video carrier and still contain the I and Q sidebands. The subcarrier frequency now amounts to:
455 x 15,734.262 Su I-)f-- 3,579,545 Hz—
or almost 282 nanoseconds
All equations after the first depend entirely on the line frequency as determined by the sound-video difference, a multiple and the original line scanning frequency. This is why a broadcasting station must hold its color subcarrier reference tolerance to 0.0003 percent, with a maximum rate of change of no more than 0.1 Hz per second, or 10 cycles in 3.6 million, a tolerance that must forever be crystal controlled at the transmitter and followed very closely by the receiver with its own crystal-controlled oscillator.
CATHODE RAY TUBES
In contrast to the screen surface in early tubes, current picture tubes are now beginning to or are already using a black background that surrounds the red, blue, and green phosphor dots to absorb light reflections. The black background also permits the use of higher transmission filterglass faceplates, and even allows beam overscan of individual dots, if this proves to be an advantage. There are also new red-emitting yttrium oxy-sulfide rare earth phosphors, and new green and blue emitting sulfide phosphors, too. To produce raster white light at 9300 degrees Kelvin, the anode current supplied by each of the three guns must equal 30 percent red, 31 percent blue, and 39 percent green, demonstrating that green is the least efficient phosphor and is now the reference color rather than red, which was always the weakest phosphor in the earlier days of color television.
Into the neck of each tube is fitted a precision triple-electron gun to limit, focus, modulate, and aim the three beams of electrons toward the same cluster of three-dot phosphors at any instant in time. Usually, the smaller the beams the better the focus. Static and dynamic magnets are positioned over each gun for controlled beam landing to make sure each beam hits the correct dot, plus a lateral blue magnet to move the blue beam right or left. Finally, there is the purity magnet and the deflection yoke.
Fig-2-10. Comparison of 90 and 110-degree cathode ray tubes exhibiting slim
profile of the latter and the thinner, shorter tube neck. (Courtesy CA. Meyer.
RCA).
Some screen phosphors are deposited by dusting ( Sylvania) where dry phosphor powders are deposited by air on a thin film of photolithographic material. RCA uses the slurry process with phosphor powers premixed in photolithographic emulsion, and then poured on the CRT faceplate. When the tube is put together and installed in a receiver, the three electron beams pass through some 1.146 million holes in a temperature compensated shadow mask to produce either a monochrome or color picture.
RCA's 110-Degree Tubes
Most recent of this manufacturer's offerings are 18, 19, and 25-inch 110-degree color cathode ray tubes that were first seen in late 1970 and during 1971. Fig. 2-10 is a comparison of the standard 90-degree tube outlined in white, with the same 110-degree tube drawn inside in black. Difference in length is 4 inches (17.9 inches compared with 13.9 inches), a substantial saving in receiver depth.
The greater deflection angle requires an increase in the horizontal deflection power needed from 43 percent to 50 percent, and the needed vertical deflection power from 53 percent to 65 percent. The 110-degree deflection angle also introduced additional edge convergence problems. By designing a smaller 29 millimeter neck, however, both power and convergence difficulties came nearer solution, and a more accurate lens and tighter dot-phosphor control brought beam landings on the RGB dot trios under control. Actually, because of the reduction in neck diameter from 36 to 29 millimeters, the yoke measurements were lessened so a 30 percent saving in power was effected, and the short electron gun and closer gun spacing makes all beams pass through a more uniform magnetic field that produces much tighter yoke and tube convergence variations without the addition of further expensive corner convergence correction. The difference between the 110-degree and 90-degree deflection yokes are shown in Fig. 2-11, and both are the familiar saddle type that has been used for some time in the standard 90-degree deflection color tubes.
The 25-inch large screen 110-degree tubes, however, have had one or two different problems. The beam landing and convergence problems that had been readily solved in the smaller size 110-degree tubes were much more critical in the large tubes and required additional design. RCA overcame these problems by inventing what it calls the Precision Static Toroid (PST) deflection yoke shown in comparison with a wide-neck dynamic saddle yoke in Fig. 2-12. As RCA explains it, the PST yoke windings are on a closed ferrite ring core and consist of two coils each that are wound rather fully along the yoke without empty end spaces. By eliminating end turns and using more core, the PST yoke deflects a field that is longer and so bends the three beams more uniformly and gradually with better sweep control. Not only Is the PST yoke actually 30 mm shorter, but it weighs 45 percent less than a saddle yoke with the same minimum inner diameter, and also has low-impedance characteristics that are entirely compatible with solid-state receivers. AE a result, the spot size and resolution ...
Fig. 2-11. Comparison of the 90- and 110-degree deflection yokes.
Fig. 2-12. RCA's new PST toroidal yoke compared with the wide-neck saddle
type. As yoke and tube matches become closer, convergence problems diminish.
... of the 110-degree 25-inch tubes that have already been introduced to Europe are considerably better than the 90-degree tubes already on the U.S. market, according to RCA, and the glass transmission, phosphor efficiency and light output are equally proportional.
GE's In-Line Gun
In its smaller screen receivers, General Electric uses a cathode ray tube with in-line RGB guns instead of the conventional 120-degree separated type used in most other U.S. receivers (Fig. 2-13). According to G.E., dynamic convergence correction is already built in because of the way the deflection yoke is wound. The blue and red guns are on the outside, while the green gun is in the center. Normally, in the usual delta tube, all three guns are converged toward the axis or center of the tube. But in the G.E. tube, only the outer beams require convergence.
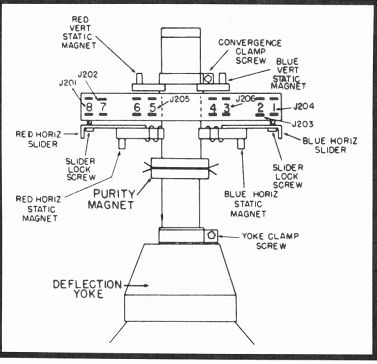
Fig. 2-14. Drawing showing the locations of the convergence magnets and slides
for in-line gun tubes.
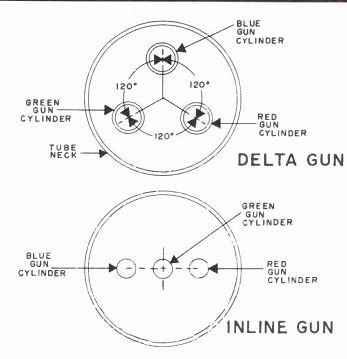
Fig. 2-13. Delta and inline CRT gun drawings.
In Fig. 2-14 you will notice red and blue vertical and horizontal static convergence magnets and a pair of red and blue horizontal sliders. There are no green controls, since green is already fixed on the center axis of the tube. In static convergence, one magnet (for each) moves blue or red in a vertical direction, and the other magnet (pair) moves the blue or red beams horizontally. Dynamic convergence is adjusted with red-blue sliders that are connected in series with their respective horizontal and vertical yoke windings, and there is no interaction between either dynamic and static controls, or controls for either outside gun. You will also notice that the purity magnet is positioned between the convergence assembly and the deflection yoke due to construction of the electron guns. Yet purity adjustments are the same except they are made on a green field, probably because green is this tube's reference rather than red or blue. Gray-scale tracking is the same, too, and is initially set with a low brightness level.
Zenith's Black Surround CRT Zenith-Rauland's Chromacolor black surround tube has 1,350,000 phosphor dots deposited at about the same size as the conventional matrix but completely encircled by a black surround material that is highly light absorbent. The iris mask, designed to accompany the dark background process, has apertures that are 9-thousandths of an inch in diameter when the black surround is applied, and are then opened to 16 thousandths of an inch. 450,000 apertures permit passage of the three electron beams. The diameter of the electron beams is larger than the individual phosphors. So, says Zenith, all "phosphors on the screen can be totally utilized and phosphor efficiencies balanced." In previous conventional 23-inch color tubes, Rauland claims that while the phosphor dots are 17-thousandths of an inch in diameter at center, the electron beams were only 13-thousandths of an inch, with only 45 to 65 percent of the dot areas being excited.
According to the manufacturer, the Rauland 25-inch tube claims a light output of 70-foot lamberts compared to 50.2 for the matrix tube, with a very favorable contrast ratio of 12.1 at 20 ft. candles ambient. The gun for this tube is shown in Fig. 2 15 with its triple electrodes, internal shields and beam dividers. Tubes are hermetically sealed, and protruding pins are solid metal instead of the once-hollow extensions that had to be periodically re-soldered for good connections, especially the heater inputs. The long white piece between two of the three guns (bottom of photo) is a glass support bead. The heaters and cathodes are small metal units close to the base (not visible in the photo). The larger round assembly, at the end of the guns away from the base, is grid No. 4, the convergence cage that is affected by both static and dynamic convergence fields.
MOIRE
We are indebted to G.M. Ridgeway, Manager, Applications Engineering, Zenith's Rauland tube division for much of the following information on a topic that will assume a lesser or greater degree of importance, depending on manufacturers' ingenuity and technicians ability. For, during some special operating conditions, a shadow mask picture tube will produce a pattern of brightness variations on the screen that initially has nothing to do with picture content.
Something like sheer window curtains with overlapping folds, moire is a pattern composed of both light and dark wavy lines.
The term, moire, was originally applied to a type of mohair ribbed fabric designed to present an appearance of wavy design. This same wavy design may show on the face of a shadow mask color picture tube, resulting in line-to-line variations as the electron beam passes through the shadow mask openings. With continued improvements in phosphor efficiencies and electron gun optics, smaller beam sizes should be realized and, therefore, form sharper raster lines.
Consequently, much greater care in such cases is needed during setup adjustments of the newer television receivers to minimize moire effects.
Since the invention of the cathode ray tube, experts in the field of electron optics have strived to improve the spot resolution under actual operating conditions. Considerable progress has been made in the performance of the monochrome tube, and until recently it has been significantly superior to that of the tri-color tube.
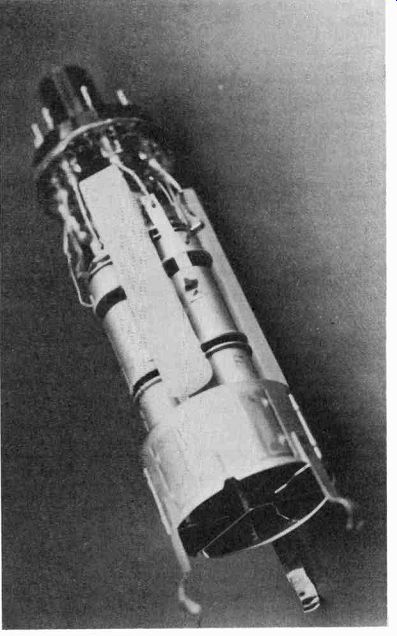
Fig. 2-15. Electron gun assembly for the Chromacolor tube showing the electrodes
of the three guns.
Several factors have contributed to the relatively poorer performance of the tri-color CRT gun, some of which are the complexity of manufacture of the 3-gun assembly, the unique delta arrangement which projects three beams-none of which are centered in the deflection field, purity and con verged requirements which distort the three beams and the high current requirements for brightness (since over 80 percent of the current strikes the shadow mask, never reaching the screen).
Fig. 2-16 shows typical spot size measurements at various beam currents. The lower curve shows the performance of a typical high resolution gun, while the upper curve shows the performance of an earlier gun. You can see that at any given current, the earlier gun has a much larger spot size.
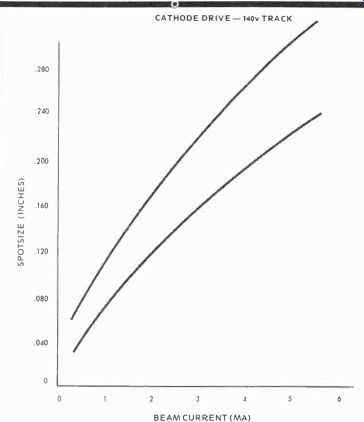
Fig. 2-16. Spot size vs beam current relationship.
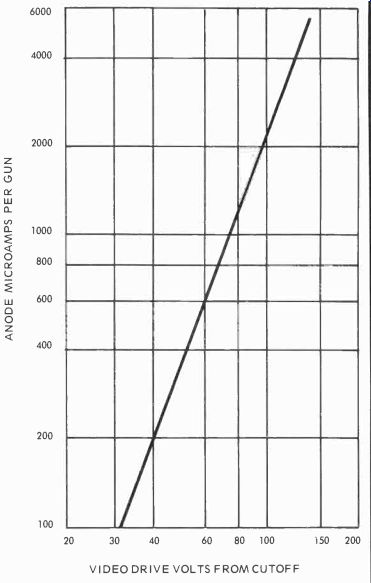
Fig. 2-17. Cathode drive-anode current relationship.
The maximum average current drain from the chassis high-voltage supply seldom exceeds 1500 microamperes which means that each of the three guns is delivering a maximum average current of about 500 microamperes or 0.5 ma.
However, the external and internal coatings on the CRT form a capacitor which stores power for higher peak current requirements.
Fig. 2-17 shows the current emitted from each electron gun under various drive conditions. With a setup voltage of 140 volts (G1 to K), the service switch in the setup position and G2 properly adjusted for a white line, you can see that a 140-volt white video pulse will produce about 5.5 ma current from each gun or a total of 16.5 ma. Currents for other video signals can be readily picked off the graph. It is quite normal to have several milliamps current per gun for short durations of time even though the average current is much lower.
Returning to Fig. 2-16, you can now appreciate the concern for the high current spot size. In the 4 to 5 ma range, the upper curve produces a "highlight blooming" condition while the lower curve shows less tendency to bloom. The second area of concern is the 0.25 to 0.5 ma range.
When we focus a tube, we like to see sharp scanning lines.
The difference here is even greater. At lower currents, there is about a two-to-one difference in spot size. The improved focus of the tube described by the lower curve is dramatic.
As the electron beam scans across the face of a shadow mask color tube, the beam is striking the metal of the shadow mask a portion of the time and the holes for the remainder. If the diameter of the beam is small with respect to the vertical distance between the aperture holes, it should be possible for the beam to completely miss a hole on successive lines. The missing of holes by the electron beam results in dark areas on the screen which can form into moire patterns.
The modulation of the beam by the holes in the shadow mask will generate a certain amplitude of modulation, depending on whether the beam partially or fully misses a hole. As the beam scans the entire screen, the variations in amplitude will cause a brightness pattern which can be described as a modulating frequency. Depending upon the placement of the scanning lines, it is possible to have a variation in frequency as the beam scans across the face of the tube. These variations in frequency cause the areas of maximum and minimum brightness to form a swirling pattern rather than a straight line pattern. Moire is generally more noticeable without video information, but it should be considered a problem only if it is objectionable on program material at normal viewing distances.
There is a mathematical formula for calculating aperture hole spacing to minimize moire, which we won't go into, except to say that the shadow mask for each color tube family is designed for optimum performance in the 525 scanning line system used in this country. Even so, the optimum design will yield moire if focus quality is sufficiently good.
It should first be pointed out that optimum focus for best picture performance is not achieved by focusing for maximum moire! Optimum picture performance can best be achieved by focusing on large area bright spots-peoples' faces for in stance. The optimum focus voltage is slightly different at every current level. Focusing for greatest moire will make highlight blooming more objectionable as well as making moire more noticeable. Focusing for best highlight focus will increase low current spot size, reducing moire yet giving the best overall performance. If a picture must be defocused excessively to minimize moire, then the receiver is not properly adjusted or not operating properly! The shadow mask is optimized for moire only if the scanning lines are straight, horizontal, evenly spaced, and properly spaced.
The following approach is recommended to be used on a moire complaint: If it is not objectionable at normal viewing distances, an attempt should be made to explain to the receiver owner that moire is not a defect, but actually an indicator that focus is excellent. Notice that I said, "if moire is not objectionable at normal viewing distances, it is not a defect." Unless the receiver is not operating or adjusted properly, any further attempt to eliminate moire will degrade the picture! If moire is judged to be excessive, the following parameters should be checked to insure that the receiver is operating as it should:
Anode voltage--Adjust to the design value as indicated in the service manual. Excessive high voltage stiffens the beam and reduces spot size.
Yoke rotation--Throw the service switch and check the tracking setup line. It should be exactly horizontal for minimum moire.
Vertical centering--Also measure the location of the setup line. It should be exactly centered vertically.
Height and linearity-The shadow mask is designed for approximately 10 percent vertical overscan of the raster and equal spacing of all scanning lines. Poor vertical linearity or improperly adjusted height will contribute to moire.
Pincushion adjustment--Using a color-bar generator or other device to give a low-level stationary flat field, adjust the receiver to minimum color level, low contrast, low brightness, then observe the moire pattern. Next, adjust the pincushion control through its full range; stop at the minimum moire point. This point should also be the desired pincushion setting, but should be verified by switching to a cross-hatch pattern.
Interlace-Carefully rotate the vertical hold control while viewing the scanning lines. Pairing of lines will contribute to moire. Good interlace should reduce it.
CRT bias-With the setup switch in the service position, determine the setup bias on the CRT (difference between G1 and cathode voltage). The greater the bias, the higher the screen (G2) voltage will be for a setup line. High screen voltages, yield stiffer beams and smaller spot size.
A chassis with a CRT bias control is easily re-tracked at a lower bias by reducing the bias control setting, then re-setting the screen controls. If the chassis does not have a bias control, a lower bias can usually be obtained on the RGB type chassis by altering a voltage divider to raise the CRT G1 voltage. The color-difference chassis is more difficult to alter. However, by utilizing a signal generator and reducing the brightness to a low level, the three screen controls can be reduced to just cutoff and tracking will be obtained without switching to the setup mode.
Generally, the bias of a large screen color TV set should not be lower than 120 volts. After re-tracking the set, all channels should be viewed and brightness and contrast rotated through their full range to be sure video performance has not been adversely affected (Note: Lowering the bias will increase the available contrast).
The final step is to focus for best highlight performance.
Moire should now be eliminated or at least reduced to an acceptable level. It is important to remember that any effort to reduce moire by increasing spot size is accomplished by degrading focus. Care should be taken to insure that spot size is not increased excessively, thereby causing poor focus.
DEFINITIONS
For many, these basic definitions are rather superfluous, but they should provide a firmer foundation for those whose knowledge and skills can use a helping hand. Also, for good measure, we'll repeat some of the more uncommon terms at appropriate intervals as we continue through the text.
Luminance Y (brightness) signal: This is the sum of the color signal voltages delivered by the color camera. The composite video (luminance) signal in color transmission is the algebraic addition of red, blue, and green colors sent as a varying voltage proportional to the brightness information from the color cameras. Therefore, the actual signal seems the same as though it came from a single-tube monochrome camera. When monochrome information only is transmitted, the I and Q color signals are absent and, therefore, the receiver color circuits are inoperative, but the luminance (video) amplifiers deliver a black-and-white image of varying intensity to the receiver's cathode ray tube for picture reproduction. Fine detail above 1.5 MHz is transmitted only in black-and-white during any colorcast.
Chroma: Color information produced by the I and Q transmitted signals with respective bandwidths of 0.5 MHz and 1.5 MHz on either side of the 3.58-MHz color carrier. Q colors range from yellowish-green to purple, while I colors contain bluish-greens to orange. The chroma signal also includes the 3.58-MHz color sync pulse of 8 to 11 cycles.
Hue: The chrominance or color element which identifies a scene or object as being red, blue, green and any shades in between. Colors of the same group, regardless of light content, have identical hues.
Saturation: The saturation of any color determines its content of white light. Any completely saturated color has no white light, but unsaturated colors do, and the degree of this saturation is often called color tint. (Your color receiver's tint or hue control is a phase shifter, while the color control regulates the overall intensity (magnitude) of the color signal.) Color purity: Actually, a field of non-contaminated color.
An expression usually denoting clean landing of color beams on the individual color phosphor dots. In many new receivers, the beams now overscan the phosphor dots for maximum efficiency and any excess beam scatter is absorbed by peripheral material called "black surround." If only red dots, for instance, are lighted, then a properly converged receiver should have only a pure red field for satisfactory color purity.
Static convergence: Convergence of the three color beams at the center of the picture tube so that equal registry produces white as the sum of the three red, blue, and green guns. This is done with three small permanent magnets.
Dynamic convergence: The active tracking of the three scanning beams achieved with electromagnets and correction-scanning voltages so that each gun will track linearly from the center of the tube to all four edges and every beam excites only its appropriate red, blue, or green phosphor. Nine potentiometers and three coils control all dynamic convergence adjustments. There is also a lateral static convergence magnet to move the blue beam sideways. And in some of the cheaper receivers, a red-green lateral magnet has been added recently to further simplify convergence.
Color subcarrier oscillator: The color synchronizing signal transmitted on the back porch of the horizontal sync pulse within the 11.1-microsecond horizontal blanking interval. Burst synchronizes the receiver and transmitter during each line blanking interval.
Line scan: The 52.4 microseconds of forward scan time needed to sweep a single line from left to right across the horizontal surface of a cathode ray tube.
Horizontal or line blanking: The 11.1-microsecond interval used for horizontal blanking as the line scan moves back across the tube and into position for resumption of another forward trace.
Field scan: The vertical scan that deflects the swept line downward. There are two fields of 262.5 lines each in every 525 line vertical scan, and each field is completed in one sixtieth of a second, establishing the vertical time of one-sixtieth second or 16.662 milliseconds. Therefore, two fields-a frame-are complete in two sixtieth of a second or one 30th second. So 30 frames per second are transmitted and received. 525 lines x 30 frames equals 15,750 units, and this is the standard horizontal frequency in Hz. Actually, the color horizontal repetition rate is 15,734 Hz, as we've shown already in the color equations.
Aspect ratio: Television receivers have a picture width-to-height ratio of 4:3, and this is termed aspect ratio.
Interlaced scanning: The sequential field blending of the odd and even 262.5 lines in the 525-line scan for a single, relatively linearly picture. The better the interlace, the sharper the picture, since there will be no conflict and no blurring among (or between) lines.
QUESTIONS
1. What are the three characteristics of color and what do they mean?
2. Why is the color TV process called additive?
3. How many colors can the eye recognize, and where in the spectrum do they appear?
4. What combination of colors produce a white raster?
5. Red, blue, and green modulated colors produce what? Saturated and unmodulated?
6. What are the two types of color-bar generators in general use?
7. In gated rainbow and vectorscope color analysis, why is G-Y not so important?
8. G-Y is one of the demodulated chroma colors, so why isn't it used in vectorscope analysis?
9. What single crystal in both transmitter and receiver must have a very close tolerance? What is this tolerance?
10. What is the most closely regulated circuit (component) in both a broadcast station and TV receiver, and how close must this regulation be?
11. Define "purity" simply.
12. What's different about RCA, Zenith, and G.E.'s cathode ray tubes?
13. Define Moire. Do you think it will be more or less prevalent in the years to come?
14. What is the most important point about G.E.'s new in-line tube?
Next: Receiver Adjustments
Also see:
TV Antennas and Transmission lines
Air Time--An Intro to Television Broadcasting
TV and Radio Tube Troubles (1958)