Even though manufacturers have improved horizontal linearity immensely over early receivers and have provided height and vertical linearity controls that are no longer interactive, we still encounter sweep circuit failures due to component breakdowns, new deflection yokes, flyback transformers and other high-voltage coils and resistors, and vertical problems of one description or another--not to mention the aging of tube, semiconductor, and passive parts.
It's true that a cross-hatch generator can expose nonlinearity equally well or better than a test pattern over the range you can see. But you'll find it hard to estimate overscan with a generator, establish the presence of overshoot and ringing, detect alignment smear, or see signal delays called ghosts, because a pattern generator supplies pulses and dot-bars instead of video. Also, when EIA color bars are broadcast, the saturated tones must be processed at specific IRE ( Institute of Radio Engineers) levels between white and black references for the receiver chroma circuits to produce excellent color (IRE Standard 50, 23.S1). Then there are VIR and the vertical interval test signal (VIT), telecast by a number of color transmitters throughout the country that, along with an EIA color pattern, can characterize most color receivers just about as fast as you can see them. So for all careful adjustments, receiver analytical analysis, and chroma processing, test patterns and VIT signals are all important.
THE RETMA (EIA) RESOLUTION CHART
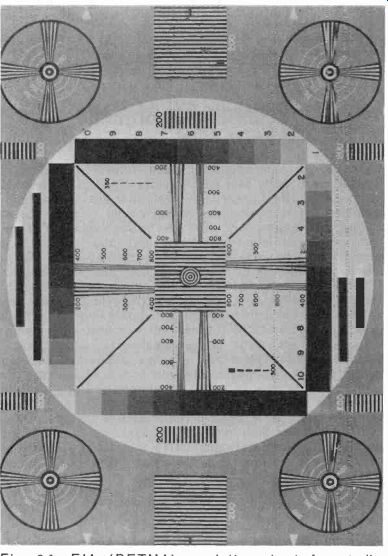
Fig. 3-1. EIA (RETMA) resolution chart for studio camera and receiver setup,
full gray-scale shadings. and vertical wedges indicating a 10-MHz bandpass
(Courtesy Ed Tingley, EIA).
Fig. 3-1 is the Electronic Industries Association's test pattern with gray-scale overlays. This chart was originally designed to test television cameras for streaking, ringing, interlace, linearity, shading, aspect ratio, and gray-scale adjustment. But it's equally appropriate for television receivers, except for aspect ratio. In this chart, resolution measurements have been increased from 600 to 800 lines over the original version, and the gray-scale reflection characteristics are improved. In broadcast transmissions, you may or may not see this identical pattern on the air, but one similar enough to it should be available over at least UHF stations during working hours so that its display can be useful. Now, let's learn what it's good for.
The four pairs of vertical and horizontal wedges consist of four tapered black lines equally separated by three white lines. Numbers located at intervals next to the wedge-shaped pairs are the number of lines that can be resolved vertically and horizontally. If you wish to use a simple equation to determine the response frequency from the line numbers beside each vertical wedge, F(frequency) equals N (line number) divided by K (a constant equaling 80). So a 280-line wedge position, then, would amount to:
280 f = = 3.5 MHz 80
The response is based on a 63.5-microsecond horizontal trace-
retrace interval (one black and one white line) or 250 nanoseconds. And since F (frequency ) equals 1 divided by the time base:
f = 251 0x 10^9 = 4 MHz the fundamental video frequency.
If the line number on the chart was actually 320, then 320 divided by 4 MHz would be N divided by F equals K. and K would then amount to a constant of 80. So this is what we mean by 4 MHz being the fundamental video frequency. Had you known that line 280 denoted 3.5 MHz, 280 divided by 3.5 MHz would have also equaled the constant K of 80. An EIA list of line numbers and the corresponding frequencies appear in Table 3-1, so the next time you see numbers about the horizontal and vertical wedges, you'll be able to read them:
Vertical Wedge Line Numbers Fundamental Video Freq.
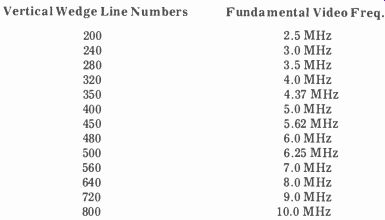
Table 3-1. EIA test pattern video response chart.
We hope you remember that these are vertical wedges rather than horizontal wedges, for which the response has been calculated. The reason for this is that vertical wedges determine horizontal resolution, and, therefore, the high-
frequency response of the receiver. The horizontal wedges, of course, show the low-frequency response and are calculated at a 60-Hz or 16.67-millisecond rate rather than the 15,750-Hz or 63.5-microsecond time of the vertical wedges. And since we're not really interested in the low-frequency response of the average color or monochrome receiver (it should approach DC somewhere), the calculations will be left to you, if you wish to make them. Beware, however, since vertical resolution (horizontal wedges) is very dependent on the size of the scanning spot on the CRT. In addition, 7 percent of the theoretical 525 scanning lines are taken up in blanking, so the perfect receiver would resolve only 490 lines, and most do considerably worse than that. Therefore, it is customary to state only that a receiver will vertically resolve a certain number of lines.
Horizontal Resolution (Vertical Wedges) Although this is a basic means of determining the upper frequency response of any television receiver, you'll find later that the vertical interval test signal (VIT) is more exact, while a sweep generator modulated by a 45-MHz sine-wave is more precise in bandpass and rolloff evaluation. Should the test pattern fail to supply numbers along broad vertical wedges, select a point midway between its ending and top, call this about 200 lines, and proceed logarithmically from there to 320 lines; a very crude measurement indeed, but something near the ballpark.
Calibrated or uncalibrated, EIA or Indian Head, these test patterns have enormous utility. Ringing at selected frequencies can be seen on patterns with broad vertical wedges. The indication trails the wedge at some line point equivalent to the spurious frequency. In the EIA pattern, the single line of solid, diminishing rectangles in the lower left and upper right portions of the pattern (within the gray-scale bounds) will immediately show ringing, since the vertical wedges cover multiple scanning lines.
Picture IF amplifier regeneration can be detected by fine dark lines crossing the vertical wedges at the frequency of oscillation. Such conditions are especially evident on weak signals where the amplifier gain is high. The frequency of some types of interference might be determined, too.
Therefore, everything from interference, to bandpass, to receiver or even broadcast station deficiencies can be ob served and often diagnosed, not forgetting for a moment that vertical size and linearity checks must be made for proper deflection so that the picture aspect ratio remains in its correct proportion (9:3).
Faults Apparent In The Overall EIA Pattern Shading may easily be checked for a uniform gray background and the 10 steps of gray scale by viewing all four overlays forming a square around the center of the pattern.
Streaking of the top or bottom horizontal black bars indicates low-frequency phase shift or poor DC restoration.
These same black bars help adjust camera high peaking circuits to compensate for high-frequency rolloff.
Interlace may be evaluated by single, clean diagonal lines inside the gray-scale square extending outward from the 400 800 line markers.
Improper fine tuning can produce a smeary pattern with poor video definition and often bad sound and sync. A misaligned automatic fine tuning circuit (AFT) will also cause pattern problems.
Corner linearity, for a uniform raster and, perhaps, pincushion settings, can easily be evaluated from the four outer circles, which also indicate corner line resolution. Not much over 280 center lines and probably no more than 200 lines corner resolution is the best to expect from very good receivers.
Secondary images that are reflected and aptly named "ghosts" are very evident in any test pattern. In Section 13 you'll learn how to roughly find the origin of these reflections by calculating certain distances.
Determining Interference Frequencies Ringing, of course. can be easily detected in the EIA photo from the rectangular dashes in the lower upper right and lower left corners of the test pattern, as indicated earlier. But you can determine the exact frequency (f) if you have a good, wideband, triggered oscilloscope. Simply count the number of oscillations, establish your time in microseconds, and use the following equation:
f = N X 10^6/T (Microsec) where N is the number of oscillations.
Fig. 3-2. Ten horizontal black lines resulting from overriding the input RF amplifier. Frequency here is 700 Hz.
Fig. 3-3. When interference bars are vertical, divide by the line scanning rate of 52.4 microseconds to find the interfering frequency.
TVI: In instances where fine calculations may be difficult, or you simply want to confirm mathematical estimates, TVI (television interference) may be found precisely by using a sweep generator with a 10-MHz sweep width. Uncouple but lay the antenna leads close to the antenna terminals, attach the sweep generator (with internal marker) to the receiver antenna terminals, and take the output off the video detector load resistor. Three pips-the video carrier, generator marker, and interfering signal) will all appear on the RF-IF response curve. Simply tune your generated marker to coincide with the interference and you have an exact frequency measurement. How to get rid of this annoying problem is analyzed in Section 13.
But if you wish to find a gross difference interference, but not a fundamental, divide the number of black or white bars by 15.2 milliseconds (approximately the forward vertical trace time) if they're horizontal. In the next two instances, we overrode the input RF amplifier and did find the approximate fundamental, but this won't happen often unless your disturbance is overwhelming. With moderate signal strength interference, such signals may be found by matching the number of lines appearing on the screen with those from a calibrated function generator. We'll demonstrate this later.
Meanwhile, in Fig. 3-2 there are 10 horizontal black and white bars with a signal generator input of 2 volts, so the frequency (f) would be:
f = 1.(53- x 10-3 = 667 Hz
The actual frequency as measured by our Exact 124 multi-generator was 700 Hz, and that's pretty close for such count-and-divide work. If you took the very easy approach and multiplied 10 x 60 Hz, the vertical repetition rate, the answer would have been 600 Hz, a figure that is not as close. So the vertical trace rate in milliseconds is the more accurate, since the full 16.67 millisecond-cyclic rate includes about 1.4 milliseconds retrace.
The same principle is used for higher frequency interference, but with two notable exceptions : The line scan rate is now 52.4 microseconds, and the interference beat or bars are now either diagonal or vertical. To illustrate (Fig. 3-3), we'll put in an Exact sine wave of 1 MHz and see how this figures. Since there are 5 bars:
f-52.4 x 10^-6 = 955 kHz
fairly close to the 1-MHz calibrated signal input. If we had simply multiplied by the horizontal frequency rate of 15,750 Hz, the answer would have been 788 kHz, more than 200 kHz off frequency.
If the number of lines are more than you can count, say in the 50- to 200-MHz region, simply count an inch's worth, multiply these lines by the width of the picture tube and divide by 52.4 microseconds. You should arrive at a relatively reasonable answer, if you have a brute force millivolt or volts input signals.
NTSC COLOR PATTERN
The NTSC color-bar pattern (Fig. 3-4) means a great deal more than simply a few colors following a block of in determinate white. This or a similar type color pattern is broadcast early every morning by stations all over the country so that transmitter color registration can be aligned to accommodate the three primary red, blue, and green picture tubes in the camera, and to establish basic transmitter levels prior to transmission. Signals are electronically generated by a color generator, beginning with a gray bar and proceeding through 6 other bars of yellow, cyan, green, magenta, red, and blue-all saturated EIA colors. Color generation may then be monitored by a highly accurate studio-type vectorscope that can measure phase and chroma amplitude to help prevent errors in color transmission.
VECTOR COORDINATES
The vector presentation graphically displays the relative phase and amplitude of the chrominance signal on polar coordinates. To identify these coordinates, the graticule on a Tektronix Type 250 vectorscope (see Fig. 3-5) has points which correspond to the proper phase and amplitude of the primary and complementary colors: R (Red), B (Blue), G (Green); Cy (Cyan), YL (Yellow) and MG (Magenta). Any errors in the color encoding, video tape recording or transmission processes which change these phase and-or amplitude relationships cause color errors in the television receiver picture. The polar coordinate type of display such as that obtained on the Type 520 CRT has proved to be the best method for portraying these errors.
The polar display permits measurement of hue in terms of the relative phase of the chrominance signal with respect to the color burst. Saturation is expressed in terms of the displacement from center (radial length) toward the color point which corresponds to 75 percent (or 100 percent) saturation of the particular color being measured.
The outer boxes around the color points correspond to phase and amplitude error limits per FCC requirements (plus or minus 10 degrees, plus or minus 20 percent). The inner boxes indicate plus or minus 2.5 degrees and 2.5 IRE units and correspond to phase and amplitude error limits per EIA specification RS-189, amended for 7.5 percent setup.
An internally generated test circle matched with the vector graticule verifies quadrature accuracy, horizontal-to-vertical gain balance and gain calibration for chrominance signal amplitude measurements. Two methods of measuring phase-shift are provided. Large phase-shifts can be accurately read from the parallax-free vector graticule. A precision calibrated phase shifter with a range of 30 degrees, spread over 30 inches of dial length, is provided for measuring small phase-shifts.
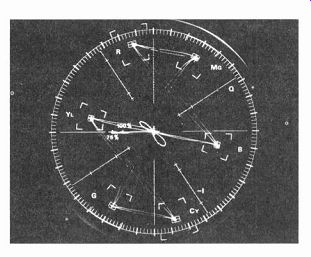
Fig. 3-5. Vector display, full field color bars, 75 percent amplitude, 100
percent white reference, 10 percent setup.
Conforms to EIA standard RS189. Type 140 NTSC test signal generator used as signal source. (Courtesy Jim Walcutt, Tektronix)
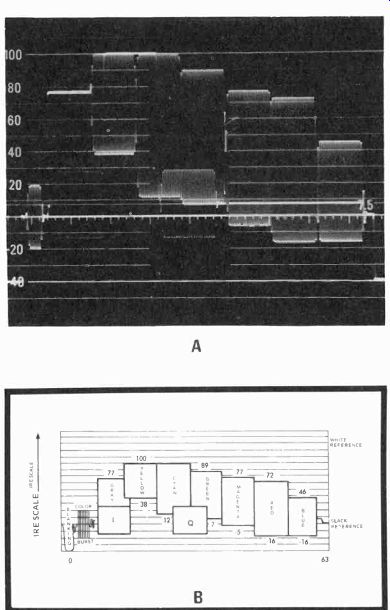
Fig. 3-6. Line rate display (A) of EIA color bars. (Courtesy Dan Guy, Tektronix.)
Drawing (B) of the EIA color pattern used to describe color placement and
EIA labels.
Notice the levels also of the blanking and color burst. Both should always be seen in this display.
An actual photograph of the NTSC color pattern as seen by a color monitor is shown in Fig. 3-6A, while the line drawing in 3-6B identifies all elements in the general pattern. Scale at the left is the established IRE scale equaling 7.14 millivolts per IRE unit. And since there are various color levels from -20 to 100, the entire 120 units should be seen in 7.14 x 10 3 x 1.2 x 10 2 , or 0.856 volts or more on the screen of any well calibrated oscilloscope. Observe that yellow and cyan begin at 100 IRE units and extend down to 38 and 12, respectively. Green is 89 to 7; magenta, 77 to-5; and red and blue begin at 72 and 46 each, but stop at IRE-16 together. Burst reference must swing +20 and-20, or 40 IRE units total.
Obviously, transmitters can be adjusted to these values, but can home receivers reproduce these same levels without drastic modification because of distance from the place of origin, terrain, weather, man-made deflection objects, various antennas, good-to-poor lead-in, couplers, and the basic characteristics of the receivers themselves. In making such a picture, we didn't attempt to put an IRE scale on the oscilloscope, but from its calibrated grid markings you should be able to gain a pretty fair idea of what a good home color receiver can do. Remember, however, this picture was taken just after the video detector, and does not represent the color picture on the kinescope. The results, nonetheless, are an exceptional indication of what a home receiver will divulge under these circumstances.
Fig. 3-7 is the photograph of an EIA-NTSC pattern taken at 5:30 AM EDT from one of the broadcast channels in Washington D.C. Transmission distance is almost 40 miles, and there is a 2-way VHF coupler between the receiver transmission line input and the antenna. Receiver is an RCA CTC46. The vertical attenuation setting is 2 volts per division.
Compare the perfect pattern in Fig. 3-6A to Fig. 3-7. This is a very tough comparison because of transmission, reception, etc., but notice how closely it compares with the original picture? The almost identical levels, the mostly very clean cutoff of the various color frequency oscillations, the I and Q positions, color burst, relative amplitudes, and all characteristics are there to be carefully observed. What you will really find is that with this color pattern and the VIT test signal, you may characterize almost any commercial television receiver in very short order, and do it technically and not subjectively.
In the future, should you use this pattern to any extent (depending on the time it's broadcast), you will find that it will tell you immediately if the receiver needs alignment, how the overall color is processed (at least through the video detector), how good the burst amplitude is, the Q and I placement portions, and the shape of the horizontal blanking pulse. Be sure you check fine tuning, however, since this can always have a radical effect on positioning of the 50-percent chroma video IF response points.
VERTICAL INTERVAL TEST SIGNAL (VIT)
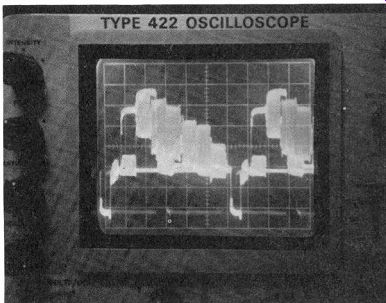
Fig. 3-7. Photo of the EIA color pattern as seen on an RCA CTC46.
The Federal Communications Commission permits transmission of test signals between lines 17 through 20 of the vertical interval of each field for such checks as reference modulation, system performance, cue and control signals.
Most all broadcasters use VIT signals with variations, but all usually include multi-bursts, white-and-black reference lines, a large rectangular window pulse, a sine-squared pulse, and either a modulated or unmodulated staircase. (As of April 1, 1972, the VIT signal was required for remote transmitters.) You may quickly judge relative amplitudes, white and black levels, the horizontal blanking interval, burst, gray-scale and differential phase. The window signal is used to gauge transient response, distortion, ringing, etc. If drawn in strict line sequence, the signal would look like it does (if perfect) in Fig. 3-8. Add a modulated staircase of the color bar between lines 15 through 21 and the burst phase, together with all other subcarrier frequency components of the test signal outputs, may be checked for phase variation. If a modulated staircase signal is inserted on lines 18 or 19, or a 73-percent amplitude, full-field color-bar signal included, the entire video signal can be tested while programs are being broadcast. The VIT signal, then, is thoroughly useful in the studio, obviously. But what about in the receiver' The vertical interval test signal arriving at the receiver is probably not particularly affected if the antenna trans mission lines, and 2- or 4-set couplers are of good quality. At least that's the preliminary indication we have. So you actually have a very solid view of what an individual receiver is capable of, simply by looking carefully at the VIT on the graticule of your oscilloscope.
The photograph in Fig. 3-9, was taken at 2 volts vertical per division and a sweep of 10 microseconds per division. The scope can't possibly separate lines well in such a sequence, so the following staircase gray level is superimposed over the rectangular window. The only actual peculiarity we notice is that there is a 0.75-volt spike at the end of what would be the 4 MHz multiburst oscillation, and once more just before the window. This is probably some induced transient used for special peaking, appearing at 30-microsecond intervals. On ...
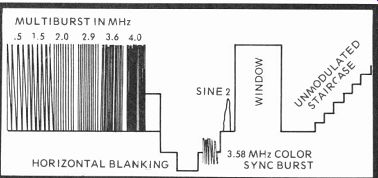
Fig. 3-8. Vertical interval test signal (VIT) transmitted between lines 17
and 20 of the vertical scan interval; another aid in checking receivers for
proper operation, alignment, etc. Good resolution of this pattern takes a
better than average scope-no AC recurrent sweep types.
It must resolve horizontal lines cleanly at 10 microseconds per division.
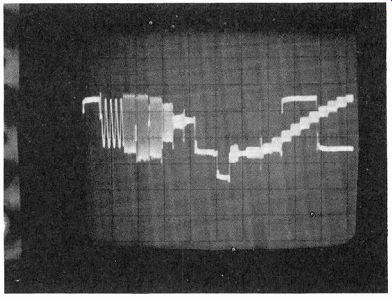
Fig. 3-9. Actual photo of a good resolution VI T on an RCA CTC46. Bandpass
is 3.5 MHz.
... another channel (Fig. 3-10), the spike was less pronounced and the multiburst amplitudes much more even in amplitude, but the window signal was not apparent in the transmitted pat tern. So there are undoubtedly both transmission and reception variations that need to be taken into consideration, but there shouldn't be any difference in the fundamentals. If there is any real doubt, simply compare one receiver with another, and the comparison will then become relative.
If we were to analyze Fig. 3-9, we'd find that the RCA CTC46 shows a good bandpass down to 3.6 MHz with a little rolloff, possibly some high-frequency response peaking, no amplifier ringing, good differential gain characteristics with a fairly linear modulated staircase. On the second channel checked, the multiburst did not exceed the amplitude of the white reference, and the five discernable frequency bursts were somewhat more uniform in height. Obviously, the receiver is not in need of alignment. Its quality is much better than average, and with such a pattern you can be certain of excellent operation. Staircase nonlinearity, we're told, is often due to network transmission and modulation by the 3.58-MHz signal. An unmodulated staircase should be straighter and considerably more linear than the two shown.
In checking with broadcasting stations, we learn that VIT patterns are somewhat variable, in that the network may run some amplitudes in the multiburst higher than others at various times, and that some standard signals may or may not be included during the various telecasts. Therefore, if you are concerned over the appearance of any VIT signal, simply phone the station telecasting the channel to which you're tuned and ask engineering to look at the VIT signal coming off the network and the one bat's locally transmitted. We found they were happy to comply.
Another caution in using these patterns: You may find that several well-known sets don't show more than a 2.8-MHz IF passband. This is said to be due to any number of subjective considerations, one of which may be a "smooth" picture.
Nonetheless, this does cut down on fine detail in the picture. A 2.8-MHz IF receiver obviously won't pass the band of frequencies that a 3.6-MHz IF se: will. In addition, always check the fine tuning before studying the VIT or color pattern, and be sure your antenna is not loaded with couplers, SWR, and a poor quality feeder line.
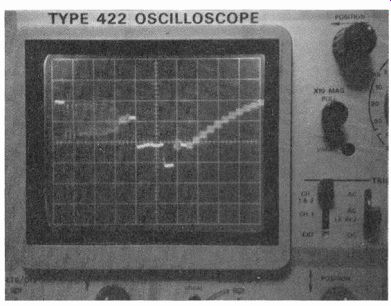
Fig. 3-10. Second station VIT; not quite as outstanding, and with no window.
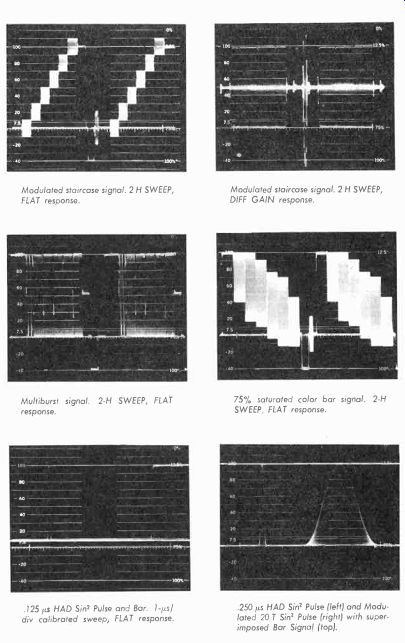
Fig. 3-11. Various NTSC signal generator displays.
(Courtesy Tektronix)---- Modulated staircase signal. 2 H SWEEP, FLAT response.
Multiburst signal. 2-H SWEEP, FLAT response.
.125 /is HAD Sin, Pulse and Bar. 1-1(s/ div calibrated sweep, FLAT response. Modulated staircase signal. 2 H SWEEP, DIFF GAIN response.
75% saturated color bar signal. 2-H SWEEP, FLAT response.
-20
.250 µs HAD Sin' Pulse (left) and Modulated 20 T Sin' Pulse (right) with super imposed Bar Signal (top).
As a further aid to understanding the VIT and other signals, even though these are used almost entirely for studio system checks, Fig. 3-11 is a series of patterns generated by Tektronix NTSC signal generators in various generating modes.
THE VERTICAL INTERVAL COLOR REFERENCE (VIR)
It would be a definite advantage if black reference, sync, color burst, and especially the phase and amplitude of the chroma signal received automatic compensation at the broadcasting studios before transmission. No more hue and chroma amplitude adjustments, not even when a switch is made from camera to camera or when a commercial comes along with the expected magentas and cyans creeping in everywhere. The broadcast companies and the FCC Field Tests Subcommittee, headed by Eric M. Leyton, are all working on the manually controlled initial stages of this development now (1972).
The VIR signal (Fig. 3-12) is expected to be added to the broadcast signal at the output of the studio control room and placed on line 20. Substantially, as in the beginning, and as shown in the illustration, the entire sequence will be contained in one 63.5-microsecond forward scan and retrace line. Its order and content are as follows: The interval from the beginning of horizontal sync pulse to the end of blanking level is 12 microseconds, where the color burst is also included. The signal then rises to a level of 50 IRE units where the chroma reference bar is placed between 50 and 90 units, with 70 IRE units as the center reference. This bar lasts for 24 microseconds, and is then followed by the luminance reference at 50 IRE units for 12 microseconds. Following this is a sharp downward transition to the black reference level at 7.5 IRE units that also lasts for 12 microseconds. Afterwards, the blanking level begins, followed by the sync pulse and another burst.
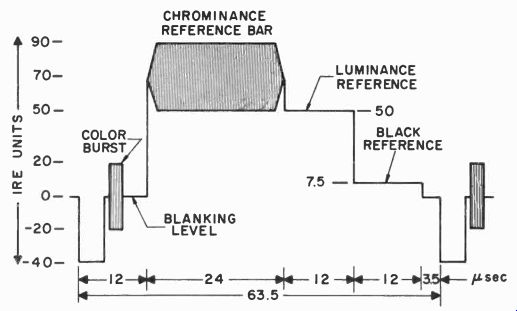
Fig. 3-12. The VIR signal scanning on line 20.
Should this or a similar station-transmitted signal be adopted as a national standard, broadcast stations would be required to keep their transmitters adjusted to such references at all times, and receiver manufacturers could then design somewhat more closely so that many of the color and luminance problems we have today could be largely eliminated.
Further, should the VIR signal-like the VIT signal-be required as the VIT currently is for broadcast remotes, field personnel would have a highly reliable means not only to adjust and repair faulty sets, but could easily evaluate receivers on the basis of these two or three (the EIA color pattern) signals so that future "eyeball" guessing would be eliminated when the new lines appear.
ADJUSTMENTS---Automatic Gain Control (AGC). Some receivers, such as RCA's CTC 46 chassis, do not have an automatic gain adjustment, while others have two. The normal IF AGC setting usually determines the DC bias to the first and second video IF amplifiers, limiting the operation of these stages so that neither they nor the following third video IF or subsequent video amplifiers will overload and cause "sync bends" and picture distortion. Severe cases of AGC maladjustment will even produce negative pictures, where whites and blacks reverse in the scanning scene. The ordinary color receiver has a transistor-resistor or diode-resistor isolation or voltage drop system, called a "delay," so that the RF amplifier will be controlled only when the IF source is fairly full-on. Other receivers have an additional RF control, such as Motorola, that can be set simply by watching the picture for proper signal gain. The IF AGC is always set on the strongest received channel.
Noise Control. Noise controls are found only on the more deluxe receivers and require additional circuitry to function.
The purpose of a noise control circuit is to cut off sync and often video for several nanoseconds or perhaps microseconds when a transient of noise from some source enters the video IF amplifiers. Receivers without noise circuits are usually disrupted for the duration of such an undesirable spike of spurious voltage. The noise adjustment often is related to the AGC adjustment, and you may have to set the noise circuit bias first before regulating the AGC.
Fine Tuning. The fine tuning adjustment simply varies the oscillator frequency. But fine tuning of the receiver's local oscillator also moves the video, sound and chroma response around the receiver's IF passband, and can very easily detune the entire picture or cause interference between sound, video IF carrier, or chroma that will result in all sorts of undesirable distortion. Especially is this true of the 920-kHz beat between the 4.5-MHz intercarrier sound and 3.58-MHz chroma sub-
carrier which produces annoying fine lines in the picture.
Without picture distortion, these same fine lines (but at different repetition rates) can also come from improper filtering of the 3.58-MHz receiver-generated subcarrier following the R-Y, B-Y, G-Y demodulators. Of course, this can't be tuned out and is a clue to telling the two disturbances apart. Also, when fine tuning affects both definition and probably contrast, the set may need alignment or, at least repair.
Horizontal Linearity, in vacuum tube circuits, usually shapes the current in the damper-flyback transformer primary for the best linear sweep. In at least one model solid state color receiver, this control is in series between the side pincushion transformer and a primary winding on the flyback transformer. The other end of same flyback winding is connected directly to the receiver's high-voltage adjust. Current through the linearity coil, then, is adjustable to aid the pin cushion transformer and deflection yoke in linearly con trolling horizontal scan. In the CTC 46, the older vacuum tube Motorola receivers and several others, the linearity control is factory preset and need not be adjusted unless a new HV transformer, pincushion transformer, or deflection yoke is installed. Then, you may or may not have to adjust it (by distributor or manufacturer's instructions), depending on how the resulting pattern appears. As a reminder, in all linearity, height, or width adjustments, use a crosshatch signal first for symmetry, then check the raster size.
High-Voltage Adjust. Often, this is a simple dark current (CRT) setting using a calibrated meter, high-voltage probe, and no raster. In some of the new receivers, the high voltage, like the linearity coils in others, is already factory preset. And in Zenith's new solid-state receiver, there is no high-voltage adjustment. In many older receivers, it is necessary to measure the horizontal output tube cathode current while adjusting an efficiency coil so the HV section operates within the prescribed 23 to 27 KV limits. And in those receivers with high-voltage rectifier tubes and shunt regulators there is the possibility of exceeding the 0.5 milliroentgens prescribed as the maximum safe level of x-ray radiation by the National Center for Radiological Health. Newer receivers, especially the solid-state sets, have a different means, including brightness limiters, of handling excess CRT beam current and high voltage. If there is a horizontal output tube cathode current measurement, it is for a minimum, and certainly around 200 milliamperes. The efficiency coil, you may know or remember, is a means of linearizing the deflection yoke current as it passes through zero between the small overlap interval when the damper tube cuts off and the horizontal output turns on. After the efficiency adjustment is completed, of course, the high-voltage potentiometer is set with the HV probe in contact with the anode of the cathode ray tube (brightness extinguished).
Vertical Height & Linearity. It used to be that servicemen were continually cautioned that any adjustment of vertical height and linearity would cause convergence and purity shifts. Now, one manufacturer simply cautions that "large excursions may affect dynamic convergence. Adjust before converging set." In other sets, especially one monochrome version, the height and linearity controls are entirely in dependent of one another and adjustment is no longer interactive as it is on most receivers.
In the tube receivers, the vertical height often adjusts the DC bias on the vertical output tube grid, thus varying the drive to the tube and so causing an increase in the vertical amplitude of the output waveform. The vertical linearity control limits the plate current of the vertical oscillator, and so affects the charging time of the time-constant capacitors in the oscillator circuit and, consequently, the forward trace linearity of the deflection yoke current. Height usually affects the bottom of the picture, while linearity seems to work principally on the top. However, in most receivers they are interactive, since they are part of a single oscillator-output triode-pentode combination tube circuit. In semiconductor sets, the height is found in the collector of the vertical oscillator, and the linearity control often varies the feedback from a push-pull complementary symmetry transformerless output circuit to the base of a pre-driver stage following the vertical oscillator.
Other adjustments such as master brightness, AccuMatic, Tint Guard, Instamatic, AFT, deflection yoke tilt, pincushion correction, screen, CRT bias, background, Color Commander, color temperature, horizontal frequency, etc., are either special settings or color adjustments that are unique to each receiver. The hue (tint) and chroma controls are more or less individual for each receiver, except that the hue control must move the color pattern (as generated by a color-bar generator) at least 30 degrees on either side of the center setting, so that fleshtones are normally seen on broadcasts when the control is in its mechanical center, with greens on the left and purples on the right when turned to either extreme.
Automatic tint control and sepia shading are two other set tings that are related mostly to one series of receivers.
We also might include a color killer adjustment that some receivers still retain and which is simply tuned for minimum color snow on any off-channel setting. There is, too, a high-low power transformer line voltage setting that adds or removes additional turns on the primary of the power transformer so that the receiver operates as closely as possible to the normal standard of 117-120 volts-its design center. It's wise to check the line voltage with a meter if there's any possible doubt.
THE NBS NATIONAL TIME CHECK
As this book is written, the National Bureau of Standards, Boulder, Colorado is working on an experimental time-code system that could give every television owner in the U.S. a precise time check or clock set within 2 or 3 microseconds over most of every 24-hour day, or for at least the time your local television station remains on the air.
This proposed time- and frequency-check system operates on a 1-MHz carrier during the scan portion of line one and is decoded at the receiver by a phase-locked oscillator, somewhat similar to the regenerated color subcarrier in any color receiver that uses a phase correction loop. This means you would have a 1-MHz test frequency and time signals as well. For TV stations, an entirely independent "alphameric message processor and video display unit" is included as part of the proposed system. Here, messages can be transmitted during the line 1 intervals not used for the time and frequency signals, which occupy the first four lines number 1 (there's a number one line each frame) of each second, leaving 26 first lines for other information transmissions. Messages up to 512 characters long may be sent in approximately 15 seconds.
The TV station's time would be automatically corrected, plus there would be a one-way message channel of some 400 words per minute, a video title generator, a 1-MHz frequency source and a 1 pps pulse train. The system has already been field tested in Denver, Cheyenne, Los Angeles, and Washington, D.C.
For the standard home receiver, a single integrated circuit will decode and set an electric clock, and with additional circuits it could be made to produce binary coded decimal signals for hours, minutes and seconds that could appear at some point on the CRT face during any period manually selected by the home owner. There is also a means for identifying the individual time zones, with automatic corrections for daylight savings.
NBS warns that existing receivers are not "easily" modified for such displays, and recommends that any such IC or circuit and clock be installed by the manufacturer before the new receiver leaves the factory.
QUESTIONS
1. In color TV evaluation, name the two most valuable test patterns.
2. Calculate frequency in vertical test pattern wedges if the constant is 80; the line-wedge response is 195 lines.
3. When you "read" vertical test pattern wedges, are you looking at high- or low-frequency response?
4. Name some of the problems that can be identified by viewing an EIA monochrome pattern?
5. What instrument can exactly determine interference frequencies? How do you do this mathematically?
6. A vectorscope is used basically for what?
7. What is a good way to determine if a set needs alignment without using a sweep generator?
8. Are noise and AGC adjustments ever related. Which is adjusted first?
9. Why is fine tuning so important?
10. Do all receivers have high-voltage adjustments?
11. What adjustments were originally thought to cause large purity and convergence shifts?
12. How do you adjust the color killer?
Next: Purity, Gray-Scale & Convergence Procedures
Also see:
TV Antennas and Transmission lines
Air Time--An Intro to Television Broadcasting
TV and Radio Tube Troubles (1958)