by Howard A. Roberson
Tape tests and comparisons are aimed at pointing up performance differences between specific tapes. But the fundamental similarities between tapes are worth examining, too; they are the forest of context for these individual magnetic "trees."
Magnetic Properties
The most fundamental diagram of tape performance is the hysteresis loop, which shows the tape's response to magnetizing and demagnetizing forces. Figure 1 shows loops for three cassette formulations (loops for open reel tapes have the same basic shape). The plots show flux density as a function of magnetizing force. For each tape there is a saturation point, where the flux density is at a maximum (Bmf, and further increases in the applied field will not induce more flux.
If the applied force is reduced from the saturation point to zero, the flux on the tape does not return to zero. This residual flux density (Br) is called retentivity; without it, there could be no tape recording, as the flux would disappear from the tape when the recording force was removed.
The Bm and Br points are marked for the metal tape, and the corresponding points for the other two tapes are easily seen. The "squareness" ratio listed on many technical data sheets is the simple ratio Br/Bm.
If a magnetic field of reverse polarity is applied, the flux will be reduced-all the way to zero, if this negative force is sufficient. The force required to reduce flux to zero is called the coercive force, or coercivity, and is designated as He.
We can see the possible advantage in having high saturation flux densities, though that requires higher magnetizing force-a possible challenge to the recorder designer. Coupled with a high squareness ratio, a high Bm provides high retentivity. The high Bm of metal tape (more than twice that of the other tape) is quite noticeable in the figure. Quite a few Type I (normal ferric) tapes, however, have retentivities that match those for Type II (high bias) tapes.
Metal (Type IV) tape's advantage extends to its much greater resistance to erasure; Type II tapes are also superior to Type I formulations in this respect. Coercivities are on the order of 1100 oersteds for Type IV (metal), 350 to 650 for Type II, and 280 to 375 oersteds for Type I. These figures are actually developed with d.c. magnetization and demagnetization. Figure 1 also includes two dashed, demagnetization-loss lines, showing the extent to which the saturation loop's Br might be reduced at higher frequencies by short-wavelength demagnetization effects such as self-erasure. Because of its low coercivity, Type 1 tape is much the most vulnerable to erasure of high frequencies by small magnetic fields such as might come from magnetized heads.
While Fig. 1 shows the tape's performance as it is cycled through saturation, it is, of course, common for magnetization and demagnetization to occur with smaller magnetic fields, resulting in lower flux densities, as in normal recording. A series of nested hysteresis loops, at flux densities from zero to saturation, form the natural magnetization curve. It is most linear in its central region, away from both zero and saturation. A.c. bias effectively linearizes the magnetization curve, and this linear range covers about ±0.3 Bm. In the 10-dB range from ±0.3 Bm to ±Bm (saturation), the curve is nonlinear, and overload distortion increases with increasing level. Examination of the signal-to-remanence curves of several tapes showed researchers that these curves were a nearly exact match, when normalized.
From this, an equation was derived have a headroom of 10 dB between the point where the level of third harmonic distortion (HDL3) was 1% to saturation. This does not mean that all tapes have the same distortion level vs. recording levels; it does say that changes in recording level will cause the same relative changes in distortion.
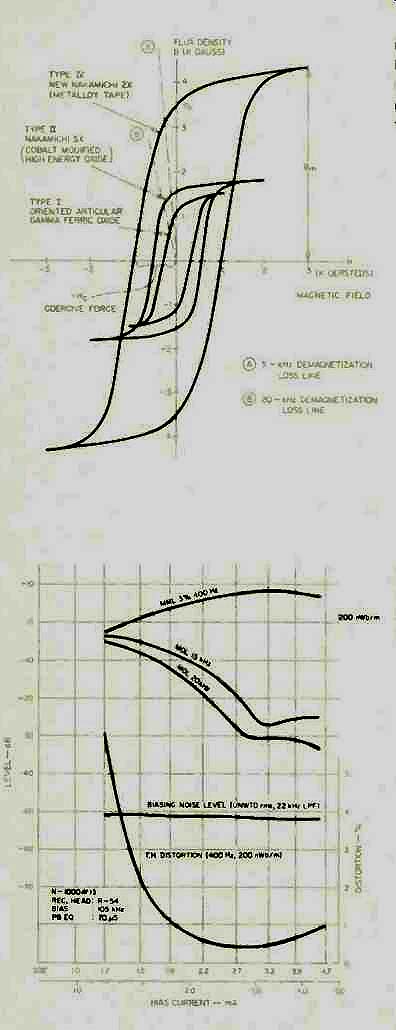
Fig. 1--Hysteresis loop characteristics of three cassette tape formulations.
Fig. 2--Effects of bias change on Nakamichi SX tape.
Effects of Bias
It is common knowledge that high frequency response and distortion change with bias level. So do several other tape characteristics. Figure 2 shows how the characteristics of one tape. Nakamichi SX, change as bias current is varied. As bias is increased above 1.2 mA, the 3% distortion limit (MML) at 400 Hz increases steadily, but the MOLs (maximum output levels or saturation limits) for 15 and 20 kHz drop a great deal. Distortion at 400 Hz with a flux level of 200 nWb/m decreases very sharply at first, then more gradually, reaching a minimum at about 2.9 mA of bias, then rising as bias is increased beyond that. Bias noise level changes very little with bias current.
It is not surprising that many audiophiles get somewhat confused when they see such a data sheet, because it's hard to reconcile the idea of flat response with the great discrepancies between the 400-Hz MML and the 15 and 20-kHz MOLs. In actual recording and playback, though, equalization is used to flatten the response. The main point to keep in mind here is that bias is a fundamental factor in frequency response and distortion.
Frequency Response
In general, the perfect amplitude response vs. frequency curve would be exactly flat with no deviations over the entire audio range. (There's little advantage, of course, in responding to frequencies below the lowest musical frequencies--music-search systems excepted--or to noise frequencies above the audio band.) In the past, tests have shown that by adjusting bias (and equalization), it was possible to make the frequency response of almost all tapes of any given type (I, II or IV) almost exactly the same for a given deck. It seems quite impossible, therefore, to state that any one tape does or does not have flat response.
While both bias and equalization affect frequency response, recorders which offer front-panel equalization trim adjustments are a rarity, with designers leaving manual EQ adjustment to the manufacturer or service technician. The deck comes with bias and equalization either set up for the manufacturer's choice of tape or under the control of an automatic adjustment circuit. If a user control is included, it will probably be a bias trim adjust; and if the user needs to do a little response trimming, he will probably use bias to do it.
But bias affects some inter-related problems. First, bias level has a direct relationship with distortion levels, and there is no direct indication of what is happening to distortion when bias is used to trim the response. Another potential problem is that, with many cassette decks, the best noise-reduction tracking may be obtained with the response somewhat un-flat. Recording sensitivity also affects noise-reduction tracking, of course, which is a further complication in selecting tapes and compensating for the differences from the manufacturer's set-up tape. The user is often best advised to try tapes which match the set-up tape's bias needs and sensitivity, to minimize response deviations when using noise reduction.
Recording Media Requirements
Matching the recording medium to the characteristics of the material being taped is a basic challenge. Figure 3 shows two curves of music spectra.
One is an average of measurements made by Richard C. Cabot and others of levels and spectra in rock music.
The other is based on measurements by Daniel Queen of maximum levels in live music. Placed somewhat arbitrarily on the figure's reference levels, notable similarities can be seen between the curves. Of particular interest is the fact that the fall-off in levels above roughly 1 kHz is close to a-6 dB/ octave rate. Tape MRLs show the same slope, as we noted previously.
Work on orchestral instruments by David A. Luce has shown that their upper spectral envelopes have roll offs of 10 dB/octave and more, with corner frequencies as high as 1300 Hz. An averaging of his curves would show a rough correspondence to Fig. 3, but a steeper roll-off above 1 kHz.
Figure 4 plots maximum octave band levels of a rock-music FM station and two Mobile Fidelity recordings.
The plots (made with an Ivie IE-30A analyzer in its accumulate mode) were deliberately shifted vertically to place their upper-end slopes close to the same reference -6 dB/octave line.
The broadcast signal appears rolled off at both ends. The opening of Respighi's "Feste Romane" contained considerable low-frequency energy, with a general drop in level above that region. The Hall and Oates record had energy distributed across the audio band, with the region around 500 Hz more elevated. It can be seen that if the same high-end criterion is used for all three cases, the mid-band levels will differ greatly for each-and if levels are set for equal mid-band energy, high-frequency levels will differ just as greatly. How, then, can the user set levels correctly to prevent distortion at the high-frequency end?
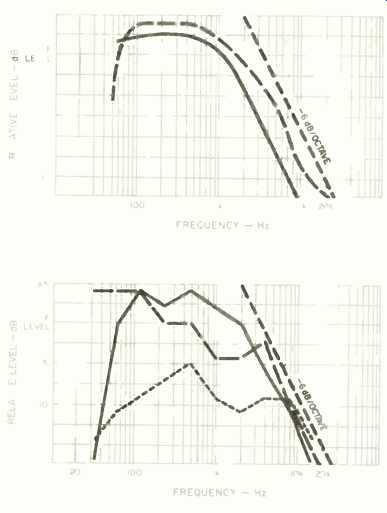
Fig.3--Music spectra, after Cabot et al. (solid line) and Queen (dash
line). Fig. 4--Maximum octave-band levels from rock-music station (solid
line), and Mobile Fidelity versions of Resplghi's "Feste Romane" (dash
line) and Hall and Oates's Abandoned Luncheonette (semi dash line).
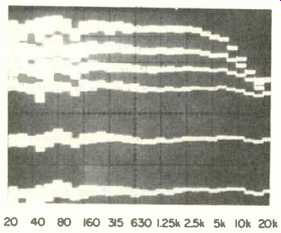
Fig. 5--Spectrum analysis of pink-noise response at +14, +8, +4, 0, -10 and -20 dB recording level.
As a first step, let's consider how recording level meters respond to broadband signals such as music or, for testing purposes, pink noise. A meter that will register a zero-dB level when fed 0.5V at 400 Hz, might register -3 dB for pink noise at the same 0.5V level. The reason is this: The meter will read all the energy in a discrete tone, as long as that tone is within the meter's bandwidth. But if the signal's bandwidth is wider than the meter's, or falls partially outside it, the indicated level will be lower.
The total level for a wide-bandwidth signal is the sum of the power levels of whatever individual bands (octaves, third-octaves, etc.) we are considering. This fundamental fact is one of the reasons that sine-wave testing is of limited use in testing for headroom.
The high-frequency test tone exists without the presence of energy across the band, as would occur in music.
Figure 5 shows a recorder's record/ playback response for pink noise recorded at levels from 20 to + 14 on the recorder's meter. Some high-end roll-off is apparent by 0 dB, and the overall compression is obvious by + 14 dB. At meter zero, the actual level in each band was close to -15 dB; with 30 bands, the total level is 14.8 dB above each individual band.
Referring back to Fig. 4, with the levels set as indicated by these plots, the rock station produced a + 10.5-dB reading, the "Feste Romane" record got an indication of + 11.5, and the Hall and Oates recording showed -3 dB. Considering the MRLs of severa' tapes, we would say that reducing the rock station's input level to normal meter indications should give us plenty of leeway on the high end. A similar reduction would be called for with "Feste Romane," with the possibility that some recorders would still distort its lowest frequencies. The Hall and Oates record is the deceptively challenging one: It has such a nice, smooth sound that the width of its spectrum is not obvious. We can see, however, that increasing its recording level even up to just zero would probably cause some loss at the highest frequencies.
To summarize this section: Although the meter will indicate the total energy in the music being recorded, knowledge of its spectral distribution should help prevent problems at the band limits. Listening carefully to the playback will help in setting record levels high enough for good signal-to-noise ratios.
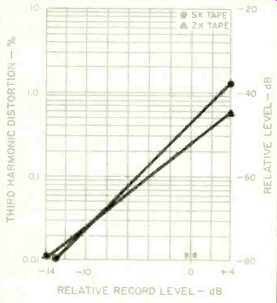
Fig. 6--HDL3 as a function of recording level at 1 kHz with Nakamichi
SX and ZX tapes on 700ZXL recorder.
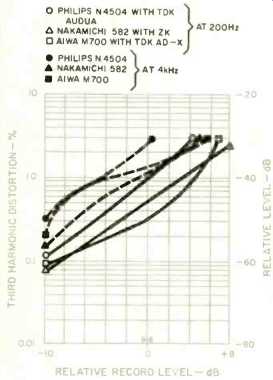
Fig. 7--HDL3 vs. recording level at 200 Hz and 4 kHz for three recorder-tape
combinations.
Distortion
As many readers know, third-harmonic distortion is a fundamental characteristic of magnetic tape. Fifth and higher-ordered odd harmonics also make their appearance at high recording levels. (Even harmonics are usually not characteristic of tape recording.
HDL2, though, does show up regularly in testing, probably from poor bias waveforms, though possibly from leaky capacitors or magnetized heads as well.) The relative third-harmonic level (HDL3) is a square function; when plotted in dB versus recording level, we can expect a 20-dB change in distortion for every 10-dB change in recording level.
Figure 6 shows measured HDL3 vs. recording level for SX and ZX tapes on a Nakamichi 700ZXL recorder. Note how close the measured distortion curves (especially that for ZX tape) are to the theoretical 20-dB change (vertical axis) for each 10-dB change in level (horizontal axis). Note also that the curves are still straight, even at -14 dB record level and a distortion of only about 0.01%. Figure 7 shows a similar plotting for three recorder and tape combinations: The Philips N4504 open-reel deck with TDK Audua, the Nakamichi 582 with ZX tape, and the Aiwa M700 with TDK AD-X. The results are plotted for two frequencies. All recorders showed a considerable increase in distortion with the frequency shift from 200 Hz to 4 kHz, though the increase varied from deck to deck. Even so, there is a general agreement with the 2:1 slope, especially with the 582 deck.
It is interesting that the two cassette decks have lower distortion than the open-reel machine for the same flux level. This is also demonstrated by Fig. 8, which shows the distortion products from recording a 1-kHz tone on the Philips (top) and Nakamichi (bottom) recorders. The open-reel deck had much higher second, third and fifth harmonic distortion, as well as some fourth harmonic not seen in the cassette deck's output. As the vertical scale is 20 dB per division, HDL3 was about 7% for the open-reel deck and 1.1% for the cassette unit. Let it be said that no concerted effort was made to try other tapes with the open reel machine or to optimize its bias for the tape used.
Figure 9, made with the same settings on the spectrum analyzer, shows three runs made with the 582 deck with ZX tape. First, a sweep was made with a zero-level 300-Hz tone. Then, a second sweep was overlaid (top traces) with a 1.5 kHz tone. Both tones produced third harmonics, and there's some HDL2 with the 1.5 kHz.
Finally, both tones were fed in at the same time, with the levels reduced for the same meter reading. The results, in the bottom of the figure, show both expected and unexpected things: Note how the 1.5 kHz appears to have three upper-frequency sidebands, 600 Hz apart. Its own second and third harmonics do not appear, somehow suppressed by the added lower tone.
This points out that the generation of distortion products becomes very complex when more than one tone is involved and there are many more than that with complex musical wave forms. The recordist must accept the fact that the fundamental approach to controlling the generation of distortion products is to avoid high levels as far as noise considerations permit.
Maximum Record/Output Levels
Most people use the criterion of 3% distortion as the maximum allowable output level, which is, of course, tied to the maximum allowable record level for any particular deck. It has been our practice to use MRLs, rather than MOLs, mostly because it tells the recordist what limits are imposed on the signal being recorded. The MRLs are always a bit higher than the MOLs, perhaps a dB or so, reflecting the compression that appears at higher distortion levels.
At the lower frequencies, the MRLs are based upon HDL3 = 3%. Above a few hundred Hz, however, more accurate data is obtained using a twin-tone signal and measuring TTIM (twin-tone intermodulation) distortion, with 3% used as the limit.
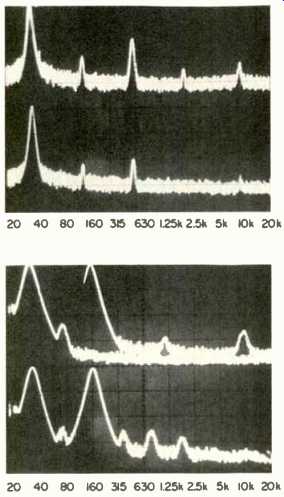
Fig. 8--Distortion products for 1-kHz signal at 200 nWb/m. Top: Philips
N4540 open-reel recorder with TDK Audua (see text). Bottom: Nakamichi
582 deck with ZX tape.
Fig. 9--Distortion with 300-Hz and 1.5-kHz tones. Top: Tones recorded separately, Bottom: Tones recorded simultaneously.
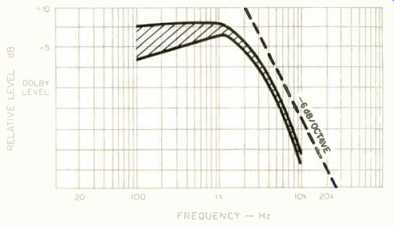
Fig. 10--Range of maximum recording levels for seven Type I tapes with
Nakamichi 582 deck.
In the last year or so, certain characteristics of the MRL curves have emerged, mostly because of more careful data taking and the inclusion of other decks in the test process. Figures 10, 11 and 12 are plottings of the range of MRLs for tape Types I, II and IV, respectively, on a Nakamichi 582 deck. Note that in all cases the spread in levels for the 3% distortion points was greatly reduced above 1 kHz or so. A basic conclusion was this: In any one tape type, there was little basis in the high-frequency MRLs to select one tape over the other. In the low-frequency MRLs, however, the choices were much clearer, and the data did show that the formulations with the best low frequency MRLs were also best at the high end, albeit by small amounts.
There are other facets of these plots worthy of attention. The dashed line in Fig. 11 indicates the much poorer performance of two discontinued tapes.
This figure and Fig. 12 show a gentle S-curve in the high-end MRLs, believed to be caused by the 70-uS record equalization. Previous tests with Type II tapes had shown that switching to 120-µS EQ eliminated the S-ing, increasing the headroom available; however, the change in equalization also leads to an equal increase in noise, so there is no increase in dynamic range.
On each of the figures is a -6 dB/octave reference line from + 10 at 2 kHz to 10 at 20 kHz. We can see that all MRL curves fall off at close to this rate, which our earlier discussions showed to closely match the roll-off in a number of music spectra. Figure 13 shows the MRLs obtained with the same Type I tapes on an Aiwa AD3600 deck. The low-frequency MRLs are nearly the same as for the Nakamichi 582 in Fig. 10, though spread a bit more, and the high-frequency MRLs are a couple of dB lower.
One of the questions on distortion that remained unanswered was: What is the shape of the constant-percentage-distortion curves at less than 3%? Figure 14 presents the results of tests with the 582 and ZX tape from 0.25% to 2% distortion. The curves had quite a consistent shape, but there is some shifting, caused by the onset of compression. It is quite apparent that if a lower percentage of distortion is selected as the allowable limit, record levels must be lower or the spectrum of the music cannot be very wide-band.
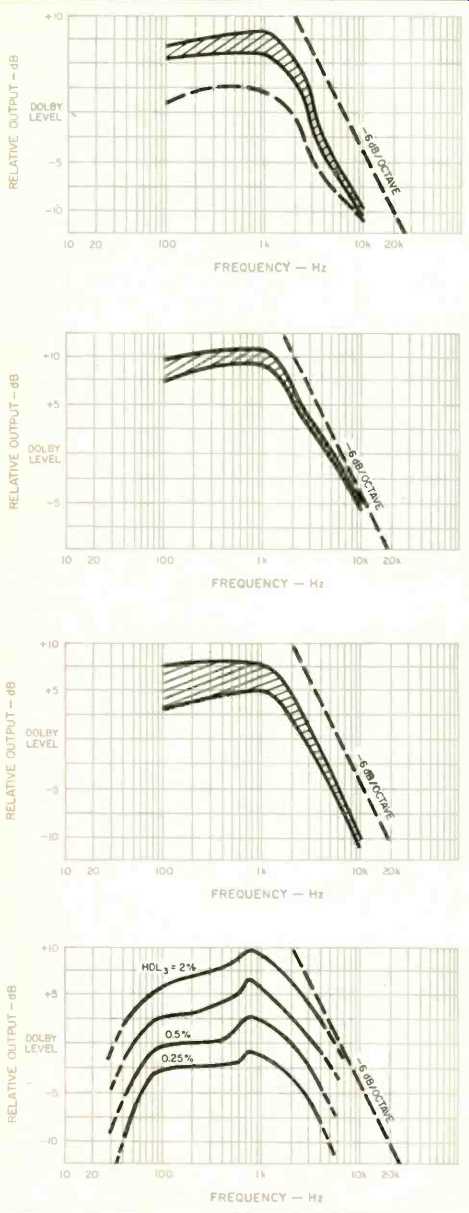
Fig. 11-- Range of MRLs for five Type II tapes.
Fig. 12-- Range of MRLs for five Type IV tapes.
Fig. 13--Range of MRLs with Type I tapes on Aiwa AD3600 deck.
Fig. 14--Output levels for constant distortion percentages, using Nakamichi 582 deck and ZX tape.
Tape Noise
To some extent the recordist may very well feel that he is continually trying to steer his way between the Scylla of distortion and the Charybdis of tape noise. There is no doubt that there is lower noise with 70-uS EQ, and noise reduction has been an essential part of the cassette format in particular for some time. Figure 15 shows tape noise spectra with the 582 and ZX tape for three conditions: 120-µS EQ without NR, 70-uS EQ without NR and then with Dolby B NR. There is no doubt about the successive reduction in noise, and Dolby B shows benefits down to 400 Hz. Figure 16 shows the results of the same tests, but with BASF Professional II tape. The improvement over ZX tape is obvious in all three cases, with some reduction all the way down to 200 Hz. The benefits increase with frequency, up to about 4 dB at the high end. In fact, the BASF tape had about the same spectrum with 120-µS EQ as the ZX tape did with 70-uS EQ. There are differences in noise from one tape to another, and the dynamic range at higher frequencies could very well be determined by tape noise. The low-noise BASF tape would be a candidate for recording with 120-µS EQ for higher MRLs, albeit bringing up noise the same amount.
Bias Adjustment
As we stated earlier, there are relatively few recordists who adjust EQ as any sort of regular process. Adjusting bias, however, has become a common practice for quite a few cassette deck owners to get the most of whatever tape is tried. Figure 17 is provided as an aid to understanding the interrelationships of levels and distortion as the bias is changed. The figure is actually a time plot with bias being turned up from minimum to maximum during the sweep. The results shown are to be expected: The 315-Hz and 10-kHz levels increase with bias, but a point is reached where the high-frequency level is dropping rapidly, and the low frequency has reached its highest-level plateau. The 10-kHz level was at 20 dB, so the marked operating point has produced flat response. A short way up the bias-level curve, HDL3 drops sharply, but then rises to a peak of over 3%. At the operating point, HDL3 is slightly under 1%. Further increase in the bias does lower the distortion further, but with a severe drop in the 10-kHz level, and the 315-Hz level is starting to drop. The general guideline is that bias should be set high enough to get acceptably low distortion without unacceptable losses at the highest frequencies and without any bringing down of low-frequency levels.
While this article is quite lengthy, some areas have not been gone into in great detail. We hope that what has been presented will provide a framework to understand better the commonalities in tape recording.
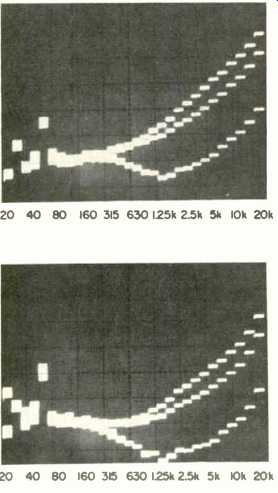
Fig. 15--Tape noise spectra with 582 deck and ZX tape. Top: 120-uS EQ
without NR. Middle: 70-uS EQ without NR. Bottom: 70-uS EQ with Dolby
B.
Fig. 16--Same as Fig. 15, but using BASF Professional II tape.
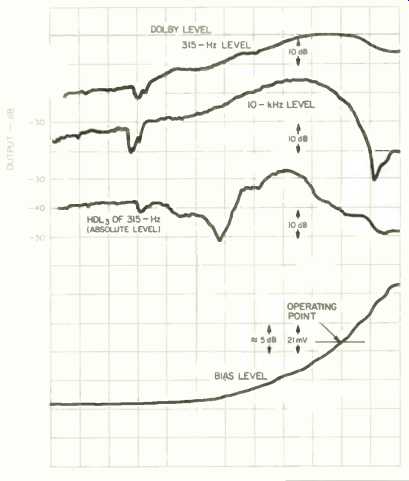
Fig. 17--Variations in 315-Hz and 10-kHz levels and 315-kHz distortion
with changing bias level (Maxell XLII-S tape Nakamichi 582 deck).
Bibliography
Kraus, John D., and Keith R. Carver, "Electromagnetics," McGraw-Hill, 1973.
Jorgensen, Finn, "The Complete Handbook of Magnetic Recording," TAB Books, 1980. Vogelgesang, Peter, "Performance of High-Energy Magnetic Materials in Audio Cassette Recording Tapes," Audio, September, 1978.
Cabot, Richard C., et al., "Sound Levels and Spectra of Rock Music," AES Preprint No. 1358.
Queen, Daniel, "Distribution of Maximum RMS Spectrum Levels in Live Music Samples," AES Preprint No. 1082.
Luce, David A., "Dynamic Spectrum Changes of Orchestral Instruments," Jour. of the AES, Vol. 23, No. 7 (September, 1975).
(Source: Audio magazine, Sept. 1982)
Also see:
Refocus on Demagnetization (Sept. 1982)
Open Reel Recorders (The Mechanism Of Magnetic Tape Erasure; Focus On Head Demagnetization) (April 1981)
Performance of High Energy in Magnetic Materials in Audio Cassette Recording Tapes (Sept. 1978)